Original data analysis · Published October 16, 2026
Cleaning looks like a market full of small operators. In 2022, just 753 multiunit janitorial companies collected $29.9 billion: 41.1% of employer-firm revenue from 1.2% of the firms. Their footprint was much bigger than their headcount in a business directory would suggest.
We compared six everyday service industries using the Census Bureau’s single-unit and multiunit firm tables. Electrical contractors and childcare show a similar gap. Landscaping and beauty salons leave a larger share of revenue with single-unit employers.
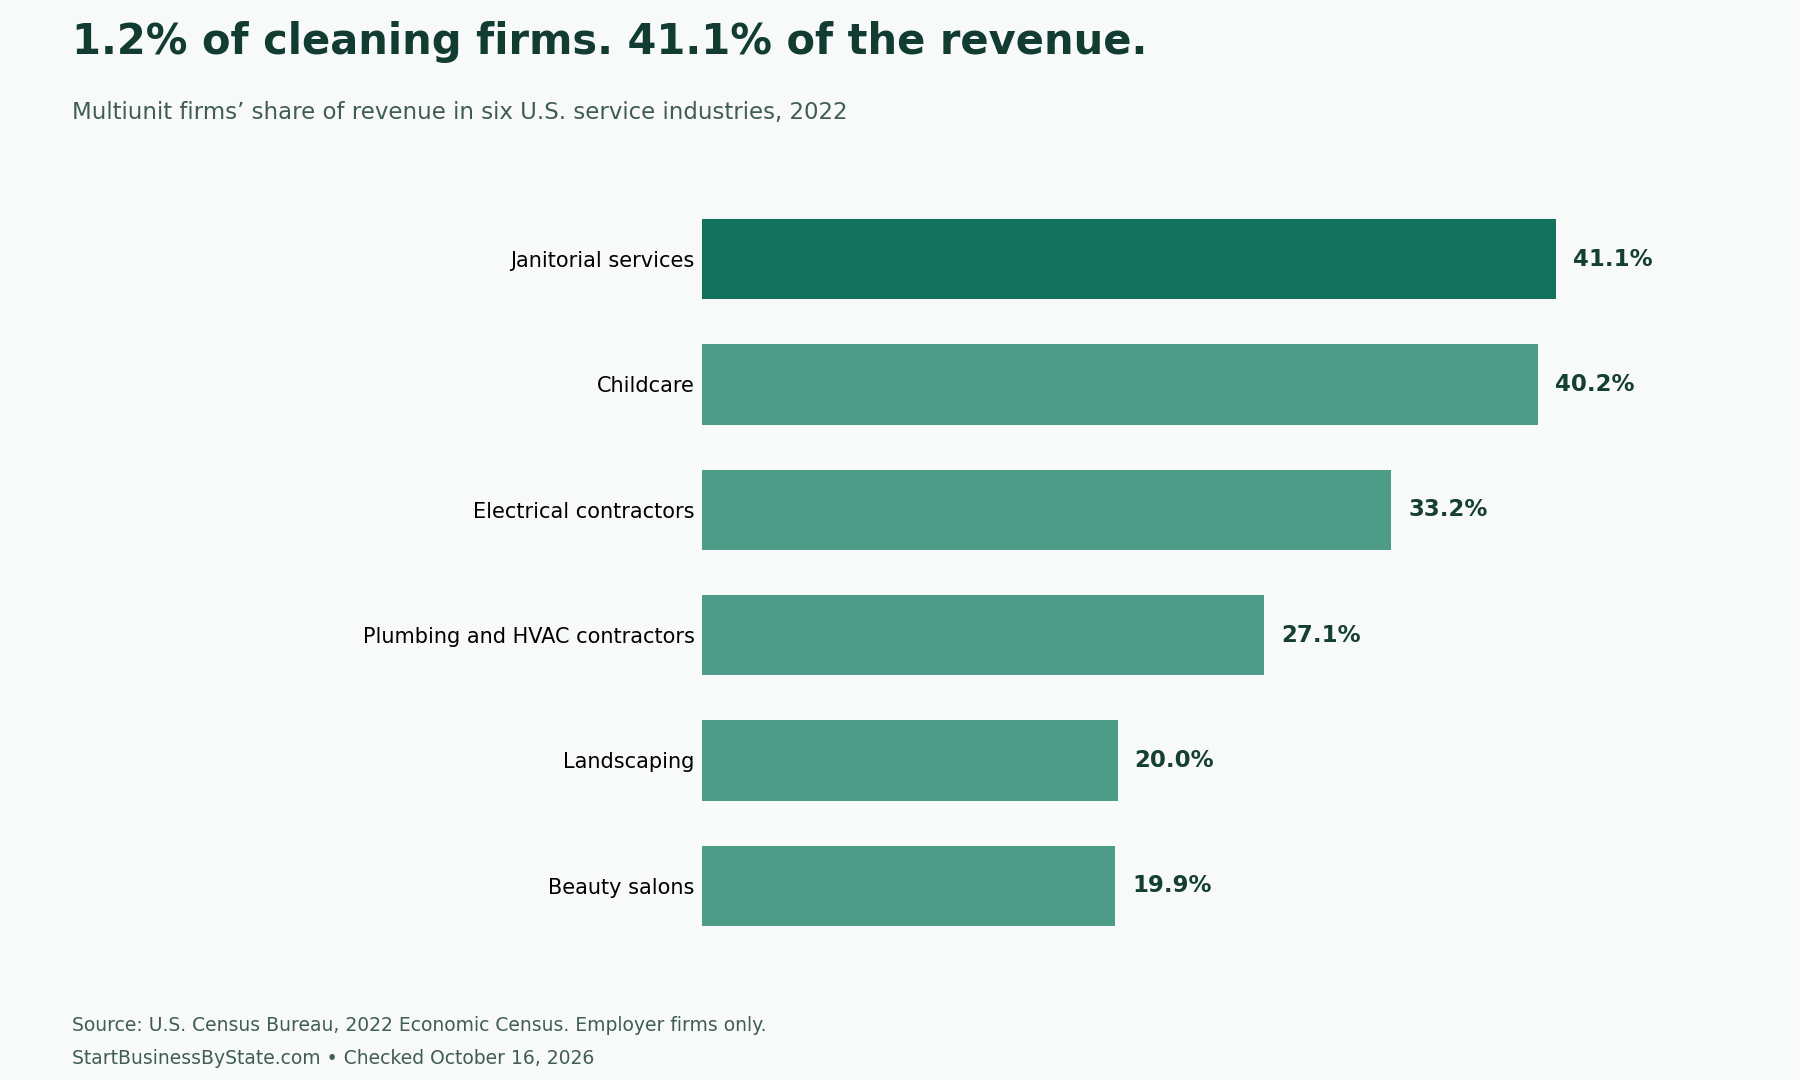
A small slice of firms can take a large slice of sales
For every $100 of janitorial employer revenue, about $41 went to multiunit firms. Their share was roughly $33 in electrical contracting and $27 in plumbing and HVAC. These are national market shares, so a particular city can look quite different.
| Industry / NAICS | All employer firms | Multiunit firms | Multiunit share of firms | Multiunit share of revenue |
|---|---|---|---|---|
| Janitorial services / 561720 | 63,999 | 753 | 1.18% | 41.13% |
| Childcare / 624410 | 63,487 | 3,658 | 5.76% | 40.24% |
| Electrical contractors / 238210 | 78,975 | 941 | 1.19% | 33.19% |
| Plumbing and HVAC contractors / 238220 | 112,088 | 982 | 0.88% | 27.06% |
| Landscaping / 561730 | 114,570 | 706 | 0.62% | 20.01% |
| Beauty salons / 812112 | 73,148 | 1,448 | 1.98% | 19.88% |
The dollars left with single-unit businesses
Multiunit revenue concentration does not erase the independent market. Single-unit janitorial employers generated $42.7 billion. In landscaping, single-unit employers collected about four-fifths of the revenue. A national chain’s presence alone tells you little about the opportunity to serve a specific customer, neighborhood or specialized job.
| Industry | Total employer revenue | Multiunit revenue | Single-unit revenue |
|---|---|---|---|
| Janitorial services | $72.61B | $29.86B | $42.75B |
| Childcare | $58.43B | $23.51B | $34.92B |
| Electrical contractors | $249.25B | $82.72B | $166.53B |
| Plumbing and HVAC contractors | $297.61B | $80.54B | $217.07B |
| Landscaping | $115.41B | $23.09B | $92.31B |
| Beauty salons | $25.66B | $5.10B | $20.56B |
What “multiunit” actually tells us
A multiunit company operates more than one establishment. Census can classify a firm as multiunit even when it has only one establishment in the selected industry and other establishments elsewhere. Firm counts and location counts answer different questions.
The table does not identify private-equity ownership, acquisition history or franchise status. A locally owned company can operate several locations. Separately owned franchisees can be separate firms. Calling these figures a private-equity takeover or a franchise market share would go beyond the evidence.
How to use the comparison before starting
Choose a customer and a service scope before deciding how large your business needs to become. A cleaner serving medical offices, a residential team and a national facilities contractor face different schedules, contracts and staffing needs. The national revenue totals do not supply their prices or profit margins.
For a lawn-care route, the landscaping business setup guide connects pricing, equipment and coverage. For licensed electrical work, start with the electrician business guide.
Sources and method
Checked October 16, 2026. Source: 2022 Economic Census table EC2200SIZESUMU, retrieved through the Census firm-size API. We selected all establishments, U.S. geography, and NAICS 561720, 561730, 624410, 812112, 238220 and 238210.
Multiunit firm share = multiunit FIRM ÷ all FIRM. Revenue share uses RCPTOT on the same basis. We multiplied source revenue by 1,000 to convert it to dollars and checked that single-unit plus multiunit figures reconcile to each industry total. Relevant count and revenue cells were not suppressed. Percentages use unrounded values.
This is a six-industry, 2022 employer-firm snapshot. It excludes nonemployers and does not measure current growth, ownership concentration by named company, local competition, profit or customer demand. Plumbing and HVAC share one Census industry in this table; beauty salons exclude separately classified barber shops and nail salons.
Cite this study
StartBusinessByState.com. “Who Gets the Money in “Boring” Businesses.” Published October 16, 2026. https://startbusinessbystate.com/who-gets-the-revenue-in-service-businesses/.
Our original analysis and graphic are available under CC BY 4.0. Credit this study and link to this page when reusing them. Underlying source materials retain their own terms and remain available from the original agencies. This permission applies to our original analysis and graphic, not to the source publications.
Embed the chart with a credit link
<figure><a href="https://startbusinessbystate.com/who-gets-the-revenue-in-service-businesses/"><img src="https://startbusinessbystate.com/wp-content/uploads/2026/10/who-gets-the-revenue-in-service-businesses.png" alt="Who Gets the Money in “Boring” Businesses?" style="max-width:100%;height:auto"></a><figcaption>Source: <a href="https://startbusinessbystate.com/who-gets-the-revenue-in-service-businesses/">StartBusinessByState.com</a></figcaption></figure>