Employee payroll equaled 43.3% of U.S. cleaning-business revenue in 2022 for employer establishments in the Census Bureau’s janitorial-services industry. That is $31.4 billion in annual payroll divided by $72.6 billion in revenue. State/DC shares ranged from 34.4% in Alabama to 51.6% in Massachusetts.
Analysis published September 17, 2026 · Data year: 2022 Economic Census · 50 states + DC · NAICS 561720. This is an observed industry ratio, not a recommended payroll budget or a measure of profit.
Building a hiring budget? Use the cleaning employee-cost calculator to add employer taxes, insurance assumptions and paid time that cannot be billed. Our cleaning-business insurance guide explains coverage to evaluate separately from wages.
What does “43.3% of revenue” actually mean?
For every $100 of revenue reported by this employer industry, about $43.26 was employee payroll. The remaining $56.74 was not profit: it still had to support other expenses and any eventual earnings. This dataset does not tell us how that remainder was divided.
Census payroll includes employee wages and salaries, bonuses and paid leave; it is broader than cleaners’ wages on billable jobs. It excludes the employer’s payroll taxes, insurance premiums and other employer-paid benefits. Unincorporated owners’ and partners’ profit or compensation is also excluded. Corporate officer pay can be included. These distinctions follow the Census payroll glossary.
The study covers employer establishments classified as janitorial services (NAICS 561720). It does not measure every business loosely described as “cleaning,” nor businesses without paid employees. An establishment is a business location, not necessarily a separate company. For the difference between employer revenue and businesses without employees, see our cleaning-business revenue study.
Cleaning-business payroll percentage by state
Massachusetts had the highest aggregate share, followed by Iowa, Illinois, Maryland and Connecticut. Alabama had the lowest, followed by Utah, Vermont, Florida and Rhode Island. 28 of the 51 state/DC ratios exceeded the national ratio. These comparisons describe the reported payroll/revenue mix; they do not establish which states have the most profitable cleaning businesses.
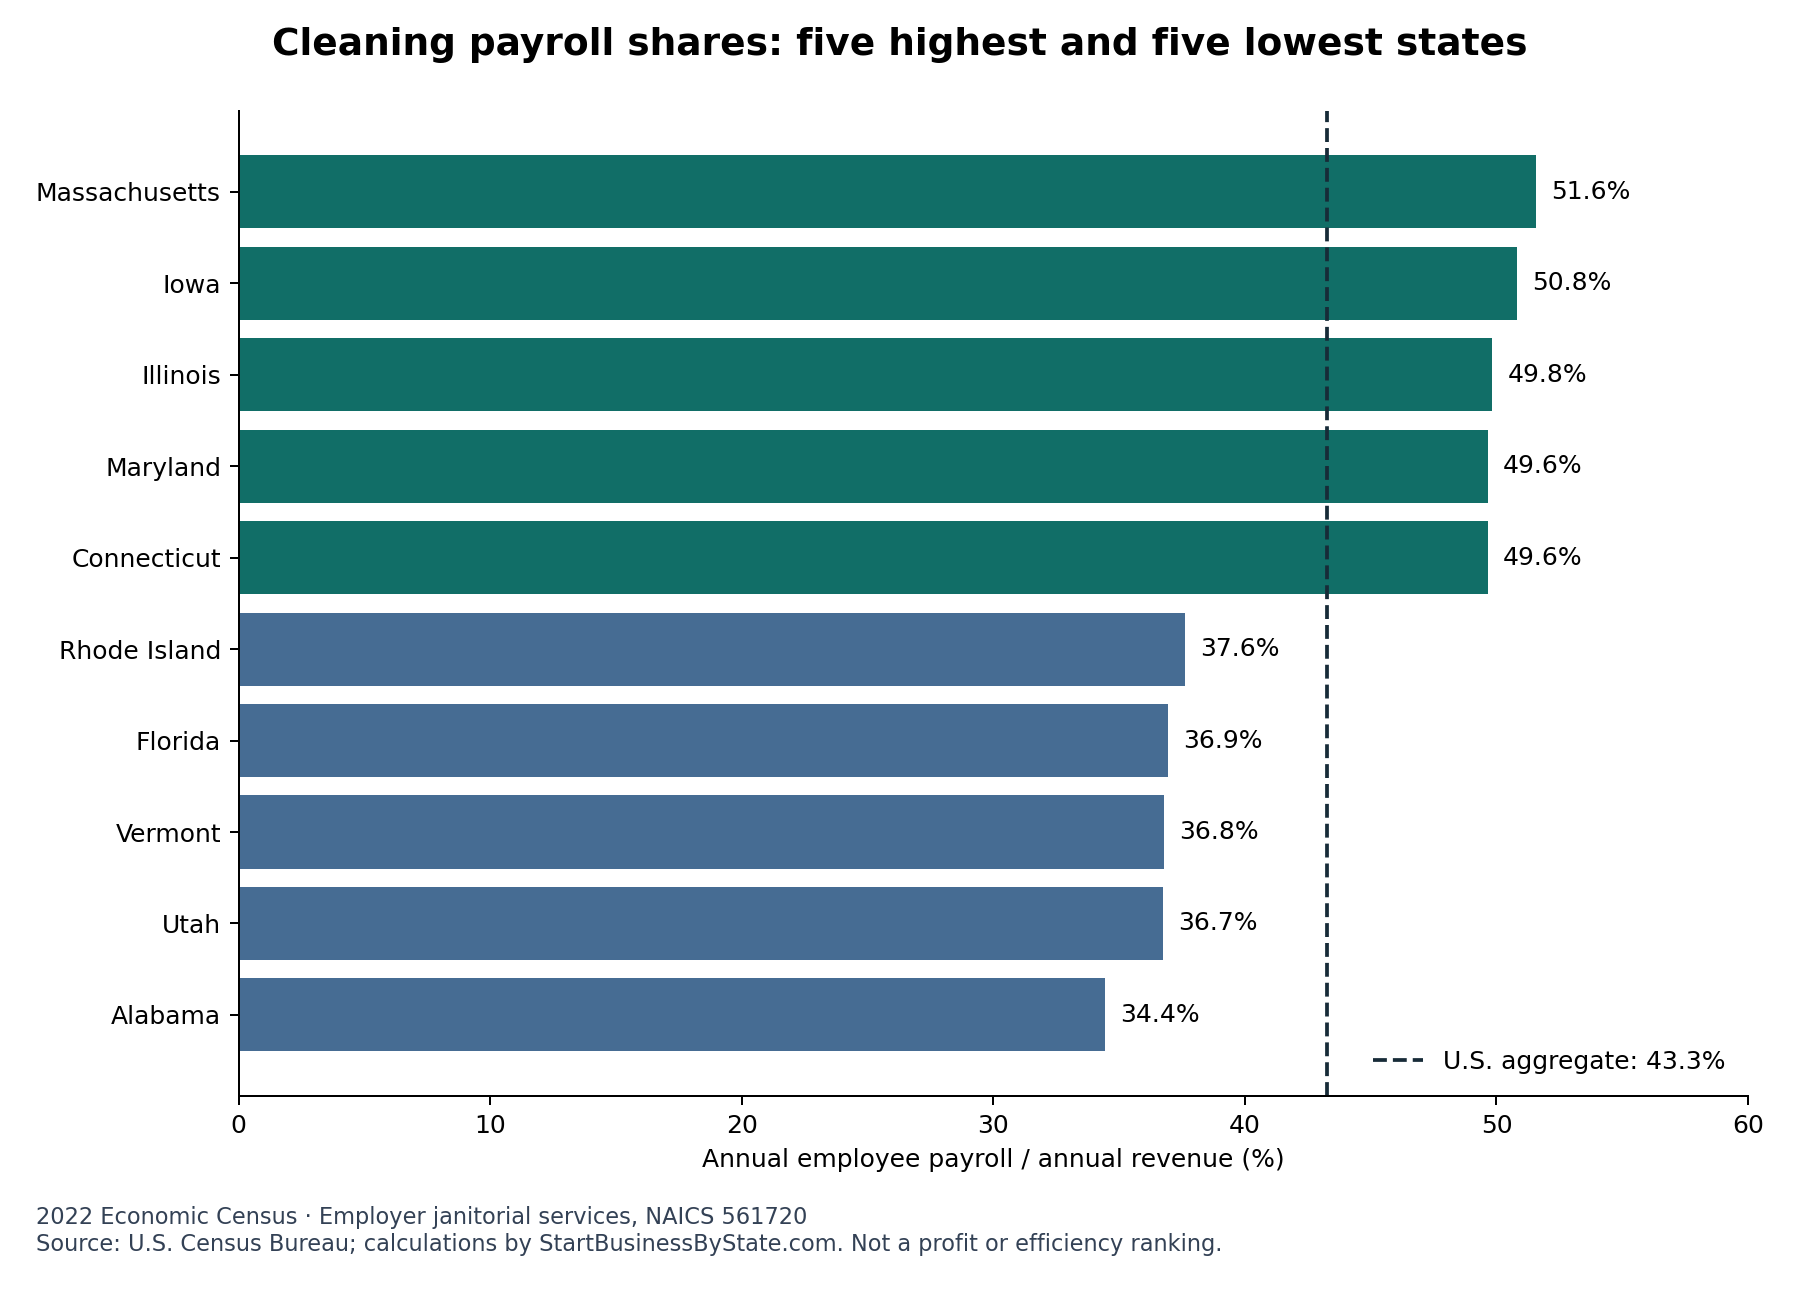
Dollar columns below are millions of dollars, rounded to one decimal. Percentages use unrounded source totals. State names open the matching cleaning-business startup guide.
51 of 51 state/DC rows shown
| State / DC | Payroll share | Payroll ($M) | Revenue ($M) | Establishments |
|---|---|---|---|---|
| Massachusetts | 51.6% | $1,197.2 | $2,321.3 | 1,727 |
| Iowa | 50.8% | $285.1 | $560.9 | 658 |
| Illinois | 49.8% | $1,842.0 | $3,696.7 | 2,598 |
| Maryland | 49.6% | $814.9 | $1,641.5 | 1,481 |
| Connecticut | 49.6% | $433.4 | $873.1 | 683 |
| Missouri | 49.6% | $515.0 | $1,037.7 | 1,219 |
| District of Columbia | 49.6% | $131.2 | $264.5 | 124 |
| Montana | 47.1% | $87.3 | $185.5 | 498 |
| Wisconsin | 47.0% | $450.6 | $957.9 | 1,258 |
| Delaware | 46.8% | $88.3 | $188.6 | 290 |
| South Dakota | 46.5% | $49.0 | $105.5 | 255 |
| Minnesota | 46.1% | $472.6 | $1,024.6 | 1,409 |
| New Mexico | 46.1% | $95.0 | $206.2 | 328 |
| New Jersey | 45.5% | $1,078.6 | $2,368.5 | 2,062 |
| South Carolina | 45.4% | $482.9 | $1,063.5 | 1,131 |
| Nebraska | 45.4% | $180.3 | $397.1 | 513 |
| Maine | 45.1% | $95.3 | $211.1 | 399 |
| Indiana | 44.8% | $436.5 | $974.0 | 1,261 |
| West Virginia | 44.8% | $59.8 | $133.6 | 190 |
| North Dakota | 44.5% | $73.0 | $163.8 | 248 |
| Nevada | 44.4% | $244.5 | $551.0 | 831 |
| Georgia | 44.3% | $1,180.1 | $2,662.9 | 2,104 |
| Michigan | 44.1% | $821.8 | $1,862.8 | 1,743 |
| Colorado | 44.0% | $603.3 | $1,370.4 | 1,608 |
| Texas | 44.0% | $2,465.5 | $5,604.2 | 3,894 |
| Tennessee | 43.9% | $815.3 | $1,859.0 | 1,165 |
| New York | 43.6% | $2,638.7 | $6,045.4 | 3,743 |
| Mississippi | 43.6% | $103.3 | $236.7 | 365 |
| Washington | 43.0% | $666.3 | $1,550.5 | 2,131 |
| Oklahoma | 42.6% | $214.9 | $504.2 | 598 |
| Oregon | 42.6% | $302.6 | $710.2 | 1,253 |
| Kentucky | 42.4% | $297.8 | $701.6 | 650 |
| Alaska | 42.3% | $51.2 | $121.0 | 251 |
| Arizona | 42.2% | $716.6 | $1,696.6 | 1,285 |
| Idaho | 42.2% | $118.4 | $280.4 | 647 |
| Ohio | 41.8% | $889.2 | $2,126.0 | 2,001 |
| Wyoming | 41.5% | $40.1 | $96.7 | 239 |
| Virginia | 41.4% | $1,157.6 | $2,793.0 | 2,183 |
| Hawaii | 41.4% | $124.8 | $301.9 | 370 |
| Kansas | 41.1% | $231.2 | $562.0 | 663 |
| North Carolina | 40.4% | $822.9 | $2,035.0 | 2,311 |
| California | 40.3% | $4,031.9 | $10,002.0 | 6,785 |
| Arkansas | 40.3% | $277.3 | $688.5 | 468 |
| Pennsylvania | 39.9% | $1,147.4 | $2,874.5 | 2,528 |
| New Hampshire | 39.8% | $87.2 | $219.0 | 401 |
| Louisiana | 38.9% | $232.6 | $598.4 | 660 |
| Rhode Island | 37.6% | $120.2 | $319.4 | 289 |
| Florida | 36.9% | $1,543.2 | $4,177.7 | 6,679 |
| Vermont | 36.8% | $68.6 | $186.3 | 208 |
| Utah | 36.7% | $256.9 | $699.4 | 987 |
| Alabama | 34.4% | $275.2 | $799.4 | 736 |
Download all 51 state/DC rows as CSV, including full-dollar totals and source flags.
How to use this number in a cleaning-business budget
Explore cleaning-business cash gap before customer payments arrive with a 13-week scenario that accounts for setup costs, weekly expenses and delayed customer payments. Enter your own costs and collection timing to estimate the cash gap before adding staff.
- Calculate your own ratio consistently. Divide annual employee payroll by annual revenue for the same period. A hypothetical $200,000 payroll on $500,000 revenue is 40%. Comparing weekly payroll with annual revenue, or direct job wages with total industry payroll, gives a misleading result.
- Account for who performs the work. Owner labor, employee labor and purchased subcontractor services do not enter payroll in the same way. An owner-operated business with little payroll can still require substantial work. A lower employee-payroll ratio alone does not demonstrate lower total labor cost.
- Add costs outside payroll. Budget employer taxes, workers’ compensation and other insurance, benefits, supplies, vehicles, equipment and administration using your own figures. Do not read the 56.7% remainder as available take-home pay.
- Check job economics separately. Paid travel, training and downtime affect the billable hours supported by payroll. Use the employee-cost calculator to test your assumptions; its adjustable scenarios answer a different question from these historical industry totals.
The payroll percentage does not include employer-paid insurance premiums. Review cleaning insurance coverage and quote options alongside your hiring plan. The national ratio cannot tell you your premium or which coverage your state or customer requires.
Why a higher share does not prove a business is less profitable
A ratio has two moving parts: payroll and revenue. It can change with wage levels, pricing, the type of work, staffing arrangements and the mix of establishments. This analysis does not isolate those causes or control for company size, residential versus commercial work, or subcontracting.
For example, a business paying more in wages may also charge more. Another may show less employee payroll because its owner performs work or it purchases outside services. Neither example establishes the actual explanation for any state in the table. Use the state figure as context for asking better budget questions, not as an efficiency score or a target to copy.
Sources, calculation and downloadable data
Source: U.S. Census Bureau, 2022 Economic Census, Basic Statistics, NAICS 2022 code 561720. We retrieved national and state records from the 2022 Economic Census API dataset on September 17, 2026 (September 18 UTC).
Payroll share (%) = annual payroll (PAYANN) ÷ annual revenue (RCPTOT) × 100.
The national calculation is $31,414,831,000 ÷ $72,611,377,000 × 100 = 43.2643%, displayed as 43.3%. Both source variables are reported in thousands of dollars; the download converts them to dollars. The same formula is applied independently to each state and DC. State payroll and revenue totals reconcile with the national totals.
The national result is a ratio of totals, not an unweighted average of state percentages or the median cleaning company’s payroll share. The table uses the same year, industry definition and employer universe for both sides of the calculation. Amounts are nominal 2022 dollars. These are not 2026 payroll observations.
All 51 state/DC rows returned positive revenue and no suppression flags for the two ratio variables. Published Census figures can involve imputation and disclosure protections; small differences should not be treated as statistically significant. Raw payroll/revenue flags and imputation-range codes are retained in the CSV without translating those codes into percentages. See the API variable definitions and 2022 data dictionary.
Download the state dataset (CSV) · Download the comparison chart. To cite this analysis: StartBusinessByState.com, “Cleaning Business Payroll Percentage: State Benchmarks,” published September 17, 2026, calculations from the U.S. Census Bureau’s 2022 Economic Census. Please identify the data year when reusing a figure.
Common questions about cleaning payroll percentages
What percentage of cleaning revenue should go to payroll?
The observed U.S. employer-industry ratio was 43.3% in 2022, but this study does not establish an ideal percentage. Your budget depends on staffing, owner labor, pricing, job mix and other costs. Compare consistent payroll definitions before using an industry benchmark.
Is the other 56.7% a cleaning company’s profit margin?
No. It is revenue left after employee payroll only. Other costs and any profit are still contained in that remainder. This dataset cannot supply a profit-margin estimate.
Does this include solo house cleaners?
No. Businesses without paid employees are outside this employer-establishment comparison. Their receipts and owner income should not be mixed with the payroll numerator used here.
Which state has the highest cleaning payroll share?
Massachusetts, at 51.6% of employer janitorial-services revenue in 2022. Alabama had the lowest share, at 34.4%. These are aggregate historical ratios, not individual-company results or recommendations about where to start.
When you turn payroll cost into a customer price, assemble the bid from scoped labor hours, employer burden, supervision, supplies, equipment, travel and overhead — and choose margin vs markup carefully. See how to price a commercial cleaning contract (includes a downloadable bid worksheet). Payroll share is not itself a recommended profit margin.
For licensing, registration and practical next steps, return to the cleaning-business startup guides by state.