Research edition: September 15, 2026 · Nonemployer data: 2023 · Employer data: 2022
U.S. cleaning businesses without paid employees averaged $20,785 in annual gross receipts in 2023. But the average hides a wide spread: 79.7% reported less than $25,000, and 2.6% reported $100,000 or more. These figures describe businesses in Census’s Janitorial Services category—not an owner’s salary or profit.
We analyzed Census business counts, receipt totals and revenue brackets to answer how much cleaning businesses generate, how the figures differ by state, and why a business with employees needs a different benchmark. The data and calculations are downloadable below.
No paid employees · 2023
No paid employees · 2023
Janitorial Services · 2023
Source: 2023 Census Nonemployer Statistics and national revenue-bracket counts. Calculations by StartBusinessByState.com.
Most nonemployer cleaning businesses report under $25,000
Census counted 1,095,927 janitorial businesses with no paid employees and $22.779 billion in total receipts in 2023. Dividing receipts by businesses gives a mean of $20,785. “Nonemployer” does not necessarily mean one person working alone: the category can include partnerships and corporations, and the business may be a secondary source of income.
The distribution is more useful than treating that mean as an earnings promise. Of the businesses counted, 873,778 reported less than $25,000 in annual receipts. At the other end, 28,348 reported at least $100,000. We cannot tell from these tables how many hours they operated, whether they were active all year, or what expenses they paid.
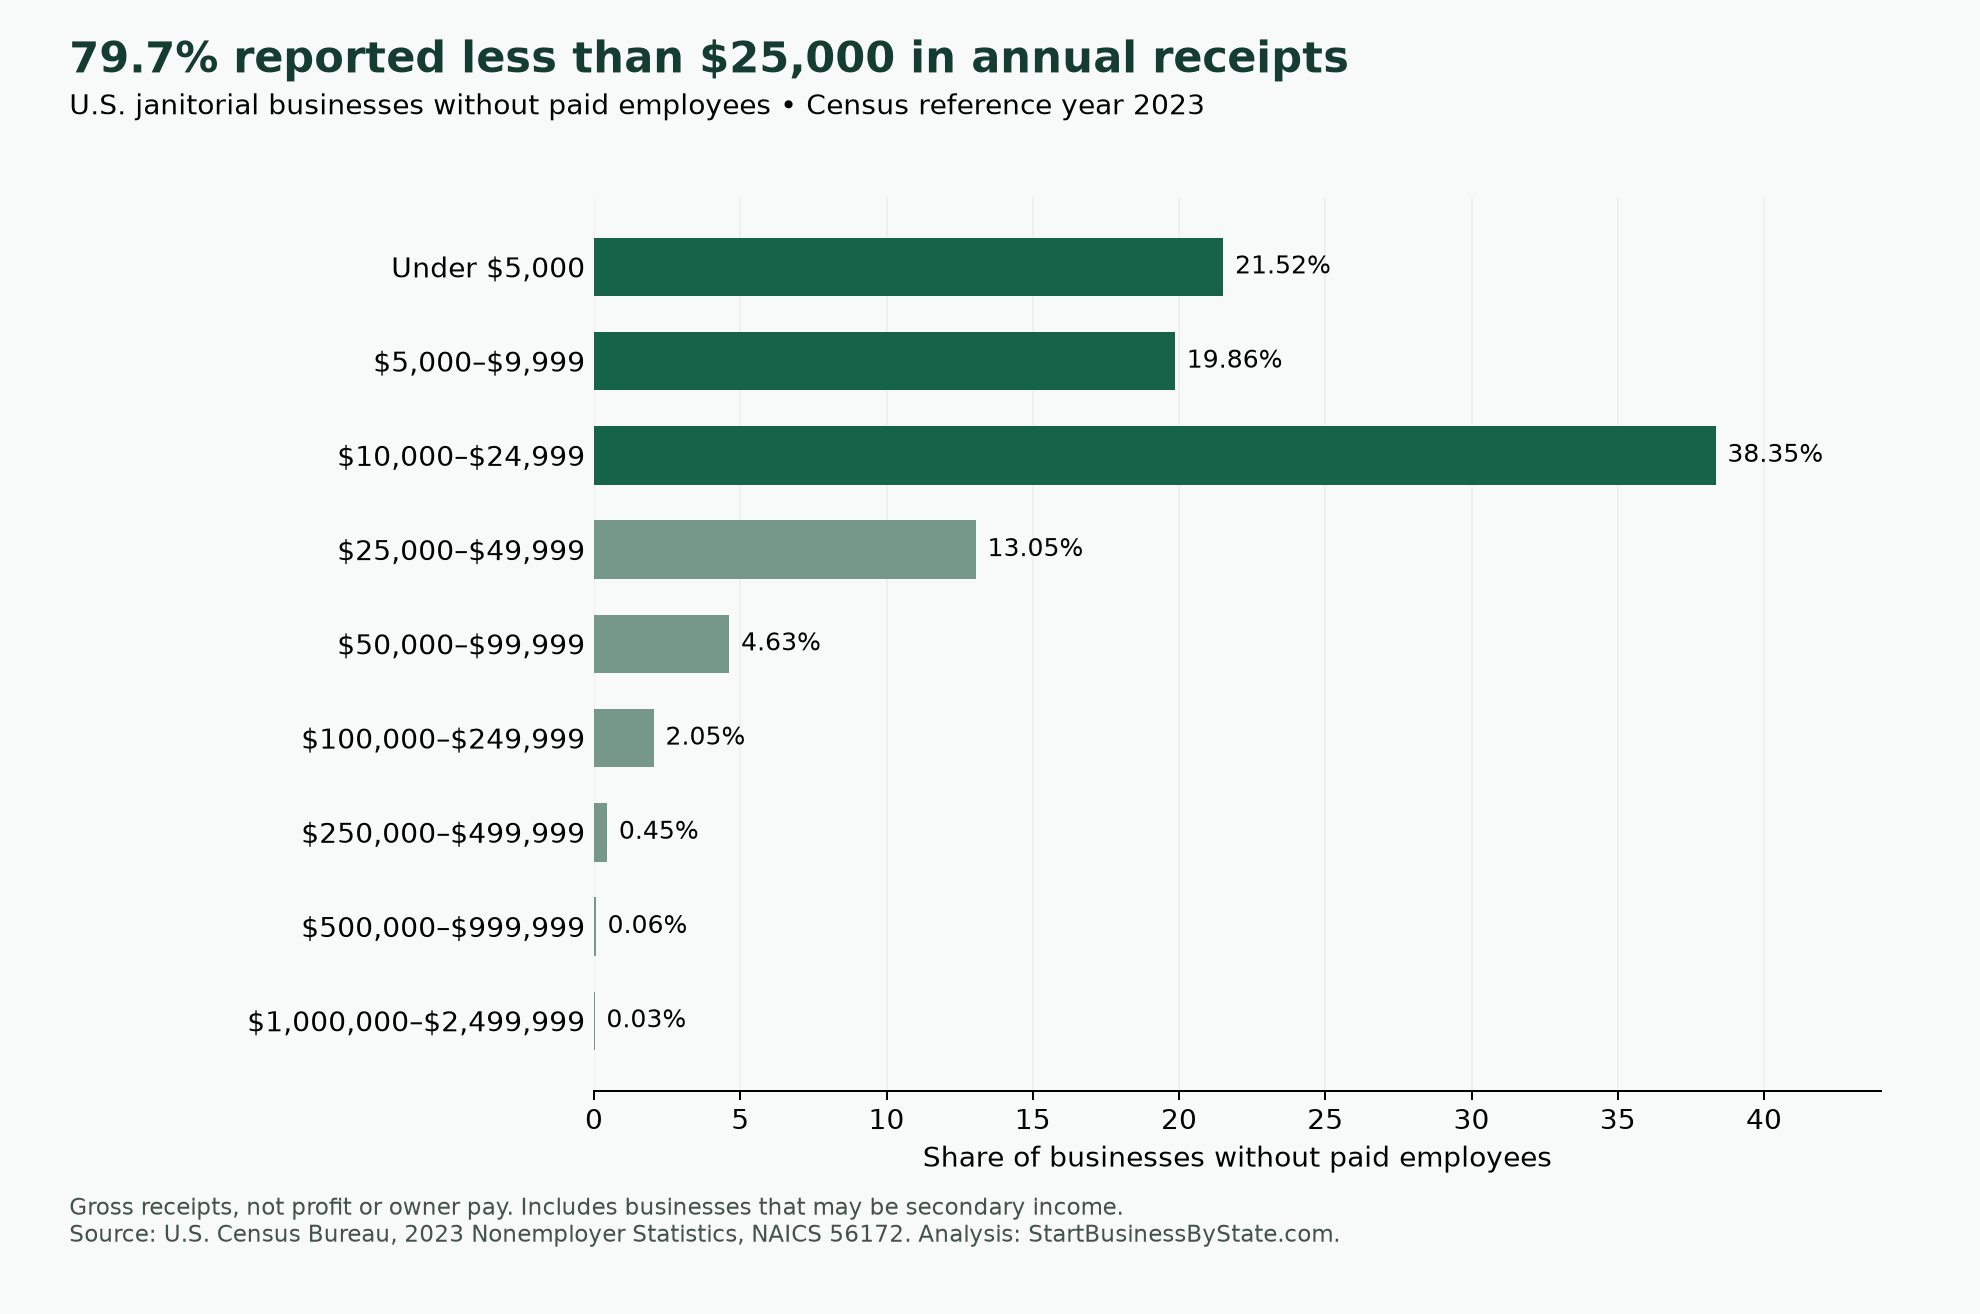
| Annual receipts | Businesses | Share |
|---|---|---|
| Under $5,000 | 235,813 | 21.52% |
| $5,000–$9,999 | 217,703 | 19.86% |
| $10,000–$24,999 | 420,262 | 38.35% |
| $25,000–$49,999 | 143,065 | 13.05% |
| $50,000–$99,999 | 50,736 | 4.63% |
| $100,000–$249,999 | 22,417 | 2.05% |
| $250,000–$499,999 | 4,946 | 0.45% |
| $500,000–$999,999 | 706 | 0.06% |
| $1,000,000–$2,499,999 | 279 | 0.03% |
The middle business falls in the $10,000–$24,999 bracket: 41.4% are below $10,000, and 79.7% are below $25,000. This identifies a median bracket, not an exact median. We do not estimate an exact median by assuming businesses are evenly distributed inside that range.
The lowest bracket is subject to Census’s $1,000 annual-receipts inclusion threshold for this industry. The published counts sum to the national total. These are shares of businesses, not shares of industry revenue; Census does not publish receipt totals for these individual brackets.
Businesses with employees: a separate $72.6 billion market in 2022
The 2022 Economic Census reports 68,108 employer establishments in Janitorial Services and $72.611 billion in revenue. That works out to $1,066,121 per establishment. An establishment is a business location; a company can operate several. This is not average revenue per owner or per company.
| Benchmark | Without paid employees | With paid employees |
|---|---|---|
| Reference year | 2023 | 2022 |
| Census dataset | Nonemployer Statistics | Economic Census |
| Counting unit | Business tax-return unit | Establishment / location |
| Count | 1,095,927 businesses | 68,108 establishments |
| Total receipts / revenue | $22,779,360,000 | $72,611,377,000 |
| Mean per counting unit | $20,785 | $1,066,121 |
Do not combine these totals into a single market-size estimate. They refer to different years and units. The gap is not a measured payoff from hiring employees, a growth forecast, or evidence that the typical new cleaning company makes $1 million.
Employer revenue is revenue before the business pays its costs. The mean can be influenced by large operations, and this extraction does not provide an employer median. Use the employer figure to understand the scale of the population, not as a first-year sales target. View the Economic Census national figures.
Cleaning-business revenue by state
State receipts totals answer a different question from payroll status. For how often cleaning (and peer service) establishments have no paid employees by state in 2023, see nonemployer share by state.
Revenue and expansion answer different questions. Compare cleaning-business location and employment growth by state for 2018–2023 to see where employer counts increased, and whether jobs moved in the same direction.
Massachusetts has the highest nonemployer mean receipts, at $34,034, followed by Hawaii at $32,216. The comparison includes all 50 states and Washington, DC, with the number of businesses shown so a small population is visible. These are nominal historical dollars, without adjustment for local prices or operating costs.
A higher mean does not establish higher profit or a better place to start. Differences can reflect service mix, business scale, hours worked and other factors that these tables cannot isolate. Nonemployer geography generally follows the owner’s mailing address, which need not be where every cleaning job occurred.
Showing all 51 jurisdictions.
| State | Nonemployer businesses 2023 |
Mean receipts / business 2023 |
Employer establishments 2022 |
Mean revenue / establishment 2022 |
|---|---|---|---|---|
| Alabama | 19,663 | $17,208 | 736 | $1,086,173 |
| Alaska | 1,583 | $21,414 | 251 | $481,884 |
| Arizona | 20,374 | $24,890 | 1,285 | $1,320,295 |
| Arkansas | 10,534 | $16,574 | 468 | $1,471,128 |
| California | 111,227 | $23,465 | 6,785 | $1,474,131 |
| Colorado | 17,628 | $26,738 | 1,608 | $852,240 |
| Connecticut | 8,407 | $23,812 | 683 | $1,278,281 |
| Delaware | 2,358 | $23,854 | 290 | $650,197 |
| District of Columbia | 1,038 | $19,140 | 124 | $2,132,855 |
| Florida | 166,471 | $20,849 | 6,679 | $625,504 |
| Georgia | 53,596 | $21,575 | 2,104 | $1,265,632 |
| Hawaii | 4,473 | $32,216 | 370 | $815,822 |
| Idaho | 5,104 | $18,128 | 647 | $433,388 |
| Illinois | 35,837 | $20,031 | 2,598 | $1,422,900 |
| Indiana | 16,523 | $17,962 | 1,261 | $772,379 |
| Iowa | 6,655 | $18,004 | 658 | $852,407 |
| Kansas | 7,045 | $19,106 | 663 | $847,605 |
| Kentucky | 14,010 | $16,430 | 650 | $1,079,437 |
| Louisiana | 19,154 | $16,368 | 660 | $906,612 |
| Maine | 4,408 | $18,824 | 399 | $529,103 |
| Maryland | 17,753 | $24,650 | 1,481 | $1,108,366 |
| Massachusetts | 16,439 | $34,034 | 1,727 | $1,344,136 |
| Michigan | 29,357 | $18,124 | 1,743 | $1,068,733 |
| Minnesota | 10,783 | $21,783 | 1,409 | $727,152 |
| Mississippi | 12,709 | $14,877 | 365 | $648,482 |
| Missouri | 16,072 | $18,727 | 1,219 | $851,287 |
| Montana | 3,477 | $19,925 | 498 | $372,440 |
| Nebraska | 4,707 | $17,992 | 513 | $774,082 |
| Nevada | 11,530 | $20,208 | 831 | $663,047 |
| New Hampshire | 3,137 | $26,273 | 401 | $546,244 |
| New Jersey | 24,205 | $22,582 | 2,062 | $1,148,638 |
| New Mexico | 4,666 | $18,273 | 328 | $628,631 |
| New York | 50,876 | $17,612 | 3,743 | $1,615,120 |
| North Carolina | 37,629 | $20,794 | 2,311 | $880,580 |
| North Dakota | 1,975 | $17,267 | 248 | $660,508 |
| Ohio | 30,247 | $19,405 | 2,001 | $1,062,473 |
| Oklahoma | 12,902 | $17,951 | 598 | $843,119 |
| Oregon | 8,758 | $22,139 | 1,253 | $566,804 |
| Pennsylvania | 27,383 | $20,096 | 2,528 | $1,137,051 |
| Rhode Island | 2,826 | $22,344 | 289 | $1,105,356 |
| South Carolina | 19,488 | $21,895 | 1,131 | $940,336 |
| South Dakota | 2,398 | $15,901 | 255 | $413,557 |
| Tennessee | 28,465 | $20,467 | 1,165 | $1,595,742 |
| Texas | 128,126 | $18,613 | 3,894 | $1,439,176 |
| Utah | 7,671 | $26,287 | 987 | $708,568 |
| Vermont | 2,281 | $21,880 | 208 | $895,673 |
| Virginia | 24,083 | $22,834 | 2,183 | $1,279,448 |
| Washington | 14,511 | $26,570 | 2,131 | $727,586 |
| West Virginia | 3,300 | $13,581 | 190 | $703,021 |
| Wisconsin | 10,235 | $21,508 | 1,258 | $761,480 |
| Wyoming | 1,850 | $16,463 | 239 | $404,498 |
Rounded to the nearest dollar. State means use each state’s own total receipts or revenue divided by its count—not an average of the national figure. Sources: 2023 nonemployer state data and 2022 employer state data. Full totals are included in the CSV.
Revenue is not owner income
Explore what share of cleaning revenue goes to payroll using 2022 Census employer data for all 50 states and DC. The observed payroll share excludes employer taxes and insurance premiums; it is not a profit margin or a recommended budget.
Use our cleaning employee costs and billable-hour calculator to separate wages, employer costs and billable time. It includes state wage benchmarks and adjustable assumptions for insurance, supplies and overhead.
Revenue measures money coming into the business before expenses. Owner income depends on costs, taxes, business structure and how the owner is paid. Neither Census table supplies a cleaning-company profit margin or owner take-home pay, so this study does not convert gross receipts into an earnings estimate.
For a planning example, suppose a cleaning operation bills $200 per visit for 10 visits a week over 48 working weeks. That produces $96,000 in annual gross sales before cancellations, unpaid invoices or added work. The $200 price, workload and working weeks are illustrative assumptions—not measured cleaning-market rates.
To turn that sales plan into a business budget, separately estimate paid labor, supplies, transport, insurance, equipment, administration and taxes. Also account for the owner’s working time. Two businesses with the same receipts can leave their owners with very different results.
For launch requirements, use our state cleaning-business guides. For coverage decisions, see cleaning business insurance.
Cleaning revenue is not Schedule C profit — see our companion study on: sole proprietorship net profit by state.
Related recovery context (not cleaning revenue): FEMA disaster dollars by state — OpenFEMA PA obligations and IA approved IHP by state, with an ex-Biological hazard view.
Download the data and check the methodology
Download the state data (CSV) · Download revenue brackets (CSV) · Download the chart (PNG)
Scope. Nonemployer figures use NAICS 56172; employer figures use NAICS 561720. Both are labeled Janitorial Services. The category includes building-interior and window cleaning; it is not a count of every business offering any kind of cleaning. Carpet and upholstery cleaning and other specialized cleaning categories are separate. We do not split the results into residential-only and commercial-only operations.
Sources and dates. We retrieved the 2023 Nonemployer Statistics and 2022 Economic Census tables on September 15, 2026. The study date is not the data year. The 2024 nonemployer API endpoint did not return an available dataset when checked; we use the verified 2023 edition and do not label its receipts as 2026 revenue.
Calculations. Census reports receipt and revenue totals in thousands of dollars. We multiply those totals by 1,000 before dividing by the business or establishment count. A bracket’s percentage is its business count divided by 1,095,927, multiplied by 100. We checked that the nine bracket counts and the 51 state/DC counts each sum to the national nonemployer count, and that state totals reconcile to their respective national totals. Small displayed differences can result from rounding.
Limits. The nonemployer universe excludes businesses below the applicable receipts threshold and is based primarily on tax records. It includes businesses that may not be the owner’s principal income source; it is not a sample restricted to full-time, year-round owner-operators. Census applies disclosure protection, including noise infusion to nonemployer receipts. We retain the available flags in the state CSV. Bracket receipt totals marked unavailable are left blank, rather than treating the API’s placeholder zero as actual revenue.
- Census 2023 Nonemployer Statistics: national total and receipts-size classes.
- Census 2023 Nonemployer Statistics: state totals.
- Census 2022 Economic Census: national employer revenue and state employer revenue.
- Census nonemployer definitions and geographic limitations.
- Census nonemployer methodology and disclosure protection.
- Census NAICS classification resources.
Cite this study
StartBusinessByState.com, “How Much Revenue Do Cleaning Businesses Generate?” September 15, 2026. Analysis of U.S. Census Bureau 2023 Nonemployer Statistics and 2022 Economic Census, Janitorial Services.
When citing a figure, include its data year and whether it covers businesses without employees or employer establishments. Link to this study so readers can inspect the definitions and calculations. For employment, payroll and industry-size context, see our cleaning industry statistics overview.
Common questions about cleaning-business revenue
How much does a cleaning business make per month?
Dividing the 2023 nonemployer annual mean by 12 gives about $1,732 a month. That is only a monthly equivalent of an annual mean. It is not observed monthly revenue, a seasonal pattern, a full-time income estimate or owner take-home pay.
Can a cleaning business generate six figures?
Yes. The 2023 nonemployer figures include 28,348 janitorial businesses with at least $100,000 in annual receipts, or 2.6% of the category. The data do not show their profits, hours worked or use of subcontractors. They are evidence that such receipts occur, not a prediction for a new business.
What is the median revenue of a cleaning business?
For businesses without paid employees, the published distribution places the median in the $10,000–$24,999 bracket in 2023. It does not reveal an exact median. This study does not establish a median for employer businesses.
Are these figures only for house-cleaning businesses?
No. Census’s Janitorial Services category includes multiple kinds of cleaning operations. The figures here cannot isolate residential house cleaning from office or other janitorial work. Use them as industry benchmarks, not as a residential-only price or revenue survey.
Revenue benchmarks are not a price list. To build a commercial bid from labor hours, burden and non-labor costs — and to see margin versus markup — use how to price a commercial cleaning contract.