Research published September 15, 2026 · Census data: 2018–2023 · Latest-year check: 2022–2023
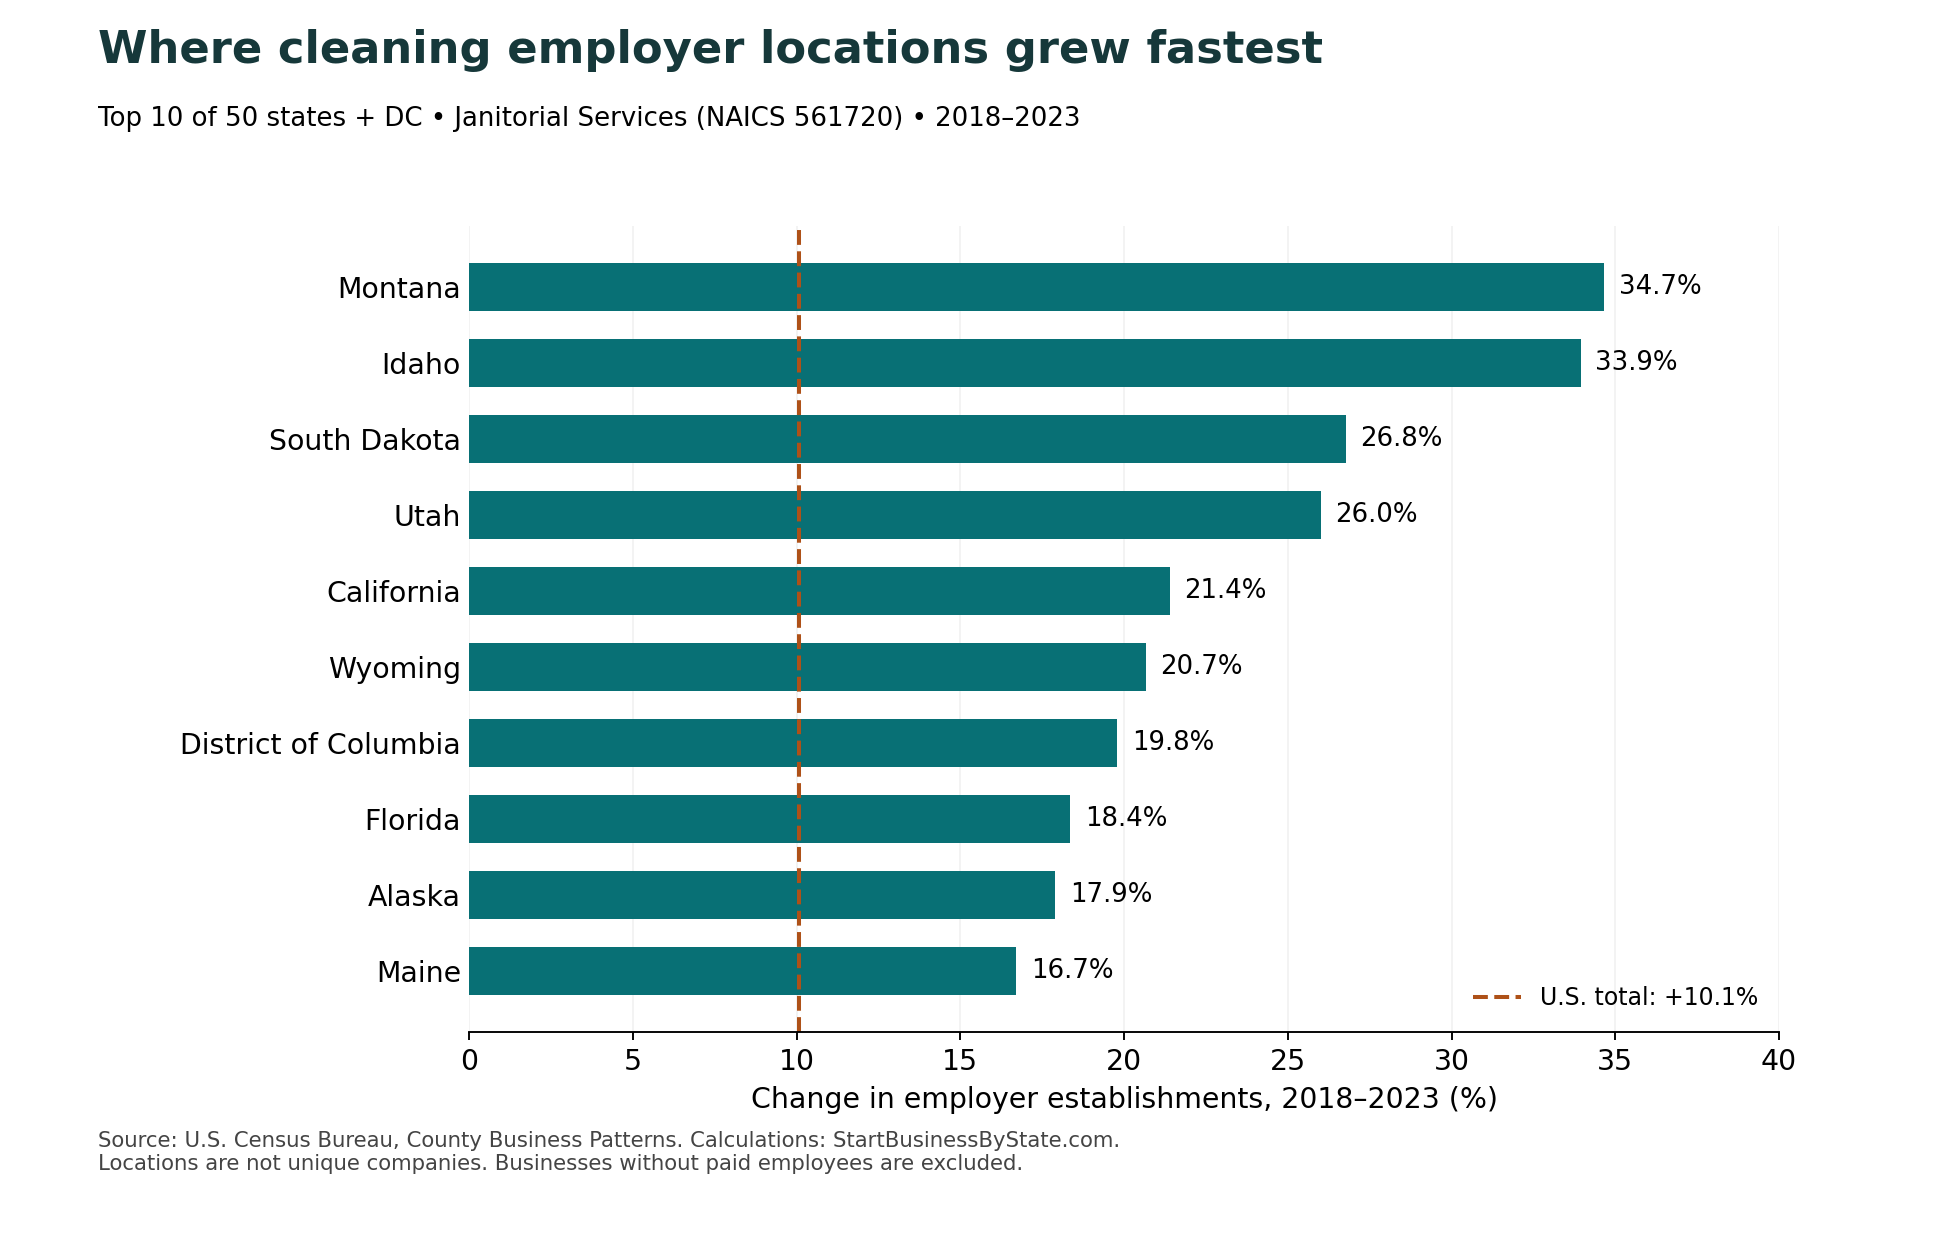
Montana and Idaho had the fastest percentage growth in cleaning employer locations from 2018 to 2023: 34.7% and 33.9%. California added the most locations (+1,226), followed by Florida (+1,035). These are historical Census Janitorial Services figures for businesses with paid employees—not a ranking of current demand, profitability or every self-employed cleaner.
We compared all 50 states and Washington, DC using the same industry definition and Census series. The answer changes depending on whether “growth” means more locations, more jobs or a larger payroll. This study shows each measure separately, including states that lost locations and what changed in the final year.
61,591 → 67,799 · 2018–2023
1,080,453 → 1,088,193 · 2018–2023
$23.512B → $32.743B · nominal dollars
Source: 2018 County Business Patterns, 2022 CBP and 2023 CBP, NAICS 561720. Calculations by StartBusinessByState.com. The 2024 CBP API dataset was not available when checked for this edition.
Which states grew fastest in cleaning employer locations?
Montana grew from 378 to 509 locations, a net gain of 131. Idaho rose from 492 to 659, adding 167. South Dakota (+26.8%) and Utah (+26.0%) followed. California ranked fifth by percentage growth (+21.4%), even though its starting market was much larger.
The baseline matters. A gain of 131 locations can produce a bigger percentage change in Montana than a gain of 1,226 does in California. We therefore show the starting count, ending count and net addition together. None of these figures counts gross business openings: openings, closures, relocations and classification changes can all contribute to the difference between two annual totals.
Where were the most cleaning employer locations added?
California and Florida together accounted for 36.4% of the national net increase. Their combined gain was 2,261 out of 6,208 additional U.S. locations. Texas, Washington and Georgia round out the five largest absolute gains. This is a share of net additions, not a share of new company launches or cleaning contracts.
| State | Locations 2018 | Locations 2023 | Net change | Change |
|---|---|---|---|---|
| California | 5,730 | 6,956 | +1,226 | +21.4% |
| Florida | 5,640 | 6,675 | +1,035 | +18.4% |
| Texas | 3,471 | 3,858 | +387 | +11.1% |
| Washington | 1,879 | 2,166 | +287 | +15.3% |
| Georgia | 1,779 | 2,013 | +234 | +13.2% |
Large absolute gains can coexist with a modest growth rate because a state already has many businesses. Percentage growth answers “how quickly did the count expand relative to its starting size?” Absolute growth answers “how many more employer locations were counted?” Neither establishes the number of customers available to a new entrant.
Cleaning-business growth by state: full comparison
Rank is based on the unrounded percentage change in employer establishments from 2018 to 2023. All 51 jurisdictions remain visible without using the controls. Sort by net additions or latest-year growth to explore a different question; each state name opens its cleaning-business startup guide.
Showing all 51 jurisdictions.
| State / DC | Five-year rank | 2018 locations | 2023 locations | Net change | 2018–2023 change | 2022–2023 change |
|---|---|---|---|---|---|---|
| Montana | 1 | 378 | 509 | +131 | +34.7% | +5.2% |
| Idaho | 2 | 492 | 659 | +167 | +33.9% | +3.8% |
| South Dakota | 3 | 213 | 270 | +57 | +26.8% | +5.1% |
| Utah | 4 | 819 | 1,032 | +213 | +26.0% | +4.8% |
| California | 5 | 5,730 | 6,956 | +1,226 | +21.4% | +3.4% |
| Wyoming | 6 | 213 | 257 | +44 | +20.7% | +11.3% |
| District of Columbia | 7 | 96 | 115 | +19 | +19.8% | -4.2% |
| Florida | 8 | 5,640 | 6,675 | +1,035 | +18.4% | +1.9% |
| Alaska | 9 | 218 | 257 | +39 | +17.9% | +2.8% |
| Maine | 10 | 365 | 426 | +61 | +16.7% | +6.5% |
| Washington | 11 | 1,879 | 2,166 | +287 | +15.3% | +4.1% |
| Alabama | 12 | 630 | 726 | +96 | +15.2% | -1.0% |
| Nevada | 13 | 699 | 803 | +104 | +14.9% | +0.0% |
| Massachusetts | 14 | 1,538 | 1,757 | +219 | +14.2% | +2.0% |
| North Dakota | 15 | 219 | 250 | +31 | +14.2% | +0.4% |
| West Virginia | 16 | 170 | 194 | +24 | +14.1% | +3.2% |
| Vermont | 17 | 188 | 214 | +26 | +13.8% | +2.9% |
| Arizona | 18 | 1,159 | 1,312 | +153 | +13.2% | +4.6% |
| Georgia | 19 | 1,779 | 2,013 | +234 | +13.2% | -5.2% |
| Delaware | 20 | 250 | 279 | +29 | +11.6% | -0.7% |
| Texas | 21 | 3,471 | 3,858 | +387 | +11.1% | -0.6% |
| Mississippi | 22 | 344 | 382 | +38 | +11.0% | +6.7% |
| Michigan | 23 | 1,546 | 1,712 | +166 | +10.7% | +0.9% |
| Hawaii | 24 | 330 | 365 | +35 | +10.6% | +0.8% |
| New Jersey | 25 | 1,870 | 2,068 | +198 | +10.6% | +1.4% |
| Oregon | 26 | 1,142 | 1,248 | +106 | +9.3% | +0.2% |
| Wisconsin | 27 | 1,163 | 1,267 | +104 | +8.9% | +1.4% |
| Minnesota | 28 | 1,277 | 1,391 | +114 | +8.9% | +1.2% |
| North Carolina | 29 | 2,100 | 2,277 | +177 | +8.4% | +0.6% |
| Arkansas | 30 | 436 | 471 | +35 | +8.0% | +1.1% |
| Nebraska | 31 | 481 | 519 | +38 | +7.9% | +1.8% |
| Indiana | 32 | 1,132 | 1,217 | +85 | +7.5% | -1.8% |
| Oklahoma | 33 | 564 | 606 | +42 | +7.4% | +0.8% |
| Rhode Island | 34 | 268 | 286 | +18 | +6.7% | +0.4% |
| Tennessee | 35 | 1,109 | 1,182 | +73 | +6.6% | +1.7% |
| Missouri | 36 | 1,131 | 1,194 | +63 | +5.6% | -1.4% |
| Kentucky | 37 | 625 | 659 | +34 | +5.4% | +2.5% |
| Louisiana | 38 | 623 | 655 | +32 | +5.1% | -0.5% |
| New York | 39 | 3,585 | 3,762 | +177 | +4.9% | +1.1% |
| Colorado | 40 | 1,509 | 1,571 | +62 | +4.1% | -1.5% |
| Ohio | 41 | 1,884 | 1,960 | +76 | +4.0% | -0.8% |
| South Carolina | 42 | 1,054 | 1,094 | +40 | +3.8% | -0.9% |
| New Hampshire | 43 | 362 | 373 | +11 | +3.0% | -7.7% |
| Kansas | 44 | 624 | 642 | +18 | +2.9% | -3.0% |
| Iowa | 45 | 629 | 647 | +18 | +2.9% | +0.6% |
| Pennsylvania | 46 | 2,425 | 2,456 | +31 | +1.3% | -1.1% |
| Maryland | 47 | 1,454 | 1,436 | -18 | -1.2% | -1.0% |
| Illinois | 48 | 2,554 | 2,520 | -34 | -1.3% | -1.4% |
| Connecticut | 49 | 676 | 663 | -13 | -1.9% | -2.2% |
| New Mexico | 50 | 322 | 312 | -10 | -3.1% | -3.1% |
| Virginia | 51 | 2,226 | 2,136 | -90 | -4.0% | -1.7% |
The rank stays tied to the five-year metric even when you sort by a different column. Percentages are rounded to one decimal; the CSV includes all three years’ counts, calculation precision and source flags.
Did the same states lead in the latest available year?
No. From 2022 to 2023, the five largest percentage increases were Wyoming +11.3%; Mississippi +6.7%; Maine +6.5%; Montana +5.2%; South Dakota +5.1%. Nationally, locations increased from 67,295 to 67,799, or just 0.7%. A five-year lead does not mean a state led in the final year or is growing at the same pace today.
More cleaning locations did not always mean more jobs
U.S. janitorial employment increased by only 7,740 between the two March employment snapshots, from 1,080,453 in 2018 to 1,088,193 in 2023. That is a 0.7% rise alongside 10.1% more locations. Dividing the published totals gives about 17.5 employees per location in 2018 and 16.1 in 2023. These are aggregate ratios, not the size of the typical cleaning company.
California’s employment fell 2.5%, and Florida’s fell 4.4%, while both added locations. Montana and Idaho show a different pattern: employment increased 58.1% and 22.9%, respectively. The data do not identify the causes. Changes in operating scale, company structure, reporting or the mix of establishments could affect these comparisons; this table cannot establish a particular explanation.
National annual payroll rose 39.3%, from $23.512 billion to $32.743 billion. That is nominal payroll growth, without an inflation adjustment. It is not revenue, profit, a change in hourly wages or an increase in every worker’s pay. Annual payroll and a March employment snapshot also cover different time spans.
View employment and annual payroll for all 50 states and DC
| State / DC | 2018 employees | 2023 employees | Employment change | 2018 payroll | 2023 payroll | Payroll change |
|---|---|---|---|---|---|---|
| Alabama | 12,934 | 11,791 | -8.8% | $229.0M | $278.3M | +21.5% |
| Alaska | 4,319 | 4,797 | +11.1% | $141.2M | $207.9M | +47.3% |
| Arizona | 21,230 | 20,941 | -1.4% | $429.7M | $634.2M | +47.6% |
| Arkansas | 7,634 | 13,290 | +74.1% | $132.6M | $290.2M | +118.9% |
| California | 119,258 | 116,330 | -2.5% | $3,042.0M | $4,202.6M | +38.2% |
| Colorado | 22,232 | 22,606 | +1.7% | $469.5M | $684.3M | +45.7% |
| Connecticut | 16,401 | 16,179 | -1.4% | $358.1M | $422.1M | +17.9% |
| Delaware | 3,535 | 3,437 | -2.8% | $64.5M | $87.0M | +34.9% |
| District of Columbia | 3,550 | 5,139 | +44.8% | $91.1M | $154.2M | +69.3% |
| Florida | 68,982 | 65,978 | -4.4% | $1,201.5M | $1,760.3M | +46.5% |
| Georgia | 38,913 | 44,458 | +14.2% | $784.9M | $1,294.1M | +64.9% |
| Hawaii | 6,397 | 5,445 | -14.9% | $146.4M | $143.1M | -2.3% |
| Idaho | 4,528 | 5,563 | +22.9% | $75.9M | $139.3M | +83.7% |
| Illinois | 57,188 | 50,936 | -10.9% | $1,255.6M | $1,648.0M | +31.3% |
| Indiana | 17,862 | 17,830 | -0.2% | $349.7M | $467.5M | +33.7% |
| Iowa | 10,246 | 10,296 | +0.5% | $216.2M | $272.1M | +25.9% |
| Kansas | 9,426 | 8,767 | -7.0% | $188.7M | $227.0M | +20.3% |
| Kentucky | 11,840 | 11,327 | -4.3% | $226.5M | $289.5M | +27.8% |
| Louisiana | 11,829 | 11,074 | -6.4% | $229.8M | $258.8M | +12.6% |
| Maine | 3,453 | 3,839 | +11.2% | $67.2M | $104.1M | +54.8% |
| Maryland | 32,994 | 31,862 | -3.4% | $745.3M | $939.2M | +26.0% |
| Massachusetts | 26,736 | 25,295 | -5.4% | $744.7M | $820.4M | +10.2% |
| Michigan | 30,485 | 29,797 | -2.3% | $657.2M | $869.2M | +32.3% |
| Minnesota | 18,044 | 16,329 | -9.5% | $400.4M | $501.6M | +25.3% |
| Mississippi | 5,884 | 5,647 | -4.0% | $82.5M | $118.5M | +43.6% |
| Missouri | 24,938 | 23,120 | -7.3% | $454.9M | $589.7M | +29.6% |
| Montana | 2,359 | 3,729 | +58.1% | $37.9M | $98.9M | +160.6% |
| Nebraska | 6,864 | 6,230 | -9.2% | $139.0M | $169.6M | +22.1% |
| Nevada | 9,878 | 9,842 | -0.4% | $202.7M | $274.1M | +35.3% |
| New Hampshire | 3,236 | 2,928 | -9.5% | $69.4M | $86.3M | +24.3% |
| New Jersey | 38,432 | 34,413 | -10.5% | $890.7M | $1,043.3M | +17.1% |
| New Mexico | 3,864 | 3,875 | +0.3% | $63.6M | $91.3M | +43.4% |
| New York | 69,223 | 76,457 | +10.5% | $2,130.7M | $3,014.4M | +41.5% |
| North Carolina | 32,593 | 31,655 | -2.9% | $643.3M | $834.3M | +29.7% |
| North Dakota | 1,990 | 2,777 | +39.5% | $42.8M | $79.2M | +85.2% |
| Ohio | 35,208 | 35,142 | -0.2% | $704.5M | $917.3M | +30.2% |
| Oklahoma | 7,109 | 8,042 | +13.1% | $149.6M | $223.6M | +49.5% |
| Oregon | 11,139 | 10,897 | -2.2% | $249.2M | $332.9M | +33.6% |
| Pennsylvania | 40,517 | 41,054 | +1.3% | $840.6M | $1,181.6M | +40.6% |
| Rhode Island | 3,210 | 3,845 | +19.8% | $72.1M | $118.4M | +64.1% |
| South Carolina | 19,637 | 20,026 | +2.0% | $367.2M | $487.2M | +32.7% |
| South Dakota | 1,987 | 2,556 | +28.6% | $34.4M | $53.6M | +55.8% |
| Tennessee | 33,251 | 35,239 | +6.0% | $591.7M | $1,067.2M | +80.3% |
| Texas | 79,298 | 82,256 | +3.7% | $1,625.1M | $2,522.2M | +55.2% |
| Utah | 8,998 | 10,912 | +21.3% | $197.0M | $333.8M | +69.5% |
| Vermont | 1,518 | 3,014 | +98.6% | $29.8M | $75.5M | +153.4% |
| Virginia | 37,254 | 38,660 | +3.8% | $746.7M | $1,048.3M | +40.4% |
| Washington | 18,588 | 18,746 | +0.9% | $470.4M | $680.6M | +44.7% |
| West Virginia | 2,633 | 2,892 | +9.8% | $54.4M | $66.1M | +21.5% |
| Wisconsin | 19,598 | 19,387 | -1.1% | $344.4M | $496.5M | +44.2% |
| Wyoming | 1,231 | 1,546 | +25.6% | $29.6M | $43.3M | +46.5% |
Employment and payroll are published with disclosure-protection noise. Source flags are retained in the download; small changes should not be read as precise shifts in underlying activity. Establishment and employee counts are different units.
Five states had fewer cleaning employer locations
Virginia, New Mexico, Connecticut, Illinois and Maryland had lower employer-location counts in 2023 than in 2018. Virginia had the largest percentage decline, 4.0%, and the largest net loss among these states, 90 locations. A lower count alone does not prove that customer demand shrank or that competition became easier.
| State | Locations 2018 | Locations 2023 | Net change | Change |
|---|---|---|---|---|
| Virginia | 2,226 | 2,136 | -90 | -4.0% |
| New Mexico | 322 | 312 | -10 | -3.1% |
| Connecticut | 676 | 663 | -13 | -1.9% |
| Illinois | 2,554 | 2,520 | -34 | -1.3% |
| Maryland | 1,454 | 1,436 | -18 | -1.2% |
How to use the findings when planning a cleaning business
Use these figures to choose questions for local research. A state gaining employer locations may offer an expanding business base, but it may also have more competitors. Check the actual service area, customer types, travel time, hiring pool and prices clients will pay before drawing a conclusion about opportunity. This historical comparison does not rank the best states to launch or forecast your sales.
For the practical steps in your location, use our state cleaning-business guides. Compare cleaning-business revenue benchmarks separately: CBP does not measure sales. Our cleaning industry statistics provide broader background, and the cleaning-company size comparison explains how small-employer counts differ from revenue shares.
If your plan involves adding staff, equipment or larger client contracts, review cleaning business insurance coverage and quote options alongside the relevant state guide. Location growth does not determine an insurance requirement or premium; the work you perform, payroll, vehicles and client requirements are more useful inputs when discussing coverage.
Download the data and reproduce the comparison
Download all state figures and source flags (CSV) · Download the fastest-growth chart (PNG)
Scope and years. We extracted 2018, 2022 and 2023 County Business Patterns records for Janitorial Services, NAICS 2017 code 561720, with all legal forms of organization (LFO 001) and all establishment employment sizes (EMPSZES 001). All three releases use the same NAICS vintage. The five-year comparison uses 2018 and 2023; 2022 supplies the separate final-year comparison. This is a historical edition, not 2026 activity data.
What is counted. An establishment is a business location, not necessarily an independent company. A company with several locations can appear more than once. CBP excludes businesses without paid employees; the very large nonemployer cleaning sector is therefore outside this ranking. Employment refers to the pay period including March 12. Payroll covers the calendar year and the API reports it in thousands of dollars; we multiply those values by 1,000.
Industry boundaries. The Census 2017 industry definition includes building-interior, transportation-interior and window cleaning, including maid and custodial services. It does not isolate residential cleaning from commercial cleaning. Separate industries such as carpet and upholstery cleaning, remediation, and other building-exterior cleaning are not added to this category.
Calculations. Net change = 2023 count − 2018 count. Five-year percentage change = (2023 count − 2018 count) ÷ 2018 count × 100. The latest-year rate substitutes 2022 for the baseline. These are total changes over their respective periods, not annual growth rates. The optional compound annual growth rate in the CSV is [(2023 locations ÷ 2018 locations)1/5 − 1] × 100. No composite score or weighting is used.
Coverage checks. We retain all 50 states and DC, excluding Puerto Rico and other territories from this U.S. comparison. The 51 establishment counts sum to the published U.S. total in each year. The primary counts and employment/payroll values used here have no suppression flags. The download retains EMP_F, PAYANN_F and the separate EMP_N_F/PAYANN_N_F noise flags; a numeric noise placeholder is not interpreted as an absence of noise.
Limits. These repeated annual totals do not track the same firms, measure business births or closures, or establish what caused a change. The period spans the pandemic. Nominal payroll includes price and pay changes, and employment is a snapshot. Census notes possible comparability issues from classification, coverage and reporting changes. Its methodology page also carries a notice that its noise-infusion guidance is being reevaluated; this study preserves the flags supplied with these historical releases.
Primary sources: 2018 CBP table; 2022 CBP table; 2023 CBP table; CBP definitions; Census API documentation. Extracted September 15, 2026.
Cite this study: StartBusinessByState.com, “Where Are Cleaning Businesses Growing Fastest?” September 15, 2026. Analysis of U.S. Census Bureau County Business Patterns, 2018–2023. When quoting a result, retain the years and the phrase “employer locations,” and link to this page so readers can inspect the figures and download the source-derived table.
Common questions
Which state has the fastest-growing cleaning industry?
By percentage growth in janitorial employer locations from 2018 to 2023, Montana leads at 34.7%. That answer is specific to the period, industry and measure. It is not a current-year growth estimate or a revenue ranking.
Does this count self-employed house cleaners?
No. County Business Patterns covers employer establishments. Businesses without paid employees need a separate Nonemployer Statistics analysis and should not be inserted into this employer-location ranking.
Does a growing location count mean there is more demand?
It shows that more employer locations were counted. It does not directly measure customer demand, contracts, sales or profit. Compare it with local customer research and operating costs before using it to make a launch decision.