U.S. service-business research · 2022 Census data · Published September 15, 2026
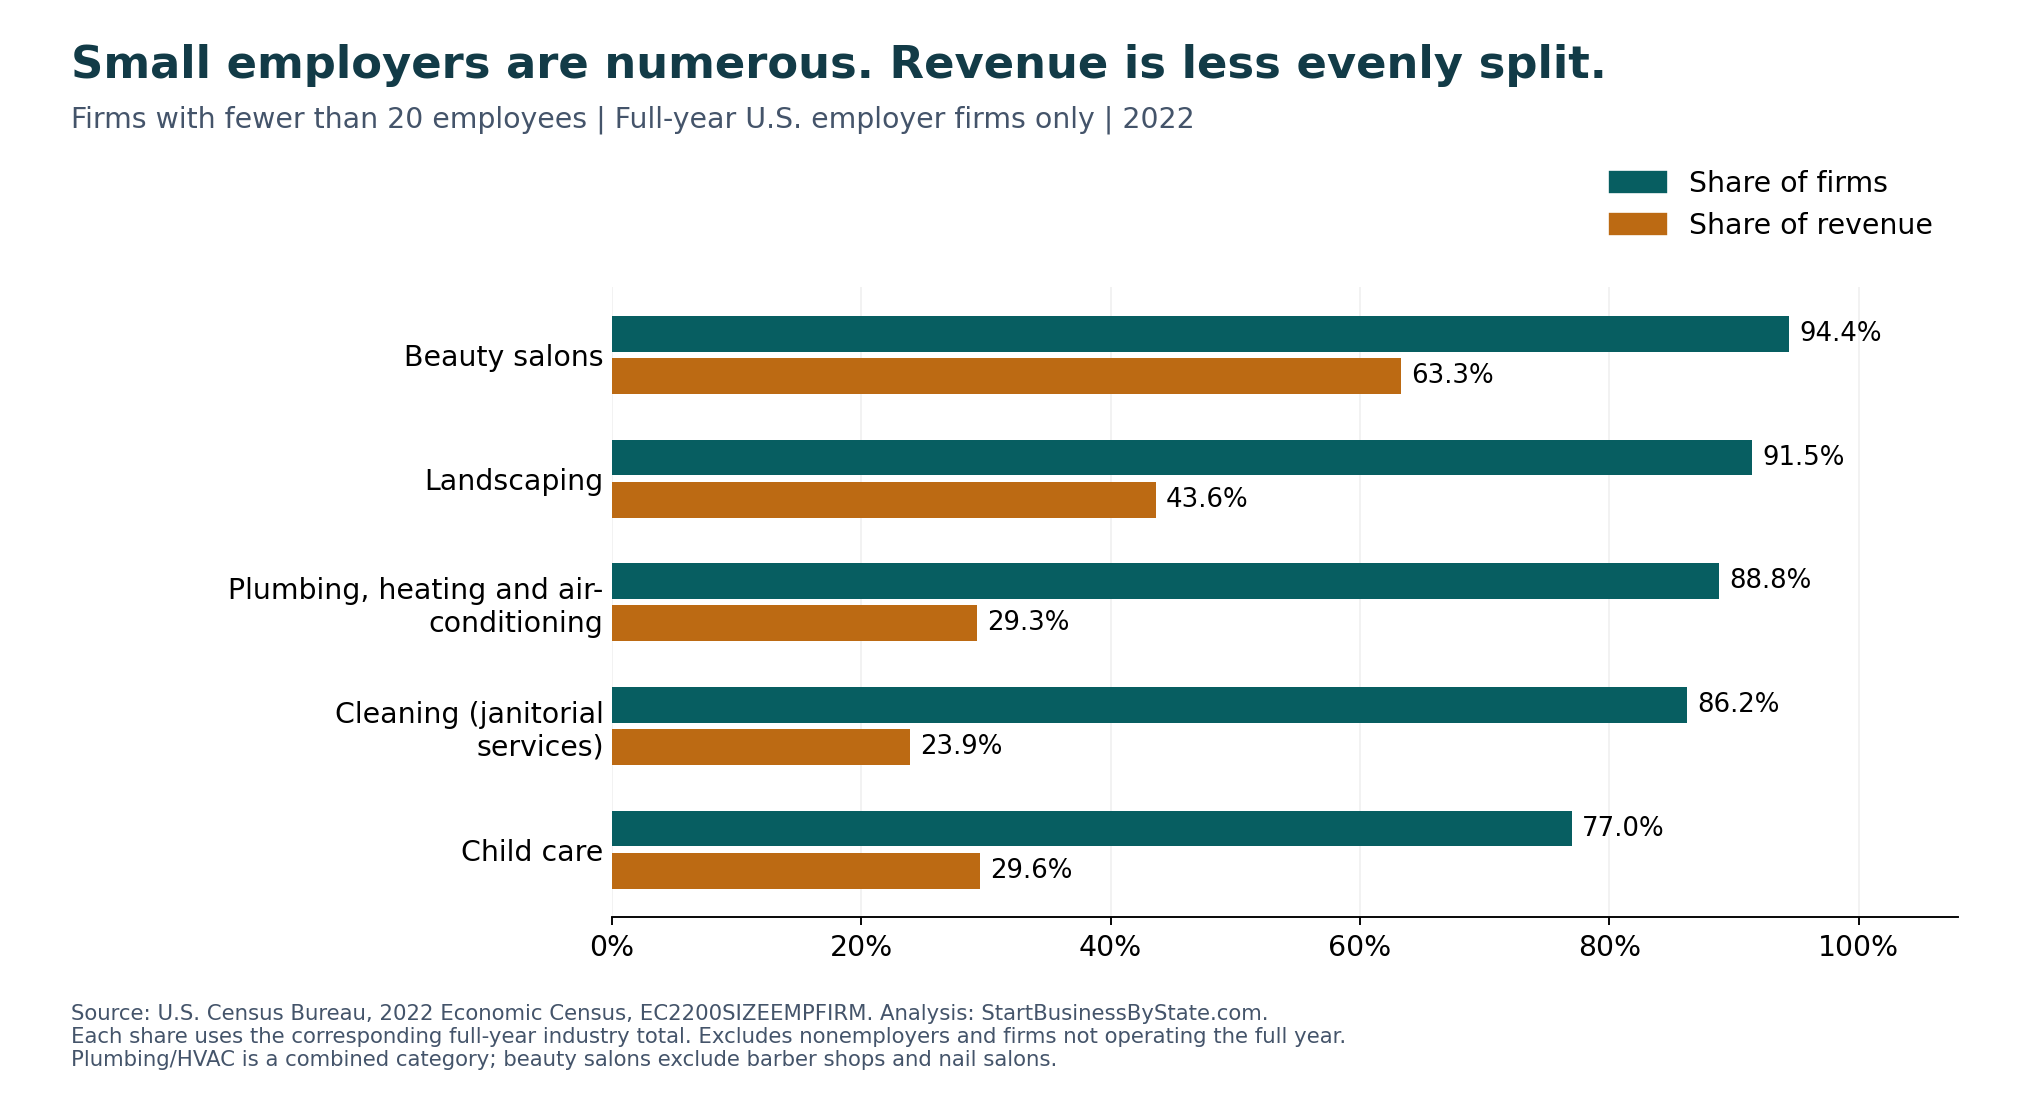
Most full-year employer firms in these five service industries have fewer than 20 employees. Their shares range from 77.0% in child care to 94.4% in beauty salons. Landscaping is 91.5%, plumbing/HVAC 88.8%, and janitorial cleaning 86.2%.
But firm counts and revenue tell different stories: cleaning firms with fewer than 20 employees represent 86.2% of full-year firms and 23.9% of their revenue. This is our analysis of the 2022 Economic Census, not a survey of 2026 conditions.
Who is included? Employer firms that operated for the entire year, using Census’s published firm-size brackets. Businesses without paid employees and firms not operating the full year are outside these bracket percentages. A firm can own more than one location.
Small employers make up most service-business firms
We compared janitorial cleaning, landscaping, child care, beauty salons, and the combined plumbing/heating/air-conditioning category. “Fewer than 20 employees” is a consistent comparison threshold here, not an eligibility test for a loan, benefit or government program.
| Industry | Full-year firms | Fewer than 5: firm share | Fewer than 20: firm share | Fewer than 20: revenue share |
|---|---|---|---|---|
| Beauty salons | 57,317 | 65.4% | 94.4% | 63.3% |
| Landscaping | 80,535 | 60.9% | 91.5% | 43.6% |
| Plumbing, heating and air-conditioning | 91,144 | 54.5% | 88.8% | 29.3% |
| Cleaning (janitorial services) | 48,377 | 53.2% | 86.2% | 23.9% |
| Child care | 53,316 | 31.1% | 77.0% | 29.6% |
Small employers are especially prevalent by count in beauty salons and landscaping. Child care has the lowest under-20 share among these five categories, but even there it exceeds three-quarters. These are national comparisons, not evidence that a particular city has too many or too few providers.
Larger firms can have an outsized share of revenue
In janitorial cleaning, just 207 firms in the 500-or-more employee bracket account for 42.7% of full-year employer revenue. They represent about 0.43% of full-year firms. Small firms dominate the count, but that does not mean revenue is distributed in the same proportions.
| Industry | Firms with 500+ employees | Share of firms | Share of revenue |
|---|---|---|---|
| Beauty salons | Withheld | Withheld | Withheld |
| Landscaping | 46 | 0.06% | 15.4% |
| Plumbing, heating and air-conditioning | 136 | 0.15% | 20.5% |
| Cleaning (janitorial services) | 207 | 0.43% | 42.7% |
| Child care | 68 | 0.13% | 15.2% |
“Withheld” means Census suppresses the value, not that the category has no firms or revenue. Beauty-salon figures in the 250–499 and 500+ brackets are suppressed. We do not convert the API’s placeholder zeros into findings or estimate those individual cells.
A 500+ employee bracket is not the same as the four largest companies, a franchise category, or a measure of local market power. This table does not identify brands, measure franchising, or show which firms compete for the same customers. Revenue share also does not measure profitability.
See every employee-size bracket
Open an industry to see the eight published brackets, from fewer than five employees through 500 or more. Percentages use the full-year firm or revenue total as appropriate. The downloads include exact dollar totals and source flags.
Beauty salons: all eight employee brackets
NAICS 812112. Full-year employer firms only. View the Census source table.
| Employees | Firms | Firm share | Revenue | Revenue share |
|---|---|---|---|---|
| Fewer than 5 | 37,503 | 65.4% | $5.924B | 24.5% |
| 5–9 | 10,708 | 18.7% | $4.600B | 19.0% |
| 10–19 | 5,907 | 10.3% | $4.803B | 19.8% |
| 20–49 | 2,586 | 4.5% | $4.348B | 18.0% |
| 50–99 | 426 | 0.7% | $1.703B | 7.0% |
| 100–249 | 146 | 0.3% | $1.359B | 5.6% |
| 250–499 | Withheld | Withheld | Withheld | Withheld |
| 500+ | Withheld | Withheld | Withheld | Withheld |
Landscaping: all eight employee brackets
NAICS 561730. Full-year employer firms only. View the Census source table.
| Employees | Firms | Firm share | Revenue | Revenue share |
|---|---|---|---|---|
| Fewer than 5 | 49,049 | 60.9% | $17.212B | 15.9% |
| 5–9 | 15,883 | 19.7% | $14.278B | 13.2% |
| 10–19 | 8,743 | 10.9% | $15.750B | 14.5% |
| 20–49 | 5,084 | 6.3% | $20.150B | 18.6% |
| 50–99 | 1,136 | 1.4% | $9.894B | 9.1% |
| 100–249 | 478 | 0.6% | $9.398B | 8.7% |
| 250–499 | 116 | 0.1% | $4.909B | 4.5% |
| 500+ | 46 | 0.1% | $16.708B | 15.4% |
Plumbing, heating and air-conditioning: all eight employee brackets
NAICS 238220. Full-year employer firms only. View the Census source table.
| Employees | Firms | Firm share | Revenue | Revenue share |
|---|---|---|---|---|
| Fewer than 5 | 49,682 | 54.5% | $21.103B | 7.3% |
| 5–9 | 19,041 | 20.9% | $27.051B | 9.4% |
| 10–19 | 12,241 | 13.4% | $36.496B | 12.6% |
| 20–49 | 7,037 | 7.7% | $52.414B | 18.1% |
| 50–99 | 1,924 | 2.1% | $36.358B | 12.6% |
| 100–249 | 882 | 1.0% | $36.595B | 12.7% |
| 250–499 | 201 | 0.2% | $19.655B | 6.8% |
| 500+ | 136 | 0.1% | $59.170B | 20.5% |
Cleaning (janitorial services): all eight employee brackets
NAICS 561720. Full-year employer firms only. View the Census source table.
| Employees | Firms | Firm share | Revenue | Revenue share |
|---|---|---|---|---|
| Fewer than 5 | 25,730 | 53.2% | $5.240B | 7.4% |
| 5–9 | 9,436 | 19.5% | $5.145B | 7.3% |
| 10–19 | 6,552 | 13.5% | $6.429B | 9.1% |
| 20–49 | 4,273 | 8.8% | $8.221B | 11.7% |
| 50–99 | 1,226 | 2.5% | $5.175B | 7.4% |
| 100–249 | 735 | 1.5% | $6.238B | 8.9% |
| 250–499 | 218 | 0.5% | $3.867B | 5.5% |
| 500+ | 207 | 0.4% | $30.021B | 42.7% |
Child care: all eight employee brackets
NAICS 624410. Full-year employer firms only. View the Census source table.
| Employees | Firms | Firm share | Revenue | Revenue share |
|---|---|---|---|---|
| Fewer than 5 | 16,573 | 31.1% | $2.657B | 4.7% |
| 5–9 | 11,204 | 21.0% | $4.351B | 7.6% |
| 10–19 | 13,295 | 24.9% | $9.824B | 17.2% |
| 20–49 | 9,881 | 18.5% | $15.901B | 27.9% |
| 50–99 | 1,482 | 2.8% | $5.693B | 10.0% |
| 100–249 | 664 | 1.2% | $6.373B | 11.2% |
| 250–499 | 149 | 0.3% | $3.497B | 6.1% |
| 500+ | 68 | 0.1% | $8.654B | 15.2% |
Use the data to plan staffing and coverage
The distribution shows how businesses are organized, not how many people your business should hire. Before adding payroll, estimate the work available, the hours needed to deliver it, administration time and the costs of staffing. Do not turn a national size bracket into a local revenue forecast.
For coverage planning, describe your actual work, employee roles, payroll, equipment and vehicles when comparing insurance. Our dedicated industry insurance pages provide a more relevant next step than the national size percentages. Use the startup guides for state-specific requirements and the statistics pages for broader industry context:
- Beauty salons: state startup guides and industry statistics.
- Landscaping: state startup guides and industry statistics. landscaping business insurance.
- Plumbing, heating and air-conditioning: state startup guides and industry statistics. HVAC insurance.
- Cleaning (janitorial services): state startup guides and industry statistics. cleaning business insurance.
- Child care: state startup guides and industry statistics. daycare insurance.
The HVAC guide covers HVAC planning; the Census category here also includes plumbing. The beauty-salon figures exclude barber shops and nail salons. Child-care data are not a registry of licensed centers, home-based providers or available seats.
If you plan to operate without paid employees, start with our comparison of service businesses without employees. It examines a different population. For geography, our state and industry business comparison provides a separate screening framework; neither study predicts your chance of success.
Download the data and check the methodology
Download the five-industry summary (CSV) · Download all 40 employee-size rows (CSV) · Download the chart (PNG)
Source, date and units
Source: U.S. Census Bureau, 2022 Economic Census, table EC2200SIZEEMPFIRM, “Employment Size of Firms for the U.S.” We retrieved the data on September 15, 2026. The table’s reference year is 2022; the size-statistics release was announced in April 2025. We use the published 2022 NAICS categories and retain the source labels, counts and flags.
Employer firms are different from establishments: a single firm may operate multiple locations under common ownership or control. These are Census firm-size categories, not staff counts per shop. Nonemployers are excluded from this table. Do not interpret “fewer than 5” as “1–4 only” or as a count of owner-only businesses.
Why the denominator is full-year firms
Census separately publishes all firms, firms operating the full year, firms not operating the full year, and the eight full-year size brackets. We divide each bracket by the full-year total, never by all firms. The table below makes the excluded population visible. “Not full year” is a timing classification, not proof that a business failed.
| Industry | All employer firms | Full-year firms | Not full year |
|---|---|---|---|
| Beauty salons | 73,148 | 57,317 | 15,831 |
| Landscaping | 114,570 | 80,535 | 34,035 |
| Plumbing, heating and air-conditioning | 112,088 | 91,144 | 20,944 |
| Cleaning (janitorial services) | 63,999 | 48,377 | 15,622 |
| Child care | 63,487 | 53,316 | 10,171 |
Calculations and checks
We add the fewer-than-5, 5–9 and 10–19 rows to calculate the under-20 count and revenue. A firm share equals bracket firms ÷ full-year firms × 100. A revenue share equals bracket revenue ÷ full-year revenue × 100. Census reports revenue in thousands of dollars; we multiply by 1,000 before exporting dollars. Displayed percentages are rounded; calculations use the unrounded values.
We checked that full-year and not-full-year totals reconcile to all-firm counts, employment and revenue in every industry. Where all bracket values are published, the eight rows also reconcile to the full-year totals. Beauty-salon suppression prevents a complete row-by-row reconciliation; we leave those cells blank in the CSV and label them withheld on the page. We do not reverse-engineer the individual suppressed values.
Scope and limits
These five industries were selected for relevance to the site’s service-business guides, not by searching for extreme results. The comparisons are national and historical, not a complete ranking of the service economy. The published table’s coverage and tax-status treatment apply; these are not uniform samples of for-profit owner-operated businesses. Census applies disclosure protection and estimation procedures. Firm counts across industries should not be added into a count of unique companies.
This analysis does not establish revenue per employee, profits, owner salaries, staffing ratios, franchise prevalence, startup survival, or local demand. The size distribution of existing full-year employers is not a hiring prescription for a new entrant.
- Census employment-size-of-firms table and API field definitions.
- Census size-statistics release announcement.
- 2022 Economic Census methodology.
- Census glossary: firms, establishments and employment-size fields.
Cite this study
StartBusinessByState.com, “How Big Are Service Businesses?” Published September 15, 2026. Analysis of U.S. Census Bureau 2022 Economic Census employment-size-of-firms data.
Include the industry, 2022 reference year and full-year employer scope when citing a percentage. Specify whether it describes firms or revenue, and link here so readers can inspect the source table and calculations.
Common questions
Are most cleaning companies small?
Among janitorial employer firms operating the full year in 2022, 86.2% had fewer than 20 employees. That does not include businesses without payroll or employer firms operating only part of the year.
Does a small-business majority mean small firms earn most revenue?
No. In this comparison, cleaning firms below 20 employees make up 86.2% of full-year firms but 23.9% of full-year revenue. Beauty salons have a different pattern: 94.4% of firms and 63.3% of revenue.
Are the HVAC figures only for HVAC companies?
No. NAICS 238220 combines plumbing, heating and air-conditioning contractors. The table does not isolate HVAC-only firms.
Why are some salon values missing?
Census withholds the 250–499 and 500+ employee-bracket firm counts and revenue to protect confidentiality. Missing figures are not evidence of zero large salon firms.
Related state×industry pay research
For private QCEW average annual pay and employees per establishment by state (2024) across the same service niches, see employer pay and typical location size by state. That map is state×industry location staffing and payroll — not national firm-size brackets.
For how often employer establishments open, close, expand, and contract by state and broad service sector (BLS BED), see service business openings, closings, and churn.