Original research · BLS Quarterly Census of Employment and Wages (QCEW) · Establishment size class · Vintage 2026 Q1 (first quarter; March employment) · Private ownership · Total private industry · Published September 22, 2026
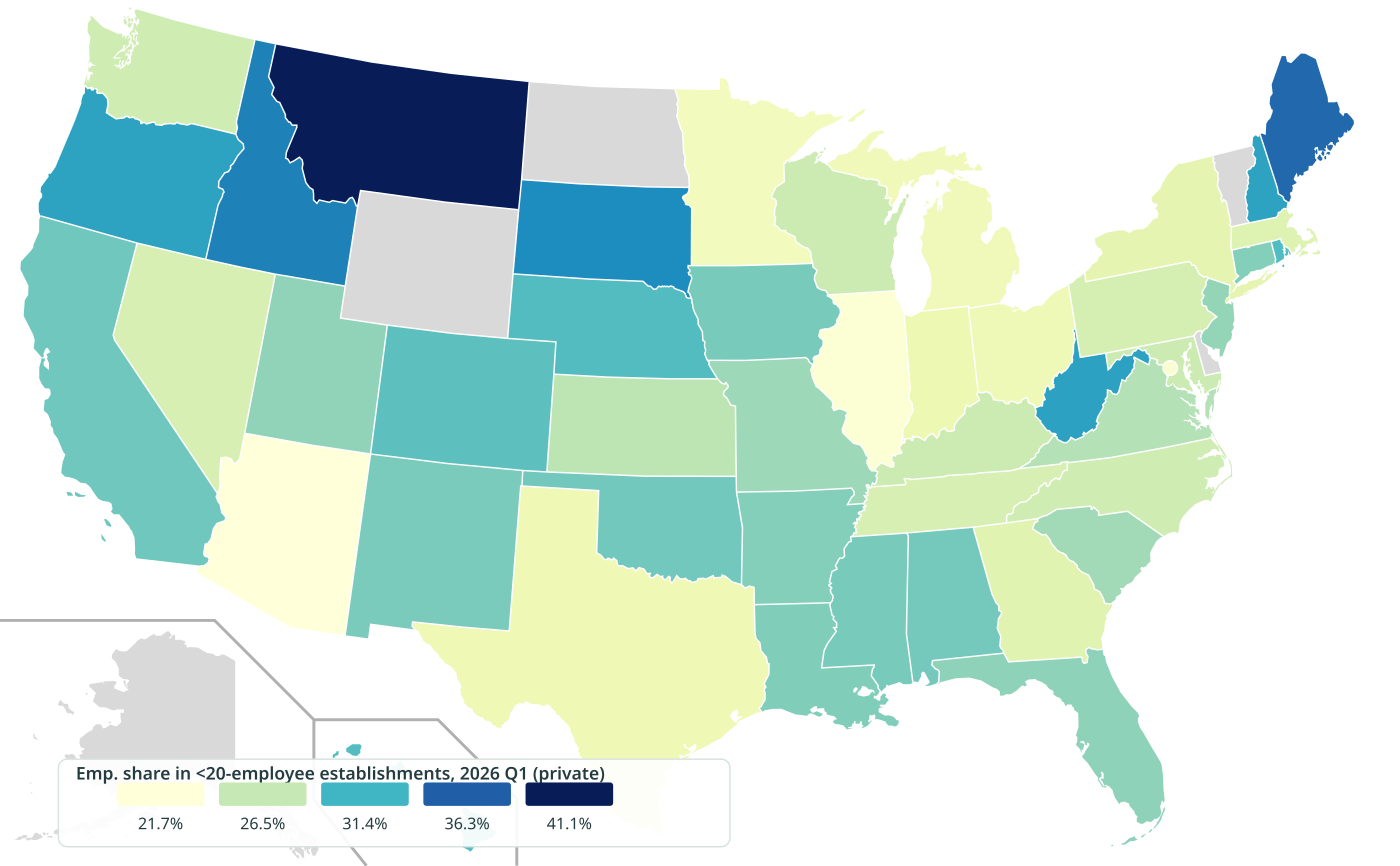
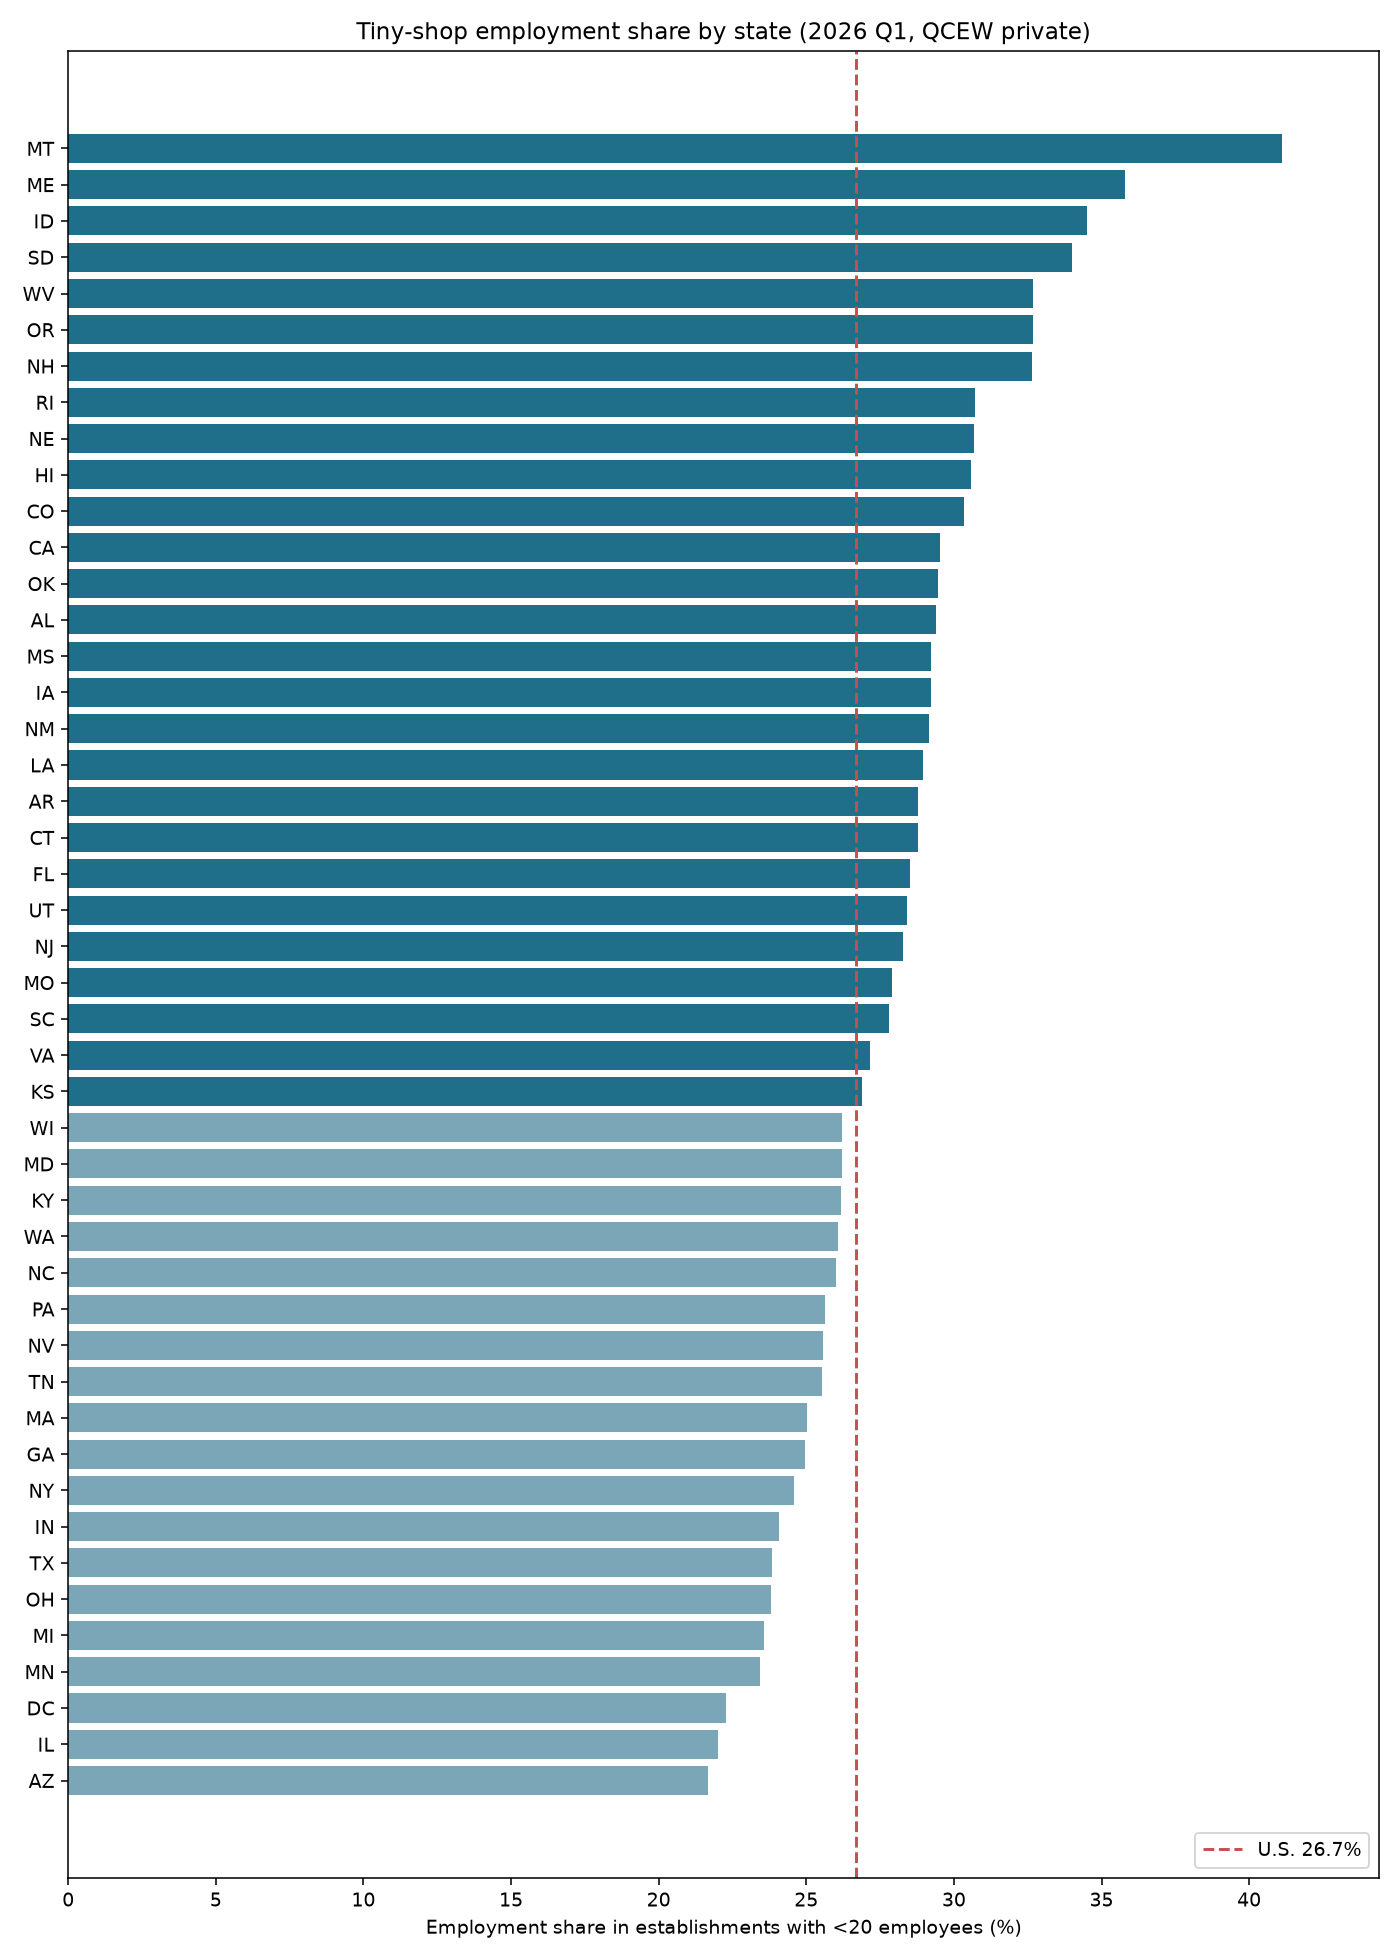
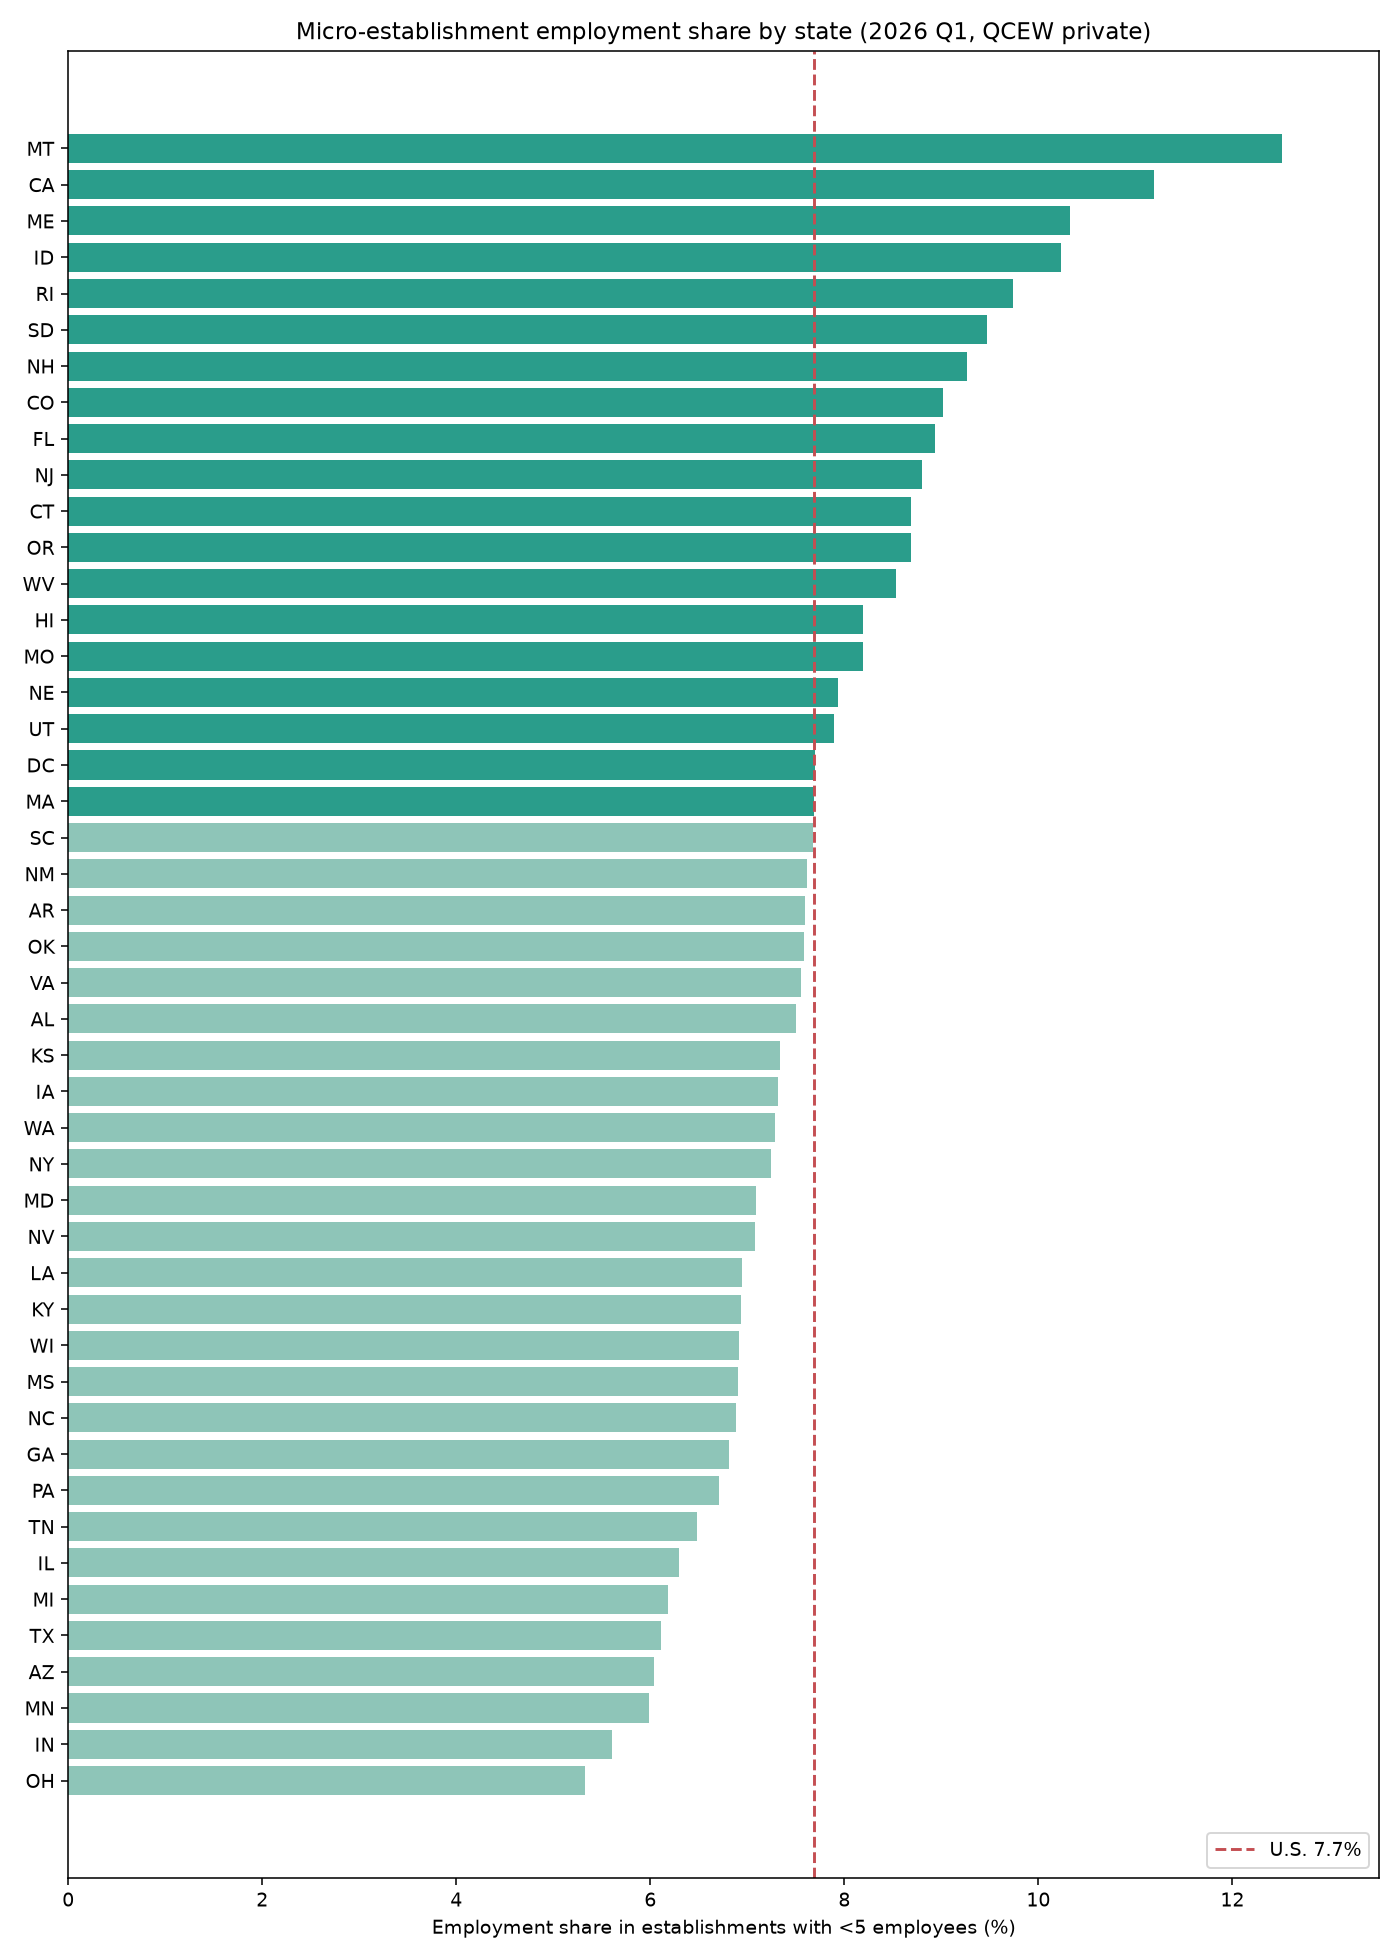
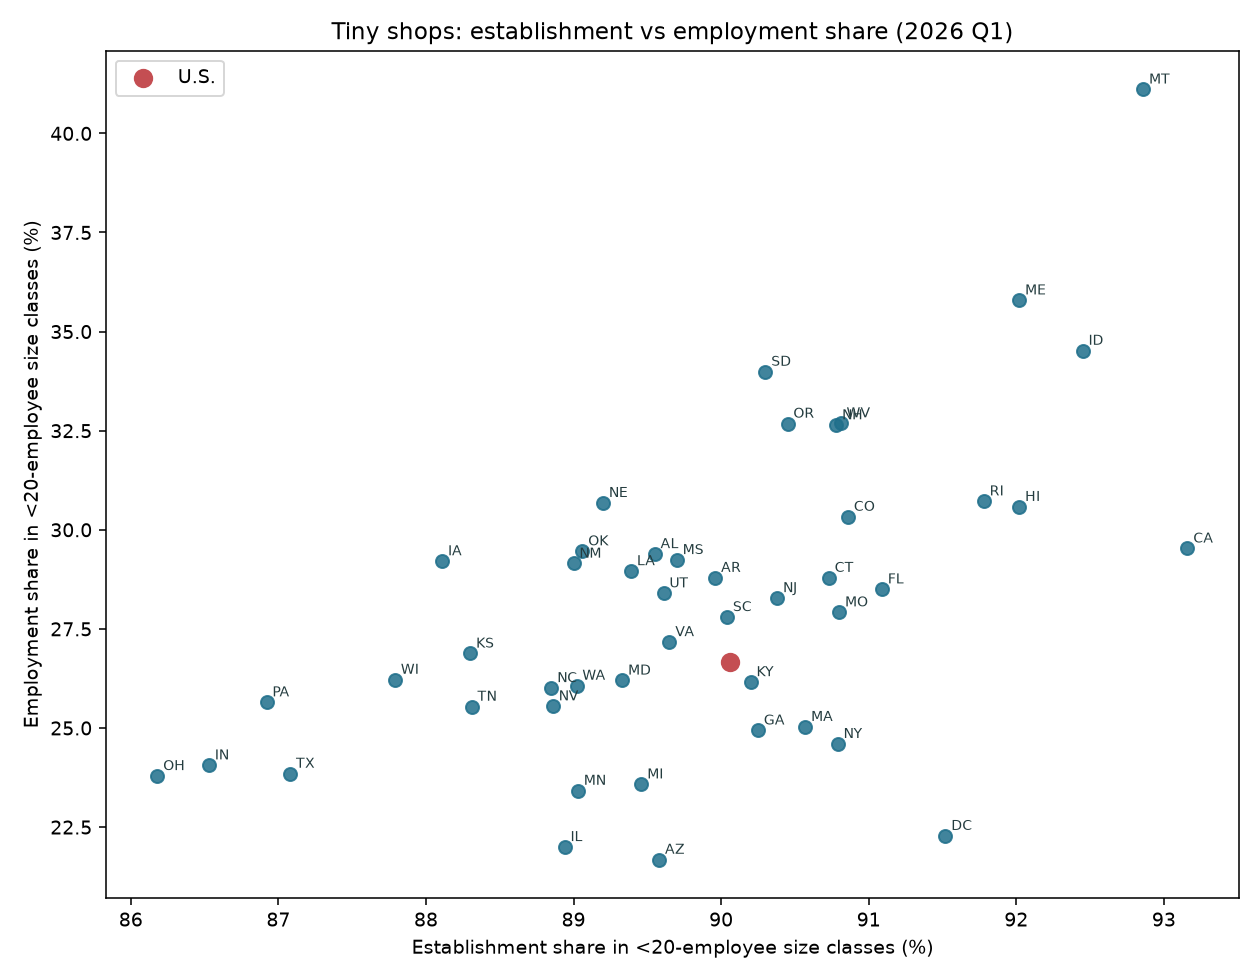
Most workplaces are tiny; most jobs are not. In 2026 Q1, establishments with fewer than 20 employees held 26.7% of U.S. private employment — and 90.1% of private establishments. Micro shops (fewer than 5 employees) held 7.7% of jobs but 68.3% of locations. Across states with full disclosure, the <20 employment share ranged from Arizona 21.7% to Montana 41.1%. This ranks where private payroll lives in small establishments — not Economic Census firm-size brackets, and not mean employees per location.
Key stats (U.S. private, 2026 Q1)
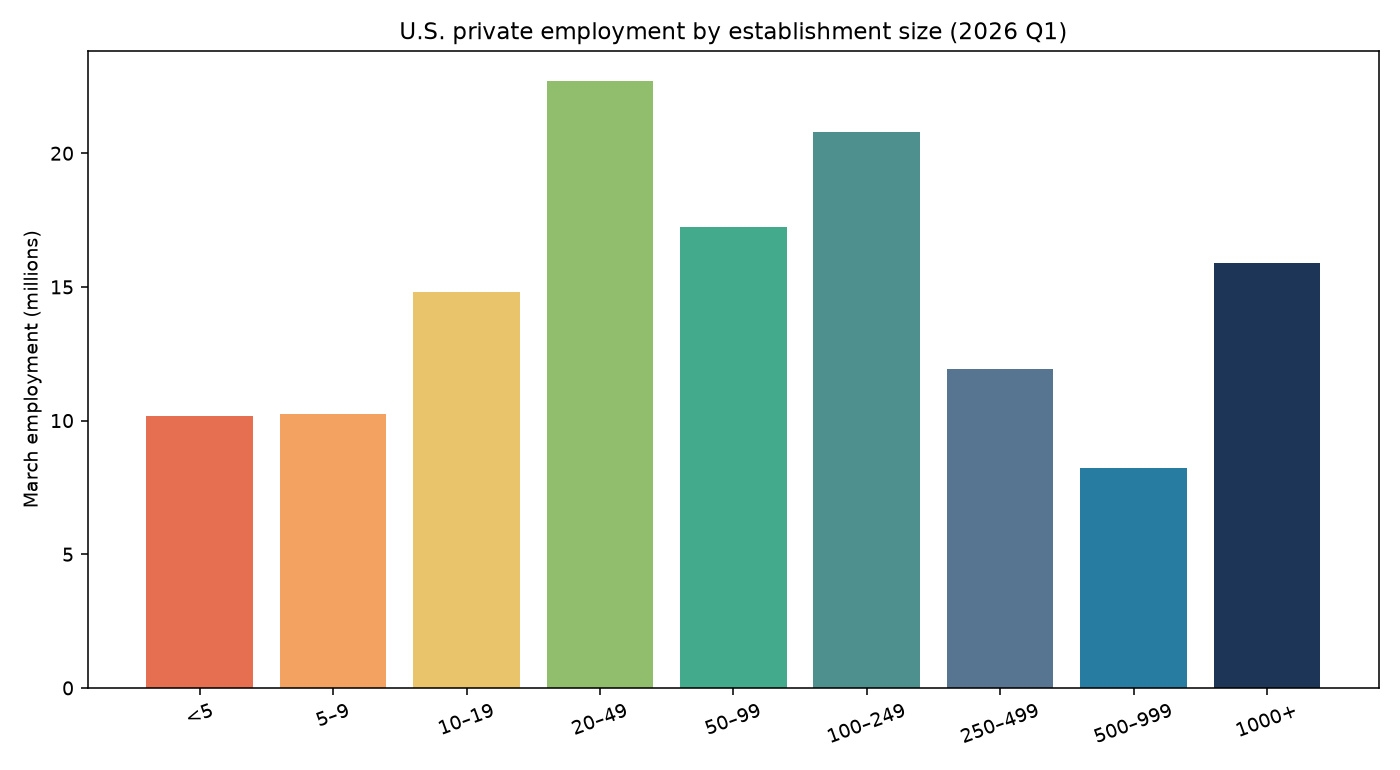
- 26.7% of private March employment is in establishments with <20 employees (35.2M of 132.0M jobs).
- 7.7% is in establishments with <5 employees; by contrast, establishments with 100+ employees hold 43.1% of jobs and 500+ hold 18.3%.
- On the establishment side, 68.3% of private locations have <5 employees and 90.1% have <20 — so tiny shops dominate the location count, not the job count.
- Highest <20 employment share: Montana 41.1%, Maine 35.8%, Idaho 34.5%.
- Lowest (disclosed): Arizona 21.7%, Illinois 22.0%, District of Columbia 22.3% · median among 46 ranked jurisdictions 28.1%.
- Suppressed (not ranked): AK, DE, ND, VT, WY — BLS withheld employment in the <5 size class; shares are blank, never zero-filled.
Distinct from companion pages on this site:
- Firm size ≠ establishment size. How big are service businesses? uses national Economic Census firm employment-size brackets for five industries. This page uses BLS QCEW establishment size classes and ranks states by employment share.
- Mean location size ≠ share in size classes. Employer pay and typical location size by state reports QCEW average annual pay and mean employees per establishment by state×NAICS. Here the question is what fraction of private jobs sit in published small size bands.
- Firm age ≠ shop size. Optional companion: young-firm job share by state (Census BDS firms age ≤5). A young firm can be large; a tiny shop can be old.
Map & charts
Ranked state table
Primary sort: employment share in establishments with fewer than 20 employees (size codes 1+2+3). State names link to state startup hubs. Em dashes mark suppressed or incomplete size components.
| Rank | State | Emp share <20 | Emp share <5 | Estab share <20 | Estab share <5 | Emp share 100+ | Emp share 500+ | Private EMP (Mar) |
|---|---|---|---|---|---|---|---|---|
| — | United States | 26.7% | 7.7% | 90.1% | 68.3% | 43.1% | 18.3% | 132.0M |
| 1 | Montana | 41.1% | 12.5% | 92.9% | 71.5% | — | — | 421,957 |
| 2 | Maine | 35.8% | 10.3% | 92.0% | 69.8% | 31.8% | 11.4% | 526,711 |
| 3 | Idaho | 34.5% | 10.2% | 92.5% | 73.1% | 31.8% | 11.4% | 741,845 |
| 4 | South Dakota | 34.0% | 9.5% | 90.3% | 65.2% | 32.1% | 11.3% | 375,386 |
| 5 | West Virginia | 32.7% | 8.5% | 90.8% | 66.3% | 34.2% | 11.8% | 557,248 |
| 6 | Oregon | 32.7% | 8.7% | 90.5% | 65.5% | 35.2% | 12.5% | 1.7M |
| 7 | New Hampshire | 32.6% | 9.3% | 90.8% | 67.9% | 34.4% | 11.2% | 589,987 |
| 8 | Rhode Island | 30.7% | 9.7% | 91.8% | 72.3% | 38.0% | 16.9% | 425,803 |
| 9 | Nebraska | 30.7% | 7.9% | 89.2% | 62.8% | 37.0% | 14.5% | 839,792 |
| 10 | Hawaii | 30.6% | 8.2% | 92.0% | 72.4% | 36.4% | 14.0% | 519,111 |
| 11 | Colorado | 30.3% | 9.0% | 90.9% | 70.3% | 36.4% | 11.9% | 2.4M |
| 12 | California | 29.5% | 11.2% | 93.2% | 77.9% | 41.5% | 18.6% | 15.5M |
| 13 | Oklahoma | 29.5% | 7.6% | 89.1% | 63.9% | 36.9% | 12.1% | 1.4M |
| 14 | Alabama | 29.4% | 7.5% | 89.5% | 65.1% | 38.4% | 13.0% | 1.7M |
| 15 | Mississippi | 29.2% | 6.9% | 89.7% | 65.0% | 37.9% | 14.6% | 934,486 |
| 16 | Iowa | 29.2% | 7.3% | 88.1% | 60.3% | 38.5% | 13.8% | 1.3M |
| 17 | New Mexico | 29.1% | 7.6% | 89.0% | 64.7% | 37.0% | 12.2% | 681,517 |
| 18 | Louisiana | 29.0% | 7.0% | 89.4% | 65.1% | 36.9% | 12.3% | 1.6M |
| 19 | Arkansas | 28.8% | 7.6% | 90.0% | 66.4% | 38.8% | 16.2% | 1.1M |
| 20 | Connecticut | 28.8% | 8.7% | 90.7% | 69.8% | 39.7% | 16.2% | 1.4M |
| 21 | Florida | 28.5% | 8.9% | 91.1% | 70.4% | 41.8% | 16.8% | 8.8M |
| 22 | Utah | 28.4% | 7.9% | 89.6% | 66.9% | 39.5% | 14.8% | 1.5M |
| 23 | New Jersey | 28.3% | 8.8% | 90.4% | 68.0% | 42.0% | 17.6% | 3.6M |
| 24 | Missouri | 27.9% | 8.2% | 90.8% | 70.8% | 40.4% | 16.0% | 2.5M |
| 25 | South Carolina | 27.8% | 7.7% | 90.0% | 68.2% | 40.1% | 14.7% | 2.0M |
| 26 | Virginia | 27.2% | 7.5% | 89.7% | 67.8% | 40.3% | 16.2% | 3.4M |
| 27 | Kansas | 26.9% | 7.3% | 88.3% | 63.4% | 41.0% | 15.3% | 1.2M |
| 28 | Wisconsin | 26.2% | 6.9% | 87.8% | 62.6% | 41.4% | 14.8% | 2.5M |
| 29 | Maryland | 26.2% | 7.1% | 89.3% | 67.2% | 41.2% | 15.6% | 2.2M |
| 30 | Kentucky | 26.2% | 6.9% | 90.2% | 68.8% | 43.8% | 16.3% | 1.7M |
| 31 | Washington | 26.1% | 7.3% | 89.0% | 64.0% | 45.0% | 22.7% | 3.0M |
| 32 | North Carolina | 26.0% | 6.9% | 88.8% | 65.9% | 41.4% | 16.8% | 4.2M |
| 33 | Pennsylvania | 25.6% | 6.7% | 86.9% | 59.0% | 43.4% | 17.7% | 5.3M |
| 34 | Nevada | 25.6% | 7.1% | 88.9% | 64.6% | 45.1% | 22.2% | 1.4M |
| 35 | Tennessee | 25.5% | 6.5% | 88.3% | 63.2% | 43.8% | 18.0% | 2.8M |
| 36 | Massachusetts | 25.0% | 7.7% | 90.6% | 71.0% | 45.7% | 20.9% | 3.1M |
| 37 | Georgia | 24.9% | 6.8% | 90.2% | 69.9% | 45.2% | 18.8% | 4.2M |
| 38 | New York | 24.6% | 7.2% | 90.8% | 68.7% | 50.2% | 27.9% | 8.3M |
| 39 | Indiana | 24.1% | 5.6% | 86.5% | 59.1% | 44.6% | 18.4% | 2.8M |
| 40 | Texas | 23.9% | 6.1% | 87.1% | 60.9% | 45.6% | 18.8% | 12.1M |
| 41 | Ohio | 23.8% | 5.3% | 86.2% | 58.8% | 43.9% | 17.5% | 4.7M |
| 42 | Michigan | 23.6% | 6.2% | 89.5% | 66.9% | 48.6% | 21.0% | 3.8M |
| 43 | Minnesota | 23.4% | 6.0% | 89.0% | 67.5% | 45.9% | 19.1% | 2.5M |
| 44 | District of Columbia | 22.3% | 7.7% | 91.5% | 76.5% | 49.4% | 21.4% | 507,328 |
| 45 | Illinois | 22.0% | 6.3% | 88.9% | 66.7% | 51.2% | 24.2% | 5.2M |
| 46 | Arizona | 21.7% | 6.0% | 89.6% | 68.9% | 51.3% | 24.3% | 2.8M |
| — | Alaska | — | — | 90.3% | 64.3% | — | — | 245,192 |
| — | Delaware | — | — | 92.4% | 76.4% | — | — | 403,596 |
| — | North Dakota | — | — | 89.3% | 63.1% | — | — | 343,669 |
| — | Vermont | — | — | 92.5% | 71.9% | — | — | 250,787 |
| — | Wyoming | — | — | 92.8% | 68.8% | — | — | 207,224 |
Not a best-state ranking. A high tiny-shop employment share often tracks industry mix (more local services, fewer large headquarters or factories) and rural density — not formation ease or profitability. Pair with employer pay / typical location size, occupation wages, and best states to start a business.
Shop size does not change how you file an entity. If you want help with paperwork, ZenBusiness can file an LLC for $0 plus the state fee, in any state. Affiliate link — we earn a commission at no cost to you.
Related research
- How big are service businesses? — national Economic Census firm-size brackets (five industries).
- Employer pay and typical location size by state — QCEW avg pay + mean employees per establishment by state×NAICS.
- Young-firm job share by state — Census BDS firm age ≤5 employment and entry/exit.
- Service business wages by state — OEWS occupation medians.
- Nonemployer share by state — establishments without payroll (outside this QCEW frame).
- Business survival rates by state — BED establishment cohort survival.
- Practical guides: cleaning, daycare, HVAC, landscaping, salon.
Methodology & caveats
Source: BLS QCEW establishment size-class files for 2026 Q1 (first quarter). Size-class CSVs are published for Q1 only; annual averages carry size_code=0 (all sizes). Download: 2026_q1_by_size.zip. All-size private denominators from the Q1 industry-10 open-data slice. Ownership: private (own_code=5). Industry: Total, all industries (industry_code=10). Geography: U.S. + 50 states + D.C.
Size codes (BLS titles): 1 = Fewer than 5 employees; 2 = 5 to 9; 3 = 10 to 19; 4 = 20 to 49; 5 = 50 to 99; 6 = 100 to 249; 7 = 250 to 499; 8 = 500 to 999; 9 = 1000 or more. Employment uses March (month3_emplvl) because QCEW assigns establishments to size classes by March employment. Share <5 = size 1 ÷ private total. Share <20 = (1+2+3) ÷ private total. Share 100+ = (6+7+8+9) ÷ total; 500+ = (8+9) ÷ total.
Why not state×industry? Site-niche NAICS (561720, 561730, 23822, 624410, 812112) × size × state cells are heavily suppressed. The page leads with total private ranks.
Limits: Establishments ≠ firms (multi-unit firms appear as many locations). UI-covered wage & salary employment only — most nonemployers are out of scope. Suppressed cells are omitted, never zero-filled (AK, DE, ND, VT, WY missing <5 employment). Not a best-state score. Not legal, tax, or investment advice.
Frequently asked questions
What does “fewer than 5” mean if I have four W-2 employees?
QCEW size code 1 is titled “Fewer than 5 employees per establishment.” It is the published band closest to 1–4 employees. Size is measured at the establishment (location) in March, not the firm’s nationwide headcount.
Why do tiny shops hold ~90% of locations but only ~27% of jobs?
Most establishments are small, but large workplaces employ many people each. The employment distribution is skewed toward bigger size classes even though the establishment count is not.
Is this the same as SBA “small business” size standards?
No. SBA size standards are firm-level (often receipts or employees) by NAICS. This page uses BLS establishment employment size classes for UI-covered locations.
Why are five states blank?
BLS withheld March employment for the <5 size class in AK, DE, ND, VT, WY. Without that component we cannot form <5 or <20 employment shares. We do not invent zeros.
Why first quarter 2026 instead of an annual average?
QCEW publishes establishment size-class detail for the first quarter only. Annual files use size code 0 (all sizes). March employment also matches how BLS assigns size classes.
Does a high tiny-shop share mean it is easier to start a business there?
Not by itself. It describes where payroll currently sits. Industry mix, wages, survival, and regulation still matter — see the related research links.
Sources & how to cite
| Source | What we used | Link |
|---|---|---|
| BLS QCEW | 2026 Q1 by-size CSV; private; industry 10; size codes 1–9; March employment | QCEW · size titles · 2026 Q1 by size zip |
| BLS QCEW open data | Industry 10 Q1 slice for all-size (size_code=0) private denominators |
Open data |
| This page | Derived shares, ranks, map, CSV | Canonical URL |
Suggested citation: StartBusinessByState.com, “Where Employment Lives in Tiny Shops — Establishment Size-Class Employment Share by State (BLS QCEW 2026 Q1),” published September 22, 2026, https://startbusinessbystate.com/establishment-size-employment-share-by-state/.
Download
Download the state CSV (employment and establishment shares for <5 / <20 / 100+ / 500+, ranks, per-size levels, suppression flags). Cite with a link to this page.
Dataset license and reuse
Reuse terms, version September 27, 2026. You may quote our original findings and summary statistics with credit to StartBusinessByState.com and a link to this page. Keep the source names, data years, units and relevant limitations with quoted figures.
This permission covers our original contributions to this dataset. It does not relicense underlying source data or grant blanket permission to redistribute third-party datasets. Source data retains its provider’s terms, and public-domain material remains public domain. Any additional reuse permissions stated elsewhere on this page still apply. For other reuse of our original material, contact us.