Original research · Census Business Dynamics Statistics (BDS) · Firm age (FAGE) · Vintage 2023 (latest published annual release) · Employer firms only · Published September 22, 2026
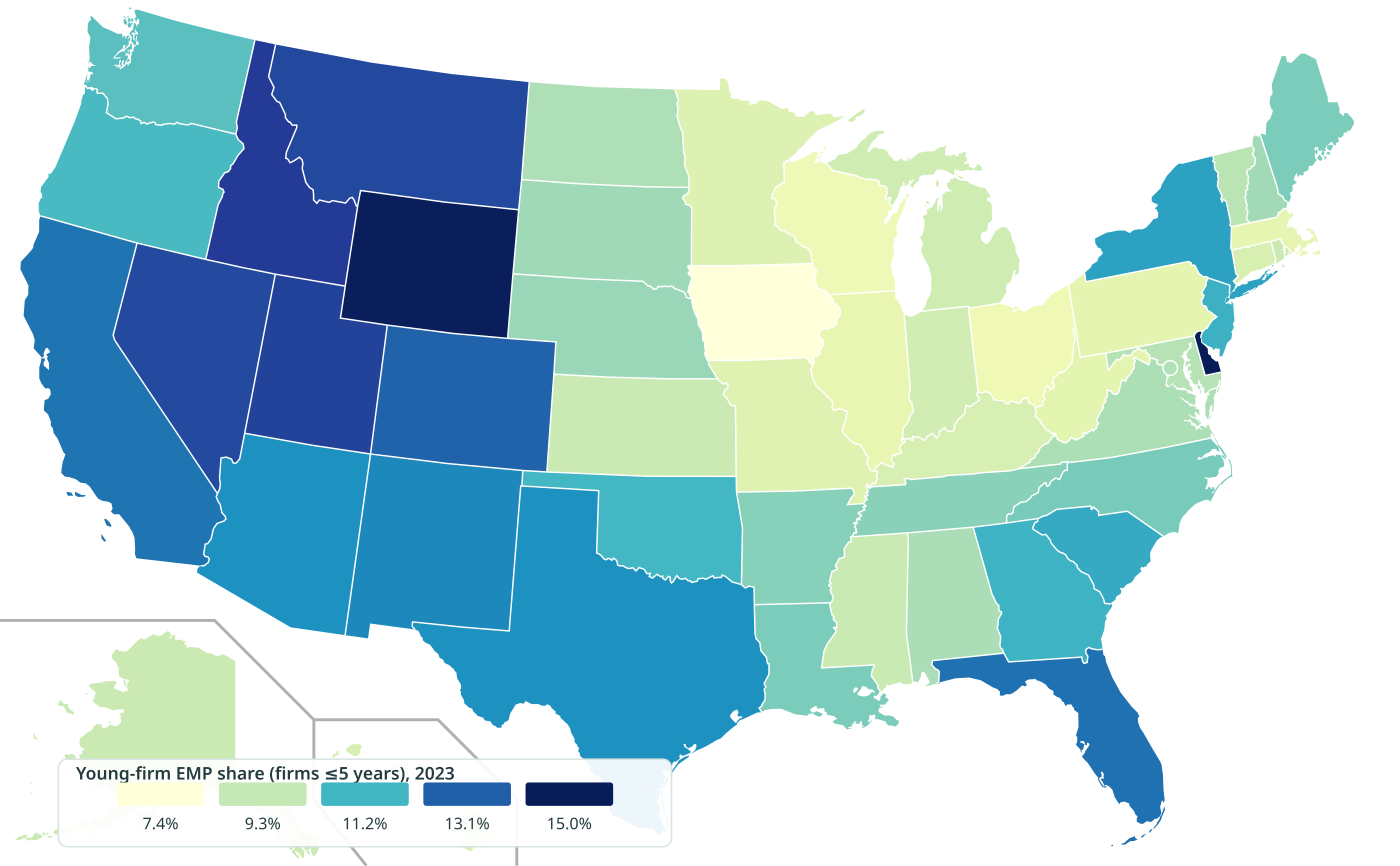
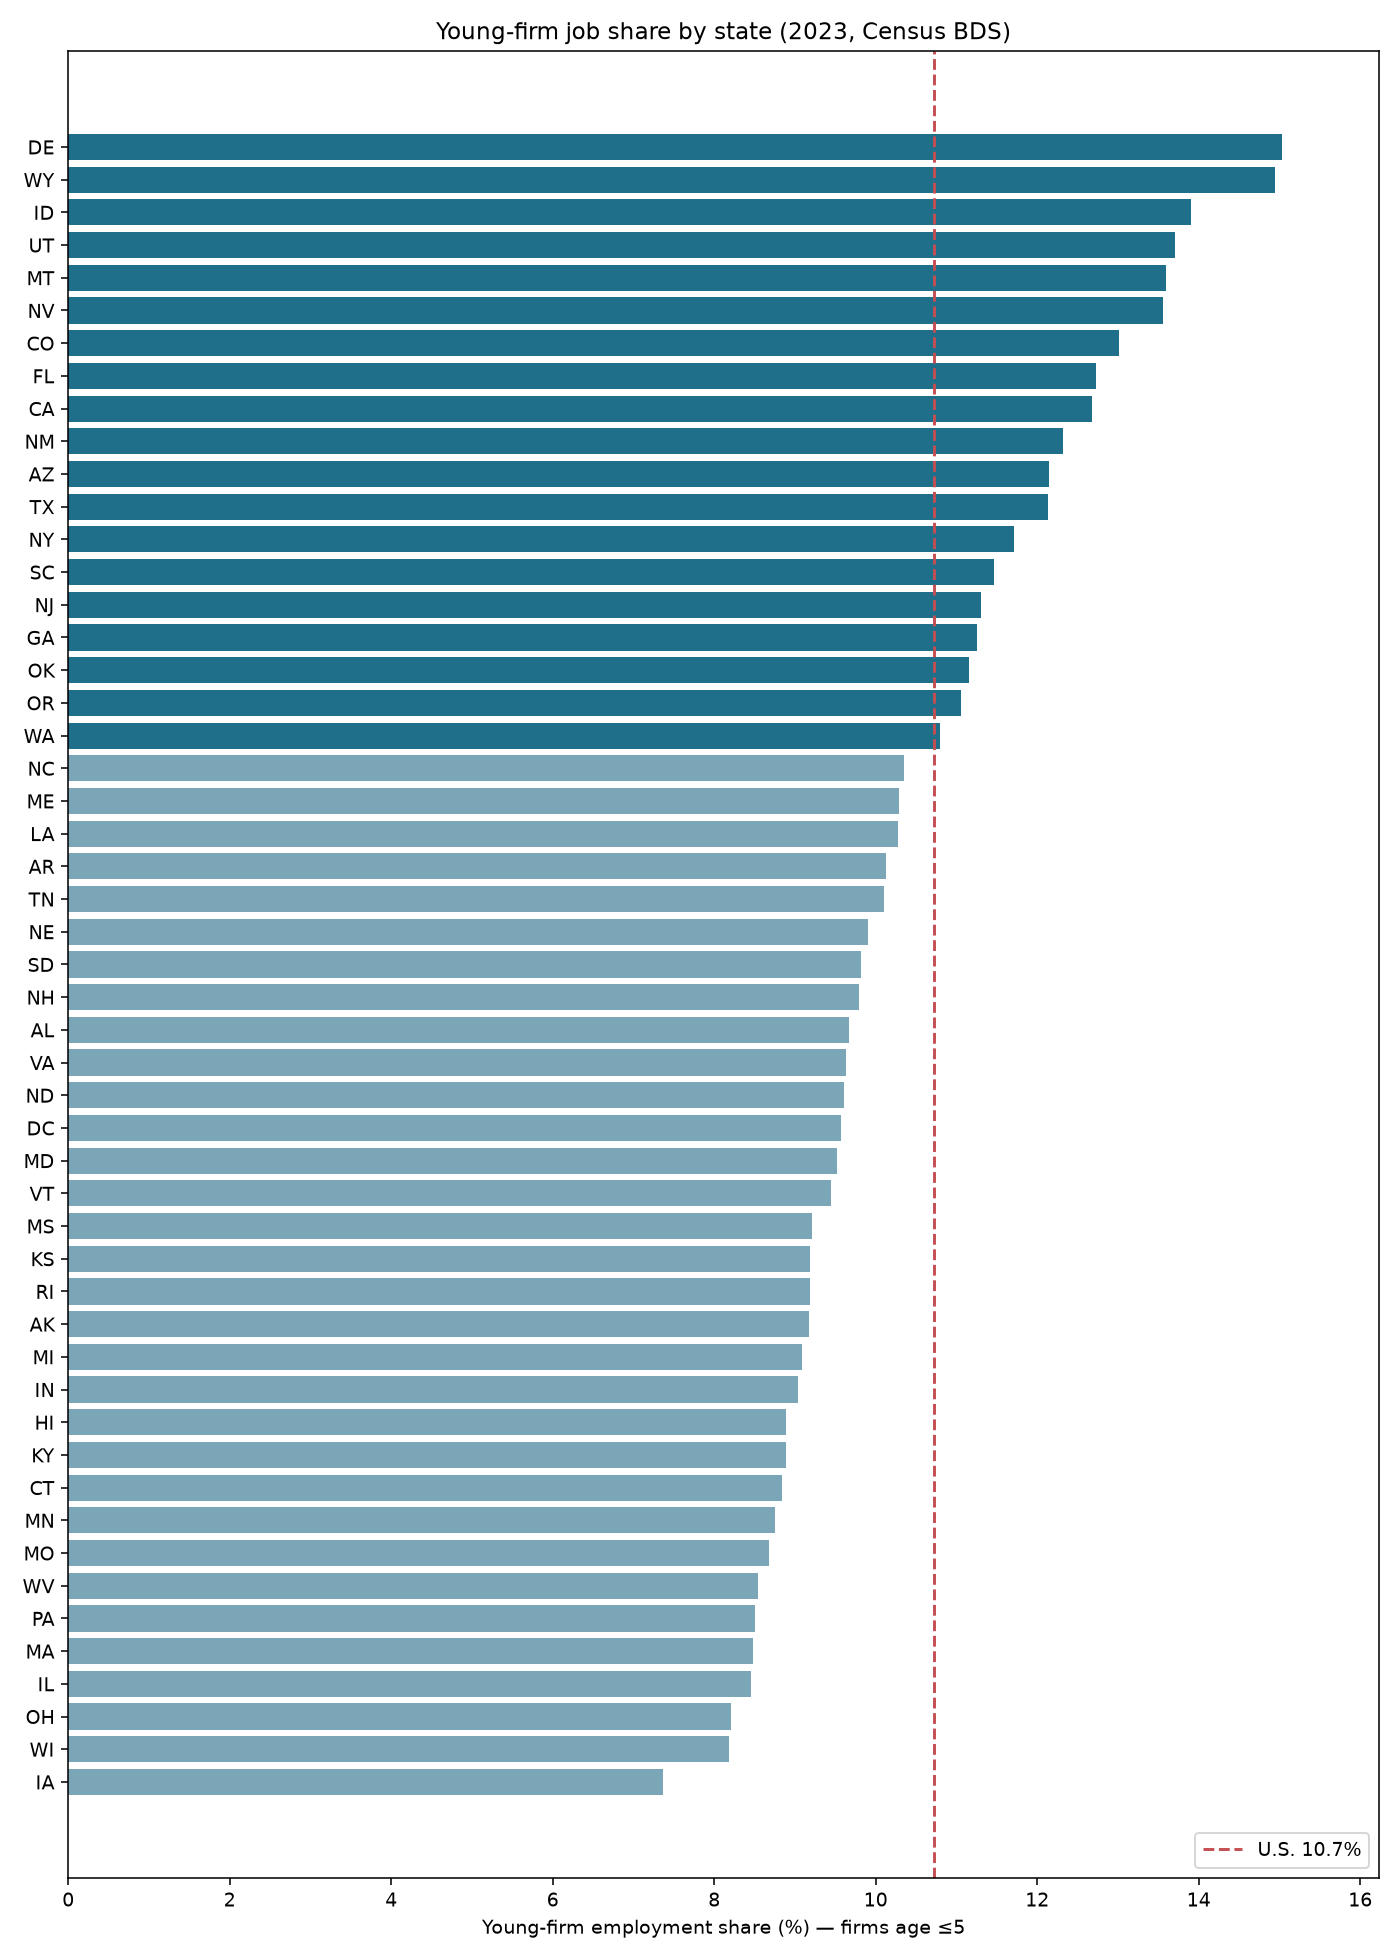
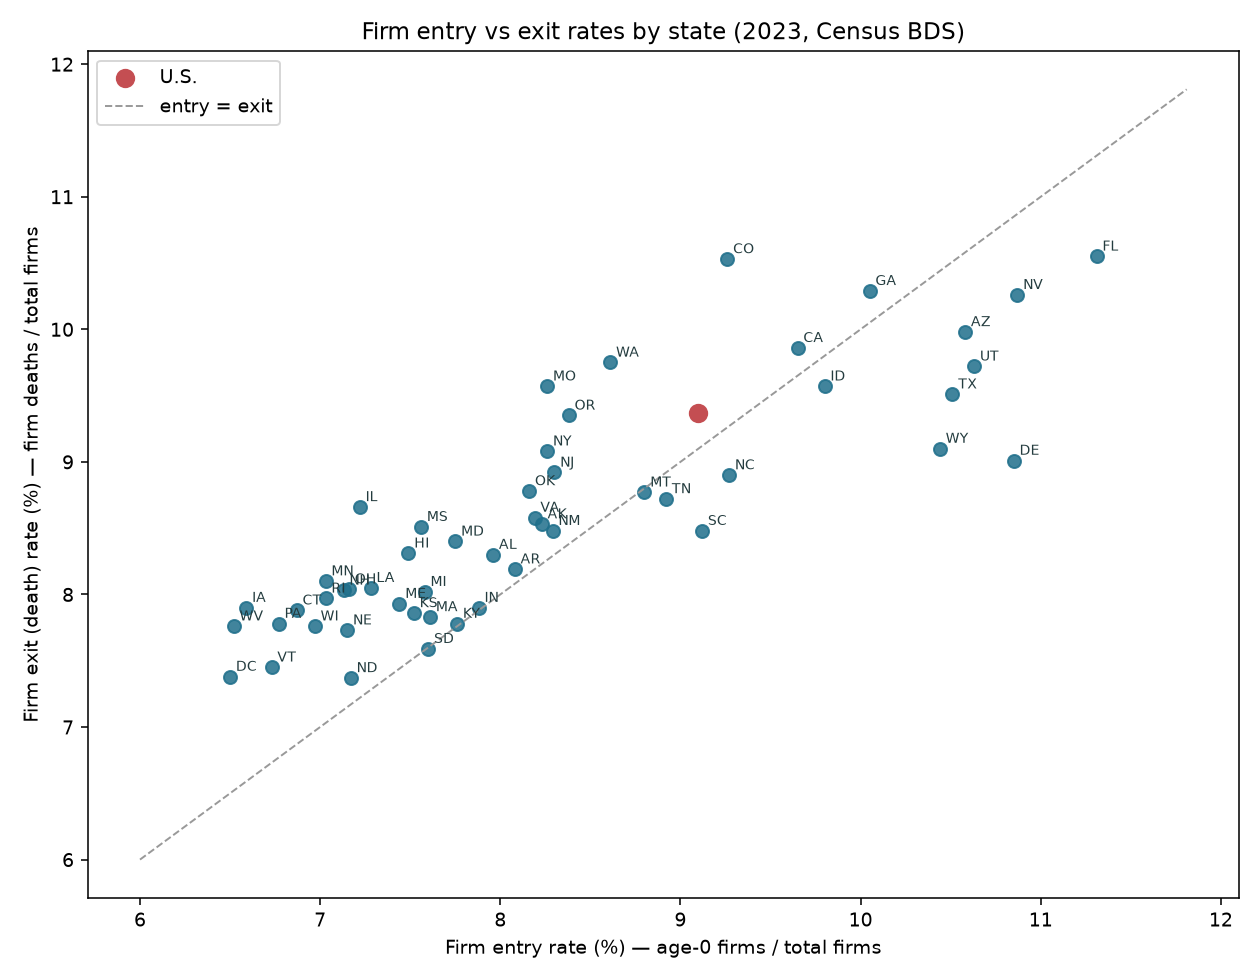
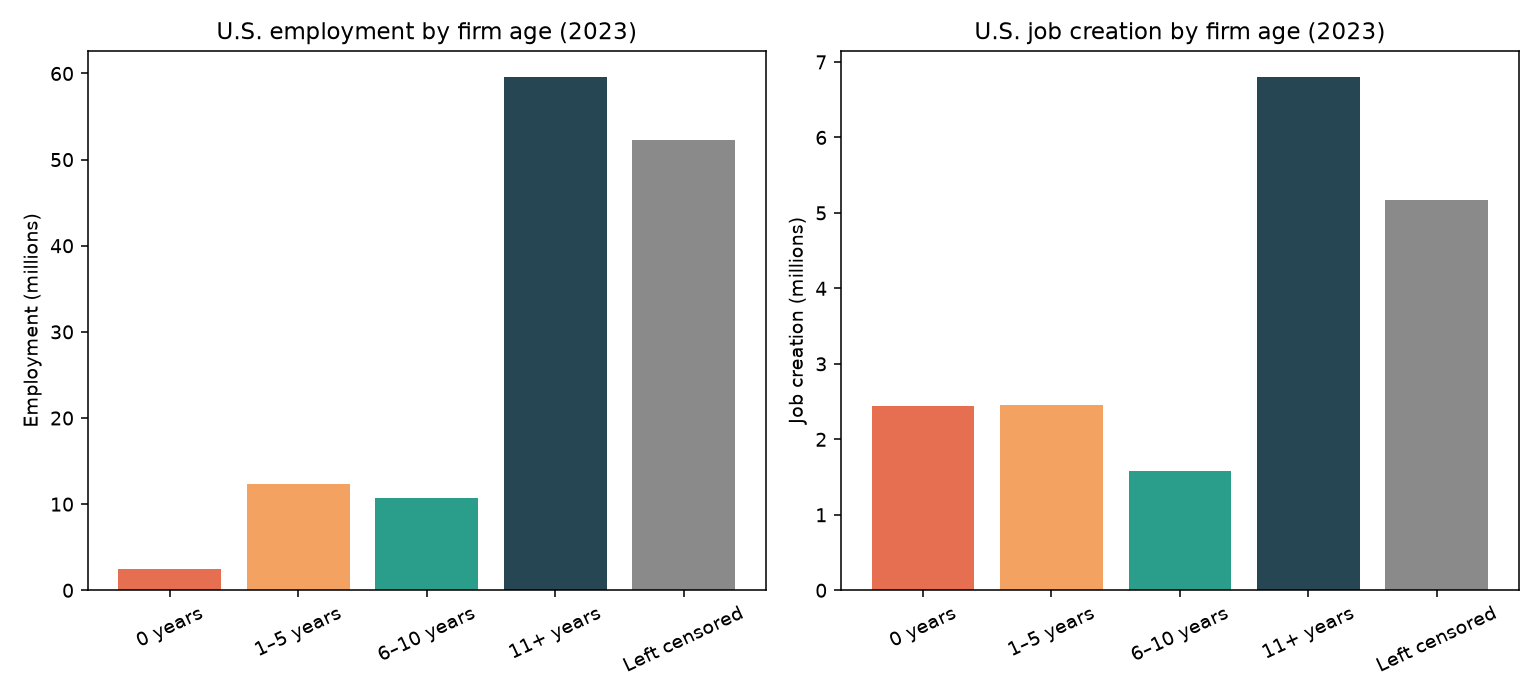
Young firms punch above their employment weight. In 2023, firms age 5 years or younger accounted for just 10.7% of U.S. employer-firm employment — but 36.2% of firms and 26.5% of job creation. Firm entry (age-0 startups as a share of firm stock) ran 9.1% and firm deaths 9.4%. Across states, young-firm job share stretched from Iowa 7.4% to Delaware 15.0%. This is a firm-age picture from Census BDS — not establishment survival, not BED openings/churn, and not business-application counts.
Key stats (U.S., 2023)
- 10.7% of employer-firm employment is in firms age ≤5 (14.7M of 137.5M jobs).
- Those same young firms are 36.2% of the firm stock and produce 26.5% of job creation.
- 508,777 age-0 firms entered → entry rate 9.1%; 523,958 firm deaths → exit rate 9.4%.
- Highest young-firm job share: Delaware 15.0%, Wyoming 14.9%, Idaho 13.9%.
- Lowest: Iowa 7.4%, Wisconsin 8.2%, Ohio 8.2% (50 states + D.C.; median 9.8%).
Distinct from companion pages on this site:
- Establishment survival ≠ firm age. Our business survival rates by state track whether a BLS BED establishment cohort still reports employment years later. This page measures how much of today’s employment sits in Census BDS firms that are young.
- BED churn ≠ BDS firm entry/exit. Service business openings, closings, and churn is quarterly establishment job flows. Here, entry is age-0 firms and exit is firm deaths.
- BFS applications ≠ firm births. Business formation statistics count EIN applications and projected formations — intent signals. BDS age-0 firms are employers that already appear in the payroll universe.
Map & charts
Ranked state table
Sorted by young-firm employment share. State names link to state startup hubs. Em dashes would mark suppressed cells; none were missing in this vintage.
| Rank | State | Young EMP share | Young firm share | Young JC share | Firm entry rate | Firm exit rate | Young EMP | Age-0 firms |
|---|---|---|---|---|---|---|---|---|
| — | United States | 10.7% | 36.2% | 26.5% | 9.1% | 9.4% | 14.7M | 508,777 |
| 1 | Delaware | 15.0% | 38.5% | 34.4% | 10.8% | 9.0% | 68,732 | 2,248 |
| 2 | Wyoming | 14.9% | 36.2% | 39.1% | 10.4% | 9.1% | 31,860 | 1,808 |
| 3 | Idaho | 13.9% | 40.1% | 33.3% | 9.8% | 9.6% | 98,605 | 4,074 |
| 4 | Utah | 13.7% | 41.5% | 32.5% | 10.6% | 9.7% | 215,798 | 7,199 |
| 5 | Montana | 13.6% | 34.3% | 36.1% | 8.8% | 8.8% | 55,514 | 2,708 |
| 6 | Nevada | 13.6% | 42.1% | 29.4% | 10.9% | 10.3% | 181,344 | 5,829 |
| 7 | Colorado | 13.0% | 38.5% | 29.6% | 9.3% | 10.5% | 332,984 | 11,839 |
| 8 | Florida | 12.7% | 42.4% | 30.2% | 11.3% | 10.6% | 1.2M | 51,518 |
| 9 | California | 12.7% | 39.5% | 30.3% | 9.7% | 9.9% | 2.0M | 70,055 |
| 10 | New Mexico | 12.3% | 30.9% | 30.3% | 8.3% | 8.5% | 80,748 | 2,617 |
| 11 | Arizona | 12.2% | 40.3% | 27.4% | 10.6% | 10.0% | 349,465 | 11,411 |
| 12 | Texas | 12.1% | 40.6% | 27.6% | 10.5% | 9.5% | 1.5M | 47,108 |
| 13 | New York | 11.7% | 33.3% | 28.4% | 8.3% | 9.1% | 997,744 | 33,208 |
| 14 | South Carolina | 11.5% | 36.0% | 28.2% | 9.1% | 8.5% | 223,888 | 7,641 |
| 15 | New Jersey | 11.3% | 32.5% | 27.5% | 8.3% | 8.9% | 442,384 | 14,547 |
| 16 | Georgia | 11.3% | 38.7% | 27.1% | 10.1% | 10.3% | 486,688 | 17,841 |
| 17 | Oklahoma | 11.2% | 32.2% | 28.1% | 8.2% | 8.8% | 158,973 | 5,463 |
| 18 | Oregon | 11.1% | 34.8% | 28.4% | 8.4% | 9.3% | 186,953 | 7,399 |
| 19 | Washington | 10.8% | 36.2% | 24.2% | 8.6% | 9.8% | 319,439 | 12,280 |
| 20 | North Carolina | 10.3% | 36.7% | 25.7% | 9.3% | 8.9% | 440,645 | 16,322 |
| 21 | Maine | 10.3% | 31.3% | 28.6% | 7.4% | 7.9% | 56,357 | 2,288 |
| 22 | Louisiana | 10.3% | 30.2% | 24.5% | 7.3% | 8.1% | 173,875 | 5,480 |
| 23 | Arkansas | 10.1% | 32.1% | 29.9% | 8.1% | 8.2% | 113,515 | 3,866 |
| 24 | Tennessee | 10.1% | 34.5% | 25.1% | 8.9% | 8.7% | 295,491 | 8,740 |
| 25 | Nebraska | 9.9% | 29.4% | 24.9% | 7.2% | 7.7% | 91,260 | 2,871 |
| 26 | South Dakota | 9.8% | 29.9% | 26.3% | 7.6% | 7.6% | 37,871 | 1,605 |
| 27 | New Hampshire | 9.8% | 30.0% | 27.2% | 7.1% | 8.0% | 61,286 | 2,040 |
| 28 | Alabama | 9.7% | 31.4% | 27.7% | 8.0% | 8.3% | 175,883 | 5,688 |
| 29 | Virginia | 9.6% | 33.4% | 24.1% | 8.2% | 8.6% | 343,955 | 11,835 |
| 30 | North Dakota | 9.6% | 28.1% | 26.2% | 7.2% | 7.4% | 33,706 | 1,287 |
| 31 | District of Columbia | 9.6% | 29.6% | 22.6% | 6.5% | 7.4% | 53,781 | 1,129 |
| 32 | Maryland | 9.5% | 31.4% | 25.2% | 7.8% | 8.4% | 230,092 | 7,811 |
| 33 | Vermont | 9.4% | 27.3% | 28.7% | 6.7% | 7.5% | 24,145 | 1,068 |
| 34 | Mississippi | 9.2% | 29.5% | 26.9% | 7.6% | 8.5% | 87,912 | 3,132 |
| 35 | Kansas | 9.2% | 29.7% | 23.6% | 7.5% | 7.9% | 114,992 | 3,975 |
| 36 | Rhode Island | 9.2% | 28.7% | 25.9% | 7.0% | 8.0% | 40,732 | 1,563 |
| 37 | Alaska | 9.2% | 31.6% | 21.7% | 8.2% | 8.5% | 24,376 | 1,222 |
| 38 | Michigan | 9.1% | 30.3% | 23.0% | 7.6% | 8.0% | 361,272 | 11,814 |
| 39 | Indiana | 9.0% | 31.4% | 24.6% | 7.9% | 7.9% | 264,208 | 8,106 |
| 40 | Hawaii | 8.9% | 29.9% | 25.6% | 7.5% | 8.3% | 46,282 | 1,736 |
| 41 | Kentucky | 8.9% | 30.1% | 23.9% | 7.8% | 7.8% | 150,920 | 4,803 |
| 42 | Connecticut | 8.8% | 28.5% | 21.4% | 6.9% | 7.9% | 135,854 | 4,349 |
| 43 | Minnesota | 8.8% | 29.3% | 24.8% | 7.0% | 8.1% | 241,184 | 7,296 |
| 44 | Missouri | 8.7% | 31.8% | 22.9% | 8.3% | 9.6% | 228,235 | 8,453 |
| 45 | West Virginia | 8.5% | 25.5% | 23.8% | 6.5% | 7.8% | 47,034 | 1,532 |
| 46 | Pennsylvania | 8.5% | 29.0% | 22.5% | 6.8% | 7.8% | 483,259 | 14,288 |
| 47 | Massachusetts | 8.5% | 31.1% | 23.0% | 7.6% | 7.8% | 295,068 | 9,985 |
| 48 | Illinois | 8.5% | 30.6% | 21.2% | 7.2% | 8.7% | 474,218 | 16,056 |
| 49 | Ohio | 8.2% | 29.1% | 21.0% | 7.2% | 8.0% | 412,752 | 11,994 |
| 50 | Wisconsin | 8.2% | 28.5% | 22.0% | 7.0% | 7.8% | 215,533 | 6,856 |
| 51 | Iowa | 7.4% | 28.2% | 19.5% | 6.6% | 7.9% | 105,275 | 3,717 |
Not a best-state ranking. A high young-firm job share often co-moves with faster entry and exit (see Florida, Nevada, Arizona). Pair this table with establishment survival and best states to start a business rather than treating youth share alone as opportunity.
Forming an LLC (or another entity) does not change these BDS firm-age rates. If you want help filing formation paperwork, ZenBusiness can file an LLC for $0 plus the state fee, in any state. Affiliate link — we earn a commission at no cost to you.
Related research
- Business survival rates by state — BLS BED establishment cohort survival at 1–30 years.
- Service business openings, closings, and churn — BED quarterly establishment job flows by sector.
- Business formation statistics — Census BFS applications and projected formations.
- Best states to start a business — multi-factor formation context.
- How big are service businesses? — employer size brackets; service businesses without employees — nonemployers outside BDS.
- Establishment size-class employment share by state — QCEW private employment shares in <5 / <20 employee shops (establishment size, not firm age).
- Practical guides: start a cleaning service, start a daycare, start an HVAC business, start a landscaping business.
Methodology & caveats
Source: Census Business Dynamics Statistics via the Data API (timeseries/bds), pulled 2026-09-22 with YEAR=2023 — the latest annual vintage published through 2023. Geography: United States + 50 states + D.C. Universe: employer firms only.
Young firms = published firm-age codes FAGE=010 (0 years) + FAGE=065 (1–5 years). Young-firm employment share = young EMP ÷ total EMP. Firm entry rate = age-0 firm count ÷ total firms. Firm exit rate = FIRMDEATH_FIRMS on the Total row ÷ total firms. Young job-creation share uses JOB_CREATION on the same age codes. The API has no separate FIRM_ENTRY_RATE field; entry is derived from the age-0 tabulation as documented by BDS firm-age releases.
Limits: Firms ≠ establishments (multi-unit firms count once). Left-censored firms (pre-1978 origin) sit in Total but not in the young sum. Suppressed cells are omitted, never zero-filled (none missing here). Annual series revise. High youth share is not a success score. Not legal, tax, or investment advice.
Frequently asked questions
What counts as a “young firm” here?
An employer firm whose Census BDS firm age is 0 through 5 years — the sum of published codes for age 0 and the 1–5 aggregate. Age is based on the firm’s first appearance with paid employees, not the date of an LLC filing.
Why is young-firm employment only ~11% if young firms are ~36% of firms?
Most young firms are small. Mature and left-censored firms hold the bulk of jobs. Young firms still account for roughly a quarter of job creation — more than their employment share.
Is firm entry the same as a business application?
No. Census BFS counts applications for EINs. BDS age-0 firms are employers already in the payroll data. Many applications never become employer firms.
How is this different from business survival rates?
Survival rates follow a cohort of establishments from an opening year and ask whether they still report employment later. This page is a cross-section of today’s firms by age. A state can have high entry and middling survival.
Do these figures include sole props without employees?
No. BDS covers employer firms. Nonemployers are covered separately (see our nonemployer page linked above).
Which year is this?
Calendar year 2023, the latest BDS annual release available when this page was published (September 2026). Later releases may revise 2023 cells.
Sources & how to cite
| Source | What we used | Link |
|---|---|---|
| Census BDS | Firm age (FAGE) EMP, FIRM, JOB_CREATION, FIRMDEATH_FIRMS; YEAR=2023; US + state | BDS program · API docs |
| This page | Derived shares, rates, map, CSV | Canonical URL |
Suggested citation: StartBusinessByState.com, “Young-Firm Job Share and Firm Entry/Exit by State (Census BDS 2023),” published September 22, 2026, https://startbusinessbystate.com/young-firm-job-share-by-state/.
Download
Download the state CSV (young EMP/firm/JC shares, firm entry and exit rates, levels). Cite with a link to this page.
Dataset license and reuse
Reuse terms, version September 27, 2026. You may quote our original findings and summary statistics with credit to StartBusinessByState.com and a link to this page. Keep the source names, data years, units and relevant limitations with quoted figures.
This permission covers our original contributions to this dataset. It does not relicense underlying source data or grant blanket permission to redistribute third-party datasets. Source data retains its provider’s terms, and public-domain material remains public domain. Any additional reuse permissions stated elsewhere on this page still apply. For other reuse of our original material, contact us.