Original research · USPTO PatentsView (AI patents granted in 2025; file released April 10, 2026) · Census Business Trends and Outlook Survey (three surveys, July 27 to September 6, 2026) · Last updated September 30, 2026
The states that invent the most AI are not always the ones where businesses use it most. Across 49 states and D.C., AI patents per person and business AI use are only moderately linked (r = 0.42). Utah, Delaware, Florida, Georgia and Idaho are among the top 10 for business AI use but not for AI patents. New Jersey and New York are in the top 10 for AI patents but near the bottom for business use.
Key findings
- Inventing AI and using it are only moderately linked. The correlation between AI patents per person and the share of businesses using AI is 0.42 across 49 states and D.C. That is a real but loose link, with plenty of exceptions.
- Utah businesses use AI the most: 30.9% of them, #1 of 49. But Utah is #14 for AI patents per person (3.16 per 100,000).
- Delaware (29.4%), Florida (27.4%), Georgia (26.4%) and Idaho (26.2%) also use more than they build. All four are in the top 10 for business AI use but rank #25, #21, #18 and #24 for AI patents per person.
- New Jersey and New York build more than they use. They are #7 and #10 for AI patents per person (4.03 and 3.51), but #45 and #46 for business AI use (17.5% and 17.2%).
- 6 places do both: California, Washington, District of Columbia, Oregon, Colorado and Virginia. California has by far the most AI patents per person (13.68), but its business AI use (25.0%) is only #12.
- 27 states are in neither group. West Virginia (14.8%), Alaska (15.2%) and Mississippi (16.5%) have the lowest business AI use.
The chart: build, use, both or neither
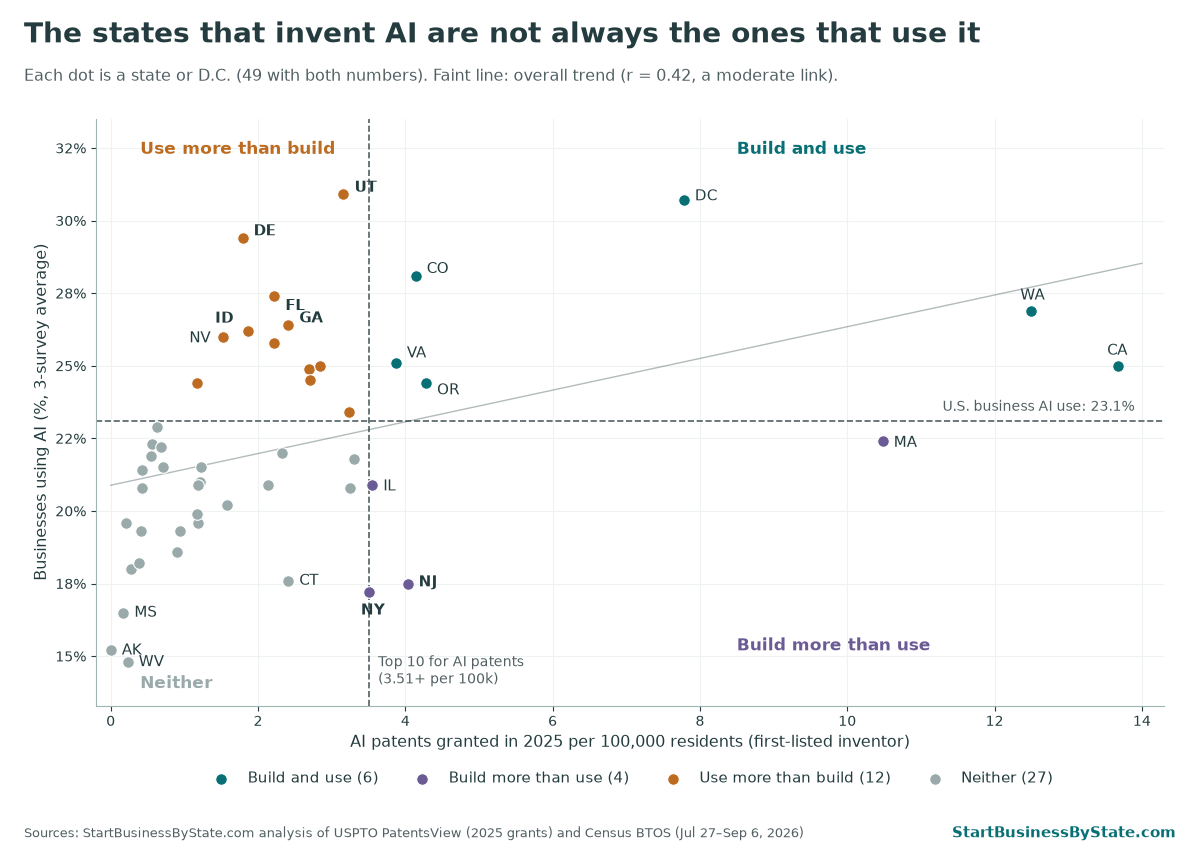
We sort each place into one of four plain groups. “Build” means a state is in the top 10 for AI patents per person (3.51 or more per 100,000 residents). “Use” means its share of businesses using AI is at or above the U.S. figure (23.1%).
- Build and use (6): California, Washington, District of Columbia, Oregon, Colorado and Virginia.
- Use more than build (12): Maryland, Utah, Texas, North Carolina, Minnesota, Georgia, Florida, Arizona, Idaho, Delaware, Nevada and South Carolina.
- Build more than use (4): Massachusetts, New Jersey, Illinois and New York.
- Neither (27): the rest of the states with both numbers. Rhode Island and North Dakota don’t have enough survey data to place.
18 states are within the survey’s margin of error of the U.S. use line, so their group could change with the next few surveys. Idaho is one of them. The others among our highlighted states are well clear of it.
How closely are they linked?
States with more AI patents per person do tend to have a bit more business AI use. But the link is loose. The correlation is 0.42 on a scale where 0 means no link and 1 means a perfect line. Put another way, only about 18% of the differences in business AI use between states line up with patents.
The link holds up but doesn’t get stronger when you change the details. Comparing ranks instead of raw numbers gives 0.54. Leaving out D.C. gives 0.37. Leaving out California gives 0.44.
This doesn’t show that one causes the other. Patents don’t make businesses use AI, and using AI doesn’t create patents. The two numbers count different groups of people over different years (see the methods box). Both likely reflect other things, like which industries a state has.
The biggest gaps
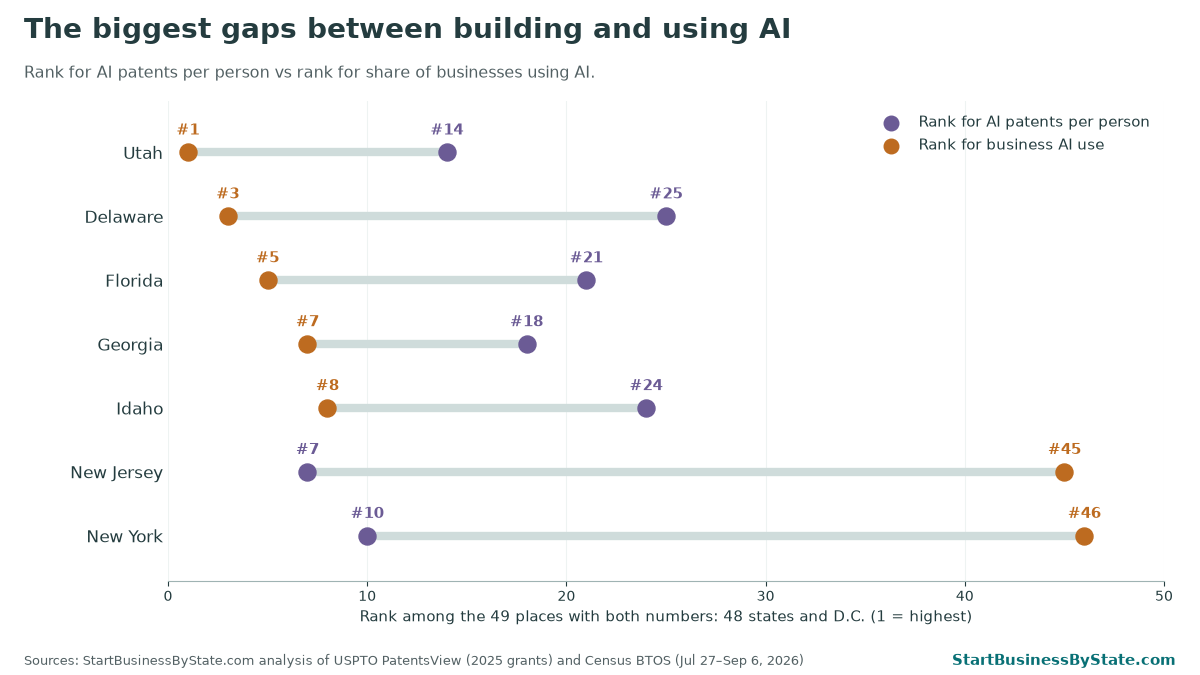
Utah has the highest share of businesses using AI in the country, 30.9% (±2.7 points). Its inventors got 112 AI patents in 2025, a solid 3.16 per 100,000 residents but below the top 10.
Delaware, Florida, Georgia and Idaho are all in the top 10 for use and in the middle of the pack for patents. Florida’s patent count is boosted by one company, as our AI patents by state page explains, and it still ranks #21 per person.
New Jersey and New York are the opposite. Their inventors get lots of AI patents. But only 17.5% and 17.2% of their businesses use AI, well below the U.S. figure of 23.1%. Massachusetts and Illinois are in the same group.
All states
| State | Group | AI patents, 2025 | Per 100,000 residents | Patent rank | Businesses using AI (3-survey avg) ± margin | Use rank | Latest survey (Aug 24–Sep 6) ± margin |
|---|---|---|---|---|---|---|---|
| United States | 13,754 | 4.02 | 23.1% ±0.3 | 23.8% ±0.4 | |||
| California | Build and use | 5,385 | 13.68 | 1 | 25.0% ±0.7 | 12 | 26.3% ±1.4 |
| Washington | Build and use | 1,000 | 12.50 | 2 | 26.9% ±1.9 | 6 | 26.2% ±3.3 |
| Massachusetts | Build more than use | 750 | 10.48 | 3 | 22.4% ±2.2 | 20 | 22.2% ±4.0 |
| District of Columbia | Build and use | 54 | 7.78 | 4 | 30.7% ±5.2 | 2 | 33.9% ±9.3 |
| Oregon | Build and use | 183 | 4.28 | 5 | 24.4% ±1.6 | 16 | 26.4% ±2.2 |
| Colorado | Build and use | 249 | 4.14 | 6 | 28.1% ±1.7 | 4 | 30.2% ±2.2 |
| New Jersey | Build more than use | 385 | 4.03 | 7 | 17.5% ±1.3 | 45 | 18.5% ±2.1 |
| Virginia | Build and use | 344 | 3.87 | 8 | 25.1% ±1.6 | 11 | 25.1% ±2.8 |
| Illinois | Build more than use | 452 | 3.55 | 9 | 20.9% ±1.0 | 30 | 22.0% ±2.3 |
| New York | Build more than use | 702 | 3.51 | 10 | 17.2% ±0.7 | 46 | 17.8% ±0.8 |
| Michigan | Neither | 334 | 3.30 | 11 | 21.8% ±1.6 | 25 | 20.0% ±3.0 |
| New Hampshire | Neither | 46 | 3.25 | 12 | 20.8% ±4.4 | 33 | 30.5% ±7.5 |
| Maryland | Use more than build | 203 | 3.24 | 13 | 23.4% ±2.3 | 18 | 23.4% ±3.6 |
| Utah | Use more than build | 112 | 3.16 | 14 | 30.9% ±2.7 | 1 | 28.8% ±4.7 |
| Texas | Use more than build | 900 | 2.84 | 15 | 25.0% ±1.0 | 12 | 24.0% ±2.2 |
| North Carolina | Use more than build | 302 | 2.70 | 16 | 24.5% ±1.3 | 15 | 25.6% ±1.6 |
| Minnesota | Use more than build | 157 | 2.69 | 17 | 24.9% ±2.2 | 14 | 28.7% ±4.6 |
| Connecticut | Neither | 89 | 2.41 | 18 | 17.6% ±1.7 | 44 | 17.2% ±2.5 |
| Georgia | Use more than build | 272 | 2.41 | 18 | 26.4% ±2.3 | 7 | 27.2% ±4.3 |
| Vermont | Neither | 15 | 2.33 | 20 | 22.0% ±4.6 | 23 | 17.7% ±5.0 |
| Arizona | Use more than build | 169 | 2.22 | 21 | 25.8% ±2.3 | 10 | 28.3% ±3.1 |
| Florida | Use more than build | 521 | 2.22 | 21 | 27.4% ±1.3 | 5 | 28.2% ±2.0 |
| Pennsylvania | Neither | 279 | 2.14 | 23 | 20.9% ±1.6 | 30 | 23.1% ±3.5 |
| Idaho | Use more than build | 38 | 1.87 | 24 | 26.2% ±3.8 | 8 | 28.0% ±7.3 |
| Delaware | Use more than build | 19 | 1.79 | 25 | 29.4% ±3.9 | 3 | 27.1% ±6.3 |
| Kansas | Neither | 47 | 1.58 | 26 | 20.2% ±2.9 | 35 | 21.5% ±4.9 |
| Nevada | Use more than build | 50 | 1.52 | 27 | 26.0% ±2.6 | 9 | 26.3% ±4.5 |
| Montana | Neither | 14 | 1.22 | 28 | 21.5% ±4.1 | 26 | 22.0% ±8.8 |
| Missouri | Neither | 76 | 1.21 | 29 | 21.0% ±2.0 | 29 | 21.7% ±3.7 |
| Ohio | Neither | 142 | 1.19 | 30 | 20.9% ±1.3 | 30 | 21.4% ±2.5 |
| Wisconsin | Neither | 71 | 1.19 | 30 | 19.6% ±1.6 | 37 | 18.3% ±3.2 |
| Iowa | Neither | 38 | 1.17 | 32 | 19.9% ±2.5 | 36 | 17.0% ±4.3 |
| South Carolina | Use more than build | 65 | 1.17 | 32 | 24.4% ±2.5 | 16 | 23.3% ±3.5 |
| New Mexico | Neither | 20 | 0.94 | 34 | 19.3% ±2.3 | 39 | 19.7% ±3.9 |
| Indiana | Neither | 63 | 0.90 | 35 | 18.6% ±1.7 | 41 | 19.4% ±3.2 |
| Tennessee | Neither | 52 | 0.71 | 36 | 21.5% ±1.9 | 26 | 20.3% ±3.0 |
| Wyoming | Neither | 4 | 0.68 | 37 | 22.2% ±4.3 | 22 | 21.1% ±8.5 |
| Kentucky | Neither | 29 | 0.63 | 38 | 22.9% ±2.7 | 19 | 24.1% ±5.4 |
| Hawaii | Neither | 8 | 0.56 | 39 | 22.3% ±3.6 | 21 | 23.4% ±7.1 |
| Nebraska | Neither | 11 | 0.55 | 40 | 21.9% ±3.2 | 24 | 23.9% ±5.6 |
| South Dakota | Neither | 4 | 0.43 | 41 | 21.4% ±4.9 | 28 | 27.2% ±9.3 |
| Arkansas | Neither | 13 | 0.42 | 42 | 20.8% ±2.8 | 33 | 21.3% ±3.9 |
| Louisiana | Neither | 19 | 0.41 | 43 | 19.3% ±2.0 | 39 | 17.2% ±3.7 |
| Oklahoma | Neither | 16 | 0.39 | 44 | 18.2% ±2.2 | 42 | 17.9% ±3.9 |
| Alabama | Neither | 14 | 0.27 | 45 | 18.0% ±2.4 | 43 | 23.3% ±4.3 |
| West Virginia | Neither | 4 | 0.23 | 46 | 14.8% ±3.2 | 49 | 13.9% ±6.1 |
| Maine | Neither | 3 | 0.21 | 47 | 19.6% ±3.5 | 37 | 16.7% ±6.0 |
| Mississippi | Neither | 5 | 0.17 | 48 | 16.5% ±2.8 | 47 | 21.2% ±3.6 |
| Alaska | Neither | 0 | 0.00 | 49 | 15.2% ±3.8 | 48 | 15.0% ±7.7 |
| North Dakota | Not enough data | 10 | 1.25 | n/a | 23.3% ±8.7 | ||
| Rhode Island | Not enough data | 16 | 1.44 | n/a | n/a |
Sorted by AI patents per person. Ranks are among the 49 places with both numbers. Margins are 90% margins of error in percentage points, from Census standard errors. Patents: USPTO PatentsView, first-listed inventor’s state, Census Vintage 2025 population. Use: Census Business Trends and Outlook Survey, share of employer businesses that used AI in the last two weeks. Download the full table (CSV)
Your state in one line
- Alabama: Alabama is in neither group: #45 for AI patents per person (0.27 per 100,000) and #43 for business AI use (18.0%).
- Alaska: Alaska is in neither group: #49 for AI patents per person (0.00 per 100,000) and #48 for business AI use (15.2%).
- Arizona: Arizona's businesses use AI more than its inventors patent it: #10 for business AI use (25.8%), but #21 for AI patents per person (2.22 per 100,000).
- Arkansas: Arkansas is in neither group: #42 for AI patents per person (0.42 per 100,000) and #33 for business AI use (20.8%).
- California: California does both: #1 for AI patents per person (13.68 per 100,000) and #12 for business AI use (25.0%).
- Colorado: Colorado does both: #6 for AI patents per person (4.14 per 100,000) and #4 for business AI use (28.1%).
- Connecticut: Connecticut is in neither group: #18 for AI patents per person (2.41 per 100,000) and #44 for business AI use (17.6%).
- Delaware: Delaware's businesses use AI more than its inventors patent it: #3 for business AI use (29.4%), but #25 for AI patents per person (1.79 per 100,000).
- District of Columbia: District of Columbia does both: #4 for AI patents per person (7.78 per 100,000) and #2 for business AI use (30.7%).
- Florida: Florida's businesses use AI more than its inventors patent it: #5 for business AI use (27.4%), but #21 for AI patents per person (2.22 per 100,000).
- Georgia: Georgia's businesses use AI more than its inventors patent it: #7 for business AI use (26.4%), but #18 for AI patents per person (2.41 per 100,000).
- Hawaii: Hawaii is in neither group: #39 for AI patents per person (0.56 per 100,000) and #21 for business AI use (22.3%).
- Idaho: Idaho's businesses use AI more than its inventors patent it: #8 for business AI use (26.2%), but #24 for AI patents per person (1.87 per 100,000).
- Illinois: Illinois invents more AI than its businesses use: #9 for AI patents per person (3.55 per 100,000), but #30 for business AI use (20.9%).
- Indiana: Indiana is in neither group: #35 for AI patents per person (0.90 per 100,000) and #41 for business AI use (18.6%).
- Iowa: Iowa is in neither group: #32 for AI patents per person (1.17 per 100,000) and #36 for business AI use (19.9%).
- Kansas: Kansas is in neither group: #26 for AI patents per person (1.58 per 100,000) and #35 for business AI use (20.2%).
- Kentucky: Kentucky is in neither group: #38 for AI patents per person (0.63 per 100,000) and #19 for business AI use (22.9%).
- Louisiana: Louisiana is in neither group: #43 for AI patents per person (0.41 per 100,000) and #39 for business AI use (19.3%).
- Maine: Maine is in neither group: #47 for AI patents per person (0.21 per 100,000) and #37 for business AI use (19.6%).
- Maryland: Maryland's businesses use AI more than its inventors patent it: #18 for business AI use (23.4%), but #13 for AI patents per person (3.24 per 100,000).
- Massachusetts: Massachusetts invents more AI than its businesses use: #3 for AI patents per person (10.48 per 100,000), but #20 for business AI use (22.4%).
- Michigan: Michigan is in neither group: #11 for AI patents per person (3.30 per 100,000) and #25 for business AI use (21.8%).
- Minnesota: Minnesota's businesses use AI more than its inventors patent it: #14 for business AI use (24.9%), but #17 for AI patents per person (2.69 per 100,000).
- Mississippi: Mississippi is in neither group: #48 for AI patents per person (0.17 per 100,000) and #47 for business AI use (16.5%).
- Missouri: Missouri is in neither group: #29 for AI patents per person (1.21 per 100,000) and #29 for business AI use (21.0%).
- Montana: Montana is in neither group: #28 for AI patents per person (1.22 per 100,000) and #26 for business AI use (21.5%).
- Nebraska: Nebraska is in neither group: #40 for AI patents per person (0.55 per 100,000) and #24 for business AI use (21.9%).
- Nevada: Nevada's businesses use AI more than its inventors patent it: #9 for business AI use (26.0%), but #27 for AI patents per person (1.52 per 100,000).
- New Hampshire: New Hampshire is in neither group: #12 for AI patents per person (3.25 per 100,000) and #33 for business AI use (20.8%).
- New Jersey: New Jersey invents more AI than its businesses use: #7 for AI patents per person (4.03 per 100,000), but #45 for business AI use (17.5%).
- New Mexico: New Mexico is in neither group: #34 for AI patents per person (0.94 per 100,000) and #39 for business AI use (19.3%).
- New York: New York invents more AI than its businesses use: #10 for AI patents per person (3.51 per 100,000), but #46 for business AI use (17.2%).
- North Carolina: North Carolina's businesses use AI more than its inventors patent it: #15 for business AI use (24.5%), but #16 for AI patents per person (2.70 per 100,000).
- North Dakota: North Dakota got 1.25 AI patents per 100,000 residents in 2025. Census didn't publish a business AI-use figure for all three recent surveys, so we can't place it. In the latest survey, 23.3% of its businesses used AI (±8.7 points).
- Ohio: Ohio is in neither group: #30 for AI patents per person (1.19 per 100,000) and #30 for business AI use (20.9%).
- Oklahoma: Oklahoma is in neither group: #44 for AI patents per person (0.39 per 100,000) and #42 for business AI use (18.2%).
- Oregon: Oregon does both: #5 for AI patents per person (4.28 per 100,000) and #16 for business AI use (24.4%).
- Pennsylvania: Pennsylvania is in neither group: #23 for AI patents per person (2.14 per 100,000) and #30 for business AI use (20.9%).
- Rhode Island: Rhode Island got 1.44 AI patents per 100,000 residents in 2025. Census didn't publish a business AI-use figure for it, so it isn't on the chart.
- South Carolina: South Carolina's businesses use AI more than its inventors patent it: #16 for business AI use (24.4%), but #32 for AI patents per person (1.17 per 100,000).
- South Dakota: South Dakota is in neither group: #41 for AI patents per person (0.43 per 100,000) and #28 for business AI use (21.4%).
- Tennessee: Tennessee is in neither group: #36 for AI patents per person (0.71 per 100,000) and #26 for business AI use (21.5%).
- Texas: Texas's businesses use AI more than its inventors patent it: #12 for business AI use (25.0%), but #15 for AI patents per person (2.84 per 100,000).
- Utah: Utah's businesses use AI more than its inventors patent it: #1 for business AI use (30.9%), but #14 for AI patents per person (3.16 per 100,000).
- Vermont: Vermont is in neither group: #20 for AI patents per person (2.33 per 100,000) and #23 for business AI use (22.0%).
- Virginia: Virginia does both: #8 for AI patents per person (3.87 per 100,000) and #11 for business AI use (25.1%).
- Washington: Washington does both: #2 for AI patents per person (12.50 per 100,000) and #6 for business AI use (26.9%).
- West Virginia: West Virginia is in neither group: #46 for AI patents per person (0.23 per 100,000) and #49 for business AI use (14.8%).
- Wisconsin: Wisconsin is in neither group: #30 for AI patents per person (1.19 per 100,000) and #37 for business AI use (19.6%).
- Wyoming: Wyoming is in neither group: #37 for AI patents per person (0.68 per 100,000) and #22 for business AI use (22.2%).
What this means for a small business
- You don’t need to be near AI inventors to use AI. Some of the states with the most businesses using AI, like Utah, Delaware and Florida, aren’t top AI-patent states. The tools are sold online and work the same everywhere.
- Your competitors may be ahead of your state’s reputation. In the top-use states, more than 1 in 4 businesses already use AI. See how your state and industry compare in small-business AI use by state and AI use by industry.
- Know the rules where you operate. Several states now have laws on AI in hiring, chatbots and pricing. Check AI laws by state before you add AI to how you hire or talk to customers.
- If you build your own AI tool, small businesses get lower patent fees. Small entities file about 1 in 4 AI patent applications. See small businesses’ share of AI patents.
- Still choosing where to start? Compare the best states to start a business and LLC costs by state.
Methods and caveats
- Two different groups. The patent number counts inventors: AI patents granted in 2025, credited to the state where the first-listed inventor lives. The use number counts businesses: the share of employer businesses in the state that said they used AI in the last two weeks. An inventor at a big company and a local shop owner are very different people.
- Two different time periods. Patents granted in 2025 mostly reflect ideas filed two to three years earlier. The AI-use figure is from three Census surveys covering July 27 to September 6, 2026 (2026-07-27 to 2026-09-06).
- What counts as an AI patent. A U.S. utility patent with at least one current patent class in G06N (machine learning and neural networks), G06F40 (language processing), G06V (image and video recognition) or G10L15 (speech recognition). Source: USPTO PatentsView, grants through December 31, 2025 (file released April 10, 2026). Rate uses Census Vintage 2025 population.
- Business AI use. Census Business Trends and Outlook Survey (BTOS), question on AI use in the last two weeks. We average the three latest surveys because single-survey state numbers jump around. The margin of error for the average comes from Census standard errors and assumes the three surveys are independent. The latest single survey is in the table too.
- Groups. “Build” = top 10 for AI patents per person (3.51 or more per 100,000). “Use” = at or above the U.S. figure (23.1%, average of the same three surveys). 18 states are within the margin of error of the use line.
- Correlation. Pearson correlation across the 49 places with both numbers (48 states and D.C.). Rhode Island (not published by Census) and North Dakota (missing a survey) are left out. A correlation describes how two numbers move together. It does not show cause.
Cite or share this data
Free to use with credit: “Source: StartBusinessByState.com analysis of USPTO and Census data.” Please link to this page. Download the state table (CSV)
More AI data: AI patents by state, small businesses’ share of AI patents, the generative AI patent tracker, small-business AI use by state, AI-proof jobs by state and AI in annual reports.
FAQ
What does r = 0.42 mean?
It measures how closely two numbers move together, from 0 (no link) to 1 (a perfect line). At 0.42, states with more AI patents per person tend to have somewhat more businesses using AI, but there are many exceptions. Only about 18% of the state-to-state differences in AI use line up with patents.
Do AI patents cause businesses to use AI?
This data can't tell you that. The two numbers are only moderately linked, and many other things differ between states, like which industries are there and how big the businesses are.
Why compare patents with AI use at all?
They measure two different things: where AI tools get invented and where businesses actually use them. Putting them side by side shows that you don't need to live in an AI-inventing state to run a business that uses AI.
Why are Rhode Island and North Dakota missing from the chart?
Census didn't publish a business AI-use figure for Rhode Island, and North Dakota is missing one of the three recent surveys we average. Both are in the table and the CSV with their patent numbers.
What counts as an AI patent?
A U.S. utility patent granted in 2025 with at least one patent class for machine learning (G06N), language processing (G06F40), image and video recognition (G06V) or speech recognition (G10L15). We count the state where the first-listed inventor lives.
What counts as using AI?
The Census Business Trends and Outlook Survey asks businesses with employees whether they used AI to produce goods or services in the last two weeks. Examples include machine learning, language processing, virtual agents (chatbots) and voice recognition.
Can I use these numbers and charts?
Yes. Please credit StartBusinessByState.com and link to this page. The full state table is free to download as a CSV.