National Mortgage Database through Q2 2026 (latest two quarters preliminary) · Updated by StartBusinessByState
Short answer: Late mortgage payments are rising again, from low levels. The share of loans 90 or more days late reached 1.1% in Q1 2026, the highest since Q4 2017, but still far below the 4.6% peak in Q4 2009. The increase is concentrated in government-backed loans. This page shows late-payment and foreclosure rates for every state and the 100 largest metro areas, and how they changed over the past year.
Key facts for reporters
- U.S., Q2 2026: 1.7% of first-lien mortgages were 30–89 days late, 1.0% were 90+ days late and 0.2% were in foreclosure, bankruptcy or deed-in-lieu. A year earlier: 1.6%, 0.8% and 0.1% (FHFA/CFPB National Mortgage Database).
- Government-backed loans (FHA, VA, USDA): 2.8% were 90+ days late, up from 1.9% a year earlier. Loans bought by Fannie Mae and Freddie Mac: 0.3%.
- Highest serious delinquency (90+ days or foreclosure): Louisiana (2.6%), Mississippi (2.2%), Florida (1.7%), Georgia (1.7%), Oklahoma (1.7%). Lowest: Wisconsin (0.6%), California (0.7%), Idaho (0.7%), New Hampshire (0.7%).
- Largest one-year increases: Rhode Island (+0.8 points), Florida (+0.6 points), Georgia (+0.6 points), Maryland (+0.6 points), Louisiana (+0.5 points). The serious rate rose in 50 states, held steady in 1 and fell in 0.
- Among the 100 largest metro areas, the serious rate rose in 94. Highest: Lakeland-Winter Haven, FL (3.2%), Baton Rouge, LA (2.9%), New Orleans-Metairie, LA (2.6%).
- The two most recent quarters are preliminary, and NMDB says early estimates of delinquency tend to be revised down.
The national picture
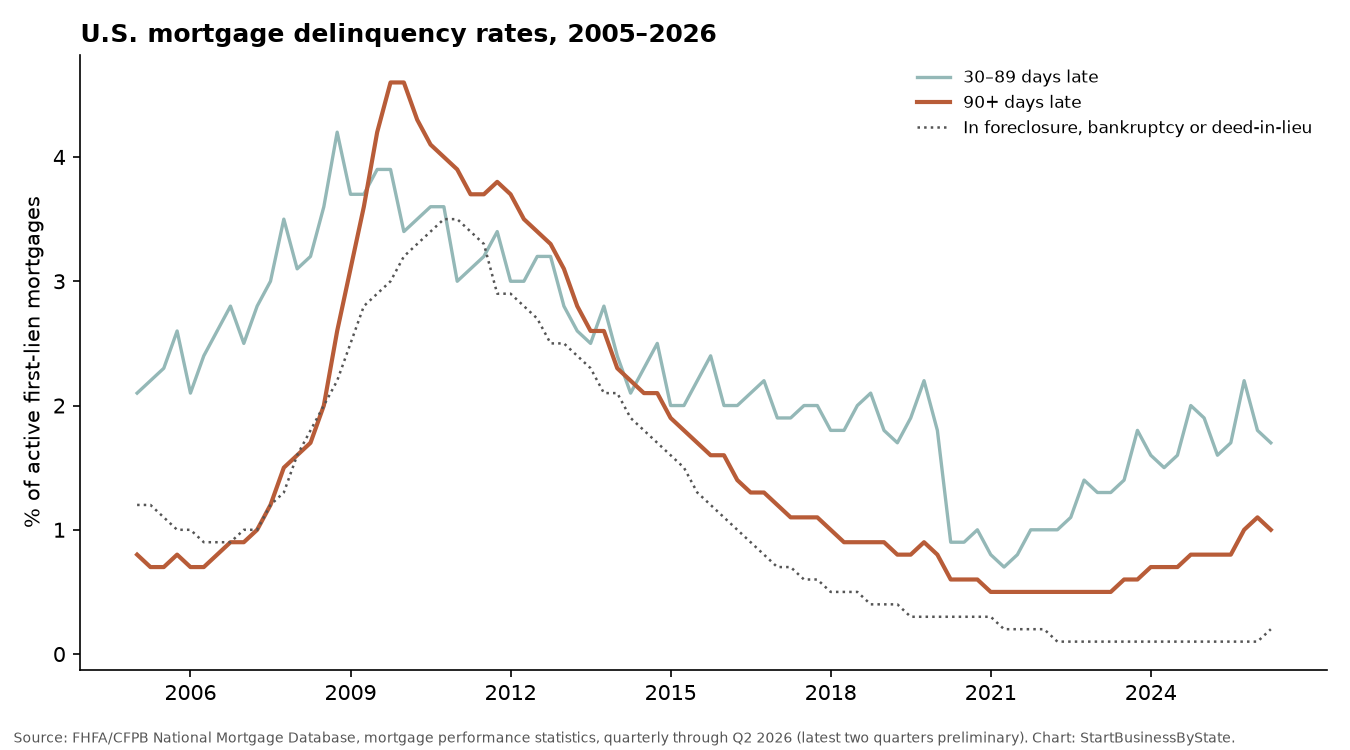
Late payments fell to record lows after 2020, a period that also brought a refinancing wave, rising home prices and pandemic forbearance (loans in forbearance were reported as current). The 90+ day rate bottomed at 0.5% in Q1 2021. Compared with the same quarter of 2019, the 90+ day rate is now higher (1.0% vs 0.8%), the 30–89 day rate is the same (1.7% vs 1.7%), and the foreclosure rate is lower (0.2% vs 0.4%).
Things that can push late payments up include job losses, higher property tax and insurance bills that raise monthly escrow payments, larger payments on loans taken out at today’s rates, and natural disasters. The data on this page measures late payments; it doesn’t record why a borrower fell behind.
Seriously delinquent mortgages by state
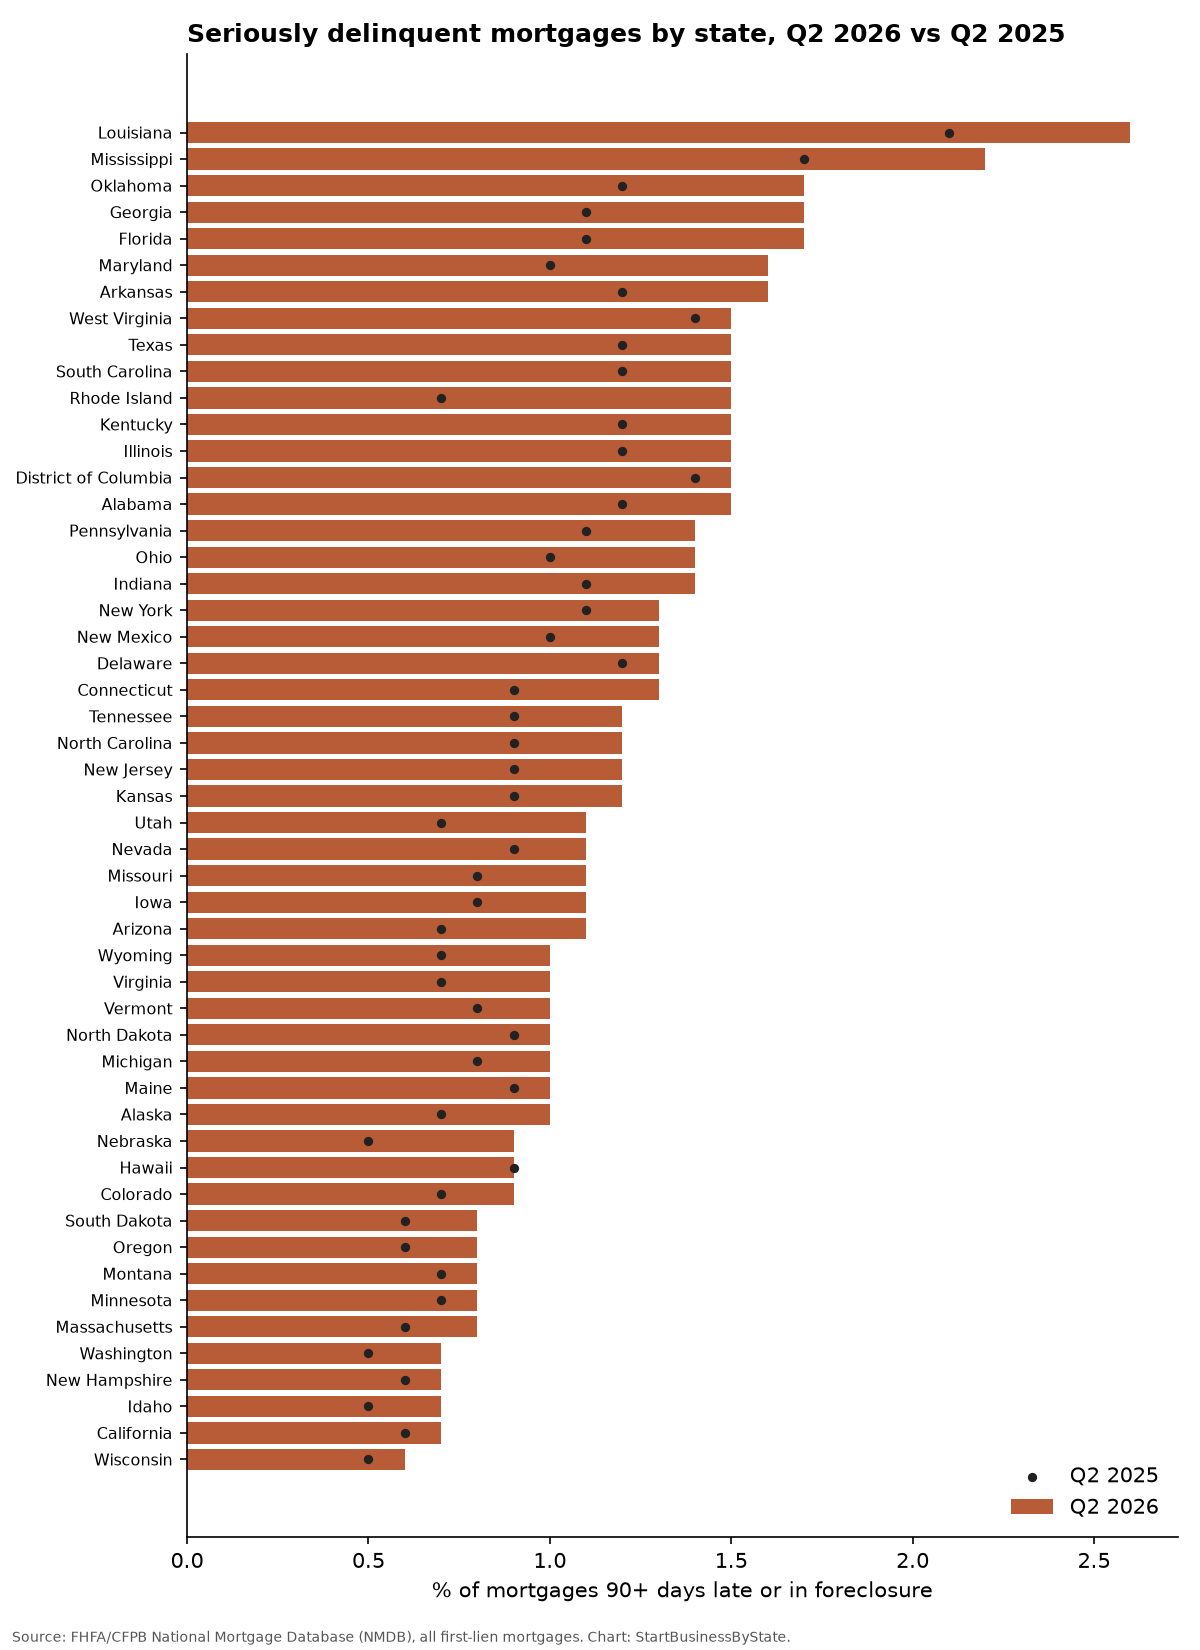
- Louisiana: 2.6% (a year earlier: 2.1%)
- Mississippi: 2.2% (a year earlier: 1.7%)
- Florida: 1.7% (a year earlier: 1.1%)
- Georgia: 1.7% (a year earlier: 1.1%)
- Oklahoma: 1.7% (a year earlier: 1.2%)
- Arkansas: 1.6% (a year earlier: 1.2%)
- Maryland: 1.6% (a year earlier: 1.0%)
- Alabama: 1.5% (a year earlier: 1.2%)
- District of Columbia: 1.5% (a year earlier: 1.4%)
- Illinois: 1.5% (a year earlier: 1.2%)
NMDB rounds rates to one decimal place, so several states often share a value, and small changes are within rounding. Southern states such as Louisiana, Mississippi, Florida, Georgia, Oklahoma, Arkansas have long had higher rates than the West Coast. Those regional gaps existed before the recent rise.
Government-backed loans are driving the increase
NMDB splits loans into three markets. Of conventional loans bought by Fannie Mae and Freddie Mac, only 0.4% were seriously delinquent. Government-backed loans (FHA, VA and USDA), whose programs allow small or no down payments: 3.2% were seriously delinquent, up from 2.1% a year earlier. Other conventional loans, mostly held by banks, were at 1.2%.
Among government-backed loans, the 90+ day rate was highest in District of Columbia (5.7%), Rhode Island (4.2%), Illinois (4.0%), Louisiana (4.0%).
The 100 largest metro areas
Highest serious delinquency: Lakeland-Winter Haven, FL (3.2%), Baton Rouge, LA (2.9%), New Orleans-Metairie, LA (2.6%), Washington, DC-MD (MSAD) (2.4%), McAllen-Edinburg-Mission, TX (2.2%). Lowest: San Jose-Sunnyvale-Santa Clara, CA (0.2%), San Francisco-San Mateo-Redwood City, CA (MSAD) (0.3%), Anaheim-Santa Ana-Irvine, CA (MSAD) (0.4%), Everett, WA (MSAD) (0.4%). Largest increases: Lakeland-Winter Haven, FL (+1.2), Baton Rouge, LA (+0.9), Washington, DC-MD (MSAD) (+0.8), Atlanta-Sandy Springs-Roswell, GA (MSAD) (+0.7). (MSAD = metropolitan division, part of a larger metro.)
| Metro area | 90+ days or foreclosure, Q2 2026 | Q2 2025 | Change (points) | 30–89 days late | Government loans 90+ days |
|---|---|---|---|---|---|
| Lakeland-Winter Haven, FL | 3.2% | 2.0% | +1.2 | 2.8% | 4.8% |
| Baton Rouge, LA | 2.9% | 2.0% | +0.9 | 3.7% | 4.7% |
| New Orleans-Metairie, LA | 2.6% | 2.1% | +0.5 | 3.4% | 4.6% |
| Washington, DC-MD (MSAD) | 2.4% | 1.6% | +0.8 | 2.0% | 5.0% |
| McAllen-Edinburg-Mission, TX | 2.2% | 1.6% | +0.6 | 4.4% | 2.6% |
| Camden, NJ (MSAD) | 2.1% | 1.5% | +0.6 | 2.5% | 4.6% |
| Columbia, SC | 2.1% | 1.6% | +0.5 | 2.9% | 3.4% |
| Philadelphia, PA (MSAD) | 2.1% | 1.5% | +0.6 | 2.7% | 4.8% |
| Atlanta-Sandy Springs-Roswell, GA (MSAD) | 1.9% | 1.2% | +0.7 | 2.4% | 4.6% |
| Memphis, TN-MS-AR | 1.9% | 1.5% | +0.4 | 2.4% | 3.0% |
| Tampa, FL (MSAD) | 1.9% | 1.2% | +0.7 | 1.8% | 3.6% |
| Cape Coral-Fort Myers, FL | 1.8% | 1.1% | +0.7 | 2.2% | 3.6% |
| Detroit-Dearborn-Livonia, MI (MSAD) | 1.7% | 1.1% | +0.6 | 2.5% | 4.2% |
| El Paso, TX | 1.7% | 1.1% | +0.6 | 2.6% | 2.4% |
| Houston-Pasadena-The Woodlands, TX | 1.7% | 1.3% | +0.4 | 2.4% | 3.4% |
| Bakersfield-Delano, CA | 1.6% | 1.3% | +0.3 | 2.3% | 2.8% |
| Baltimore-Columbia-Towson, MD | 1.6% | 1.1% | +0.5 | 2.0% | 3.7% |
| Birmingham, AL | 1.6% | 1.2% | +0.4 | 2.6% | 2.9% |
| Cleveland, OH | 1.6% | 1.1% | +0.5 | 1.7% | 3.8% |
| Jacksonville, FL | 1.6% | 1.2% | +0.4 | 1.9% | 2.6% |
| Orlando-Kissimmee-Sanford, FL | 1.6% | 1.0% | +0.6 | 1.7% | 3.1% |
| San Antonio-New Braunfels, TX | 1.6% | 1.2% | +0.4 | 2.5% | 2.4% |
| Chicago-Naperville-Elgin, IL-IN (MSAD) | 1.5% | 1.1% | +0.4 | 1.5% | 4.9% |
| Fort Lauderdale-Pompano Beach-Sunrise, FL (MSAD) | 1.5% | 1.2% | +0.3 | 1.9% | 3.2% |
| Little Rock-North Little Rock-Conway, AR | 1.5% | 1.1% | +0.4 | 2.5% | 2.3% |
| Miami-Miami Beach-Kendall, FL (MSAD) | 1.5% | 1.2% | +0.3 | 1.7% | 3.4% |
| Oklahoma City, OK | 1.5% | 0.9% | +0.6 | 2.0% | 2.5% |
| Allentown-Bethlehem-Easton, PA-NJ | 1.4% | 1.1% | +0.3 | 2.1% | 3.6% |
| Buffalo-Cheektowaga, NY | 1.4% | 1.0% | +0.4 | 1.5% | 2.6% |
| Charleston-North Charleston, SC | 1.4% | 0.9% | +0.5 | 2.1% | 2.7% |
| Dayton-Kettering-Beavercreek, OH | 1.4% | 1.0% | +0.4 | 1.9% | 2.3% |
| Elgin, IL (MSAD) | 1.4% | 1.1% | +0.3 | 1.7% | 3.4% |
| Fort Worth-Arlington-Grapevine, TX (MSAD) | 1.4% | 1.0% | +0.4 | 2.1% | 3.3% |
| Marietta, GA (MSAD) | 1.4% | 0.9% | +0.5 | 1.9% | 3.1% |
| Pittsburgh, PA | 1.4% | 1.1% | +0.3 | 1.8% | 3.0% |
| Providence-Warwick, RI-MA | 1.4% | 0.8% | +0.6 | 1.8% | 4.3% |
| Tulsa, OK | 1.4% | 0.9% | +0.5 | 1.9% | 2.7% |
| Wilmington, DE-MD-NJ (MSAD) | 1.4% | 1.1% | +0.3 | 2.2% | 2.8% |
| Dallas-Plano-Irving, TX (MSAD) | 1.3% | 0.9% | +0.4 | 1.7% | 3.1% |
| Greenville-Anderson-Greer, SC | 1.3% | 1.0% | +0.3 | 2.1% | 2.7% |
| Hartford-West Hartford-East Hartford, CT | 1.3% | 0.9% | +0.4 | 1.7% | 3.9% |
| Indianapolis-Carmel-Greenwood, IN | 1.3% | 0.9% | +0.4 | 1.8% | 2.8% |
| Louisville/Jefferson County, KY-IN | 1.3% | 1.0% | +0.3 | 1.7% | 2.4% |
| Rochester, NY | 1.3% | 0.8% | +0.5 | 1.9% | 2.9% |
| Virginia Beach-Chesapeake-Norfolk, VA-NC | 1.3% | 0.9% | +0.4 | 2.0% | 2.0% |
| Albany-Schenectady-Troy, NY | 1.2% | 0.9% | +0.3 | 1.3% | 2.6% |
| Cincinnati, OH-KY-IN | 1.2% | 0.9% | +0.3 | 1.5% | 2.9% |
| Fresno, CA | 1.2% | 0.9% | +0.3 | 2.1% | 2.6% |
| Greensboro-High Point, NC | 1.2% | 0.9% | +0.3 | 2.3% | 2.6% |
| Kansas City, MO-KS | 1.2% | 0.9% | +0.3 | 1.7% | 2.8% |
| Las Vegas-Henderson-North Las Vegas, NV | 1.2% | 0.9% | +0.3 | 1.3% | 2.8% |
| Nassau County-Suffolk County, NY (MSAD) | 1.2% | 1.1% | +0.1 | 1.5% | 3.6% |
| Richmond, VA | 1.2% | 0.9% | +0.3 | 1.6% | 2.7% |
| Riverside-San Bernardino-Ontario, CA | 1.2% | 0.9% | +0.3 | 2.0% | 2.9% |
| St. Louis, MO-IL | 1.2% | 0.7% | +0.5 | 1.9% | 3.2% |
| Tucson, AZ | 1.2% | 0.8% | +0.4 | 1.6% | 2.7% |
| West Palm Beach-Boca Raton-Delray Beach, FL (MSAD) | 1.2% | 0.9% | +0.3 | 1.4% | 2.7% |
| Albuquerque, NM | 1.1% | 0.7% | +0.4 | 1.7% | 1.9% |
| Charlotte-Concord-Gastonia, NC-SC | 1.1% | 0.8% | +0.3 | 1.8% | 2.6% |
| Knoxville, TN | 1.1% | 0.7% | +0.4 | 1.4% | 2.5% |
| New York-Jersey City-White Plains, NY-NJ (MSAD) | 1.1% | 1.0% | +0.1 | 1.0% | 3.0% |
| Newark, NJ (MSAD) | 1.1% | 0.9% | +0.2 | 1.3% | 3.2% |
| Omaha, NE-IA | 1.1% | 0.7% | +0.4 | 1.4% | 2.8% |
| Phoenix-Mesa-Chandler, AZ | 1.1% | 0.7% | +0.4 | 1.5% | 2.8% |
| St. Petersburg-Clearwater-Largo, FL (MSAD) | 1.1% | 0.9% | +0.2 | 1.2% | 2.0% |
| Columbus, OH | 1.0% | 0.7% | +0.3 | 1.4% | 2.4% |
| North Port-Bradenton-Sarasota, FL | 1.0% | 0.7% | +0.3 | 1.0% | 2.6% |
| Salt Lake City-Murray, UT | 1.0% | 0.6% | +0.4 | 1.1% | 3.8% |
| Stockton-Lodi, CA | 1.0% | 0.7% | +0.3 | 1.8% | 2.4% |
| Worcester, MA | 1.0% | 0.8% | +0.2 | 1.6% | 3.2% |
| Austin-Round Rock-San Marcos, TX | 0.9% | 0.7% | +0.2 | 1.3% | 2.3% |
| Colorado Springs, CO | 0.9% | 0.9% | +0.0 | 1.4% | 1.4% |
| Nashville-Davidson–Murfreesboro–Franklin, TN | 0.9% | 0.6% | +0.3 | 1.4% | 2.1% |
| Raleigh-Cary, NC | 0.9% | 0.6% | +0.3 | 1.3% | 2.1% |
| Tacoma-Lakewood, WA (MSAD) | 0.9% | 1.0% | -0.1 | 0.8% | 1.6% |
| Warren-Troy-Farmington Hills, MI (MSAD) | 0.9% | 0.8% | +0.1 | 1.5% | 3.1% |
| Bridgeport-Stamford-Danbury, CT | 0.8% | 0.6% | +0.2 | 1.2% | 3.3% |
| Denver-Aurora-Centennial, CO | 0.8% | 0.6% | +0.2 | 1.1% | 3.0% |
| Lakewood-New Brunswick, NJ (MSAD) | 0.8% | 0.6% | +0.2 | 1.2% | 3.1% |
| Minneapolis-St. Paul-Bloomington, MN-WI | 0.8% | 0.6% | +0.2 | 1.1% | 3.1% |
| Urban Honolulu, HI | 0.8% | 0.9% | -0.1 | 0.5% | 1.5% |
| Boston, MA (MSAD) | 0.7% | 0.5% | +0.2 | 1.1% | 3.1% |
| Los Angeles-Long Beach-Glendale, CA (MSAD) | 0.7% | 0.6% | +0.1 | 1.0% | 2.6% |
| Milwaukee-Waukesha, WI | 0.7% | 0.5% | +0.2 | 1.2% | 2.6% |
| Montgomery County-Bucks County-Chester County, PA (MSAD) | 0.7% | 0.6% | +0.1 | 1.1% | 3.2% |
| Portland-Vancouver-Hillsboro, OR-WA | 0.7% | 0.6% | +0.1 | 0.7% | 2.1% |
| Sacramento-Roseville-Folsom, CA | 0.7% | 0.4% | +0.3 | 1.0% | 2.5% |
| Arlington-Alexandria-Reston, VA-WV (MSAD) | 0.6% | 0.4% | +0.2 | 0.9% | 1.7% |
| Boise City, ID | 0.6% | 0.5% | +0.1 | 1.1% | 2.1% |
| Frederick-Gaithersburg-Bethesda, MD (MSAD) | 0.6% | 0.5% | +0.1 | 0.8% | 2.3% |
| Grand Rapids-Wyoming-Kentwood, MI | 0.6% | 0.5% | +0.1 | 1.4% | 2.0% |
| Oakland-Fremont-Berkeley, CA (MSAD) | 0.6% | 0.4% | +0.2 | 0.6% | 3.5% |
| Cambridge-Newton-Framingham, MA (MSAD) | 0.5% | 0.3% | +0.2 | 0.8% | 2.5% |
| Oxnard-Thousand Oaks-Ventura, CA | 0.5% | 0.4% | +0.1 | 1.0% | 1.4% |
| San Diego-Chula Vista-Carlsbad, CA | 0.5% | 0.4% | +0.1 | 0.6% | 1.4% |
| Anaheim-Santa Ana-Irvine, CA (MSAD) | 0.4% | 0.3% | +0.1 | 0.5% | 1.4% |
| Everett, WA (MSAD) | 0.4% | 0.4% | +0.0 | 0.5% | 2.1% |
| Seattle-Bellevue-Kent, WA (MSAD) | 0.4% | 0.4% | +0.0 | 0.3% | 1.5% |
| San Francisco-San Mateo-Redwood City, CA (MSAD) | 0.3% | 0.1% | +0.2 | 0.4% | n/a |
| San Jose-Sunnyvale-Santa Clara, CA | 0.2% | 0.2% | +0.0 | 0.4% | 2.4% |
Mortgage delinquency by state
| State | 90+ days or foreclosure, Q2 2026 | Q2 2025 | Change (points) | Q4 2019 | 30–89 days late | 90+ days late | In foreclosure | Government loans 90+ days | Fannie/Freddie loans 90+ days | In forbearance |
|---|---|---|---|---|---|---|---|---|---|---|
| U.S. | 1.2% | 0.9% | +0.3 | 1.2% | 1.7% | 1.0% | 0.2% | 2.8% | 0.3% | 0.5% |
| Alabama | 1.5% | 1.2% | +0.3 | 2.0% | 2.6% | 1.2% | 0.3% | 2.4% | 0.2% | 0.4% |
| Alaska | 1.0% | 0.7% | +0.3 | 0.8% | 1.4% | 0.9% | 0.1% | 1.7% | 0.2% | 0.4% |
| Arizona | 1.1% | 0.7% | +0.4 | 0.7% | 1.5% | 1.0% | 0.1% | 2.7% | 0.3% | 0.3% |
| Arkansas | 1.6% | 1.2% | +0.4 | 1.6% | 2.3% | 1.2% | 0.4% | 2.5% | 0.3% | 0.5% |
| California | 0.7% | 0.6% | +0.1 | 0.6% | 1.1% | 0.6% | 0.1% | 2.4% | 0.3% | 0.3% |
| Colorado | 0.9% | 0.7% | +0.2 | 0.5% | 1.2% | 0.8% | 0.1% | 2.6% | 0.2% | 0.3% |
| Connecticut | 1.3% | 0.9% | +0.4 | 1.7% | 1.7% | 1.1% | 0.2% | 3.8% | 0.4% | 0.4% |
| Delaware | 1.3% | 1.2% | +0.1 | 1.6% | 2.1% | 1.1% | 0.2% | 2.6% | 0.4% | 0.5% |
| District of Columbia | 1.5% | 1.4% | +0.1 | 1.1% | 1.0% | 1.2% | 0.3% | 5.7% | 0.7% | 0.5% |
| Florida | 1.7% | 1.1% | +0.6 | 1.3% | 1.8% | 1.4% | 0.3% | 3.1% | 0.5% | 0.5% |
| Georgia | 1.7% | 1.1% | +0.6 | 1.5% | 2.3% | 1.6% | 0.1% | 3.5% | 0.4% | 0.7% |
| Hawaii | 0.9% | 0.9% | +0.0 | 0.9% | 0.6% | 0.6% | 0.3% | 1.6% | 0.3% | 2.6% |
| Idaho | 0.7% | 0.5% | +0.2 | 0.6% | 1.3% | 0.7% | 0.0% | 2.1% | 0.3% | 0.2% |
| Illinois | 1.5% | 1.2% | +0.3 | 1.5% | 1.7% | 1.2% | 0.3% | 4.0% | 0.4% | 0.4% |
| Indiana | 1.4% | 1.1% | +0.3 | 1.4% | 2.1% | 1.1% | 0.3% | 3.0% | 0.3% | 0.4% |
| Iowa | 1.1% | 0.8% | +0.3 | 1.0% | 1.4% | 0.9% | 0.2% | 3.2% | 0.4% | 0.3% |
| Kansas | 1.2% | 0.9% | +0.3 | 1.1% | 1.6% | 1.0% | 0.2% | 2.5% | 0.4% | 0.3% |
| Kentucky | 1.5% | 1.2% | +0.3 | 1.8% | 1.9% | 1.0% | 0.5% | 2.3% | 0.3% | 0.3% |
| Louisiana | 2.6% | 2.1% | +0.5 | 2.2% | 3.4% | 2.1% | 0.5% | 4.0% | 0.6% | 1.4% |
| Maine | 1.0% | 0.9% | +0.1 | 1.6% | 1.7% | 0.7% | 0.3% | 2.0% | 0.2% | 0.2% |
| Maryland | 1.6% | 1.0% | +0.6 | 1.6% | 1.9% | 1.4% | 0.2% | 3.7% | 0.3% | 0.7% |
| Massachusetts | 0.8% | 0.6% | +0.2 | 1.0% | 1.2% | 0.7% | 0.1% | 3.3% | 0.3% | 0.3% |
| Michigan | 1.0% | 0.8% | +0.2 | 0.9% | 1.8% | 0.9% | 0.1% | 3.1% | 0.3% | 0.7% |
| Minnesota | 0.8% | 0.7% | +0.1 | 0.8% | 1.2% | 0.7% | 0.1% | 3.0% | 0.2% | 0.3% |
| Mississippi | 2.2% | 1.7% | +0.5 | 2.1% | 3.3% | 1.8% | 0.4% | 2.9% | 0.6% | 1.3% |
| Missouri | 1.1% | 0.8% | +0.3 | 1.1% | 1.8% | 1.0% | 0.1% | 2.6% | 0.3% | 0.4% |
| Montana | 0.8% | 0.7% | +0.1 | 0.9% | 1.1% | 0.7% | 0.1% | 1.7% | 0.3% | 0.5% |
| Nebraska | 0.9% | 0.5% | +0.4 | 0.7% | 1.4% | 0.8% | 0.1% | 2.3% | 0.3% | 0.2% |
| Nevada | 1.1% | 0.9% | +0.2 | 0.8% | 1.2% | 1.0% | 0.1% | 2.6% | 0.3% | 0.4% |
| New Hampshire | 0.7% | 0.6% | +0.1 | 0.8% | 1.1% | 0.6% | 0.1% | 2.4% | 0.2% | 0.3% |
| New Jersey | 1.2% | 0.9% | +0.3 | 1.7% | 1.5% | 1.0% | 0.2% | 3.6% | 0.3% | 0.4% |
| New Mexico | 1.3% | 1.0% | +0.3 | 1.2% | 2.0% | 1.0% | 0.3% | 2.0% | 0.3% | 0.6% |
| New York | 1.3% | 1.1% | +0.2 | 1.6% | 1.3% | 1.0% | 0.3% | 3.0% | 0.4% | 0.3% |
| North Carolina | 1.2% | 0.9% | +0.3 | 1.4% | 1.8% | 1.0% | 0.2% | 2.3% | 0.3% | 0.4% |
| North Dakota | 1.0% | 0.9% | +0.1 | 0.8% | 1.2% | 0.9% | 0.1% | 2.3% | 0.3% | 0.1% |
| Ohio | 1.4% | 1.0% | +0.4 | 1.3% | 1.8% | 1.1% | 0.3% | 2.9% | 0.4% | 0.3% |
| Oklahoma | 1.7% | 1.2% | +0.5 | 1.7% | 2.1% | 1.3% | 0.4% | 2.5% | 0.4% | 0.4% |
| Oregon | 0.8% | 0.6% | +0.2 | 0.6% | 0.9% | 0.7% | 0.1% | 2.3% | 0.3% | 0.3% |
| Pennsylvania | 1.4% | 1.1% | +0.3 | 1.6% | 2.0% | 1.1% | 0.3% | 3.2% | 0.3% | 0.4% |
| Rhode Island | 1.5% | 0.7% | +0.8 | 1.3% | 1.8% | 1.4% | 0.1% | 4.2% | 0.4% | 0.4% |
| South Carolina | 1.5% | 1.2% | +0.3 | 1.7% | 2.4% | 1.2% | 0.3% | 2.9% | 0.3% | 0.6% |
| South Dakota | 0.8% | 0.6% | +0.2 | 0.8% | 1.5% | 0.7% | 0.1% | 2.3% | 0.2% | 0.3% |
| Tennessee | 1.2% | 0.9% | +0.3 | 1.4% | 1.7% | 1.0% | 0.2% | 2.2% | 0.3% | 1.3% |
| Texas | 1.5% | 1.2% | +0.3 | 1.1% | 2.3% | 1.3% | 0.2% | 2.9% | 0.4% | 0.6% |
| Utah | 1.1% | 0.7% | +0.4 | 0.7% | 1.2% | 1.0% | 0.1% | 3.5% | 0.3% | 0.3% |
| Vermont | 1.0% | 0.8% | +0.2 | 1.4% | 1.0% | 0.7% | 0.3% | 3.0% | 0.4% | 0.3% |
| Virginia | 1.0% | 0.7% | +0.3 | 1.1% | 1.5% | 0.9% | 0.1% | 2.1% | 0.2% | 0.4% |
| Washington | 0.7% | 0.5% | +0.2 | 0.6% | 0.7% | 0.6% | 0.1% | 1.9% | 0.2% | 1.2% |
| West Virginia | 1.5% | 1.4% | +0.1 | 2.1% | 3.0% | 1.1% | 0.4% | 1.9% | 0.4% | 0.6% |
| Wisconsin | 0.6% | 0.5% | +0.1 | 0.8% | 1.1% | 0.5% | 0.1% | 2.2% | 0.2% | 0.9% |
| Wyoming | 1.0% | 0.7% | +0.3 | 0.9% | 2.4% | 0.9% | 0.1% | 2.1% | 0.2% | 0.2% |
State-by-state takeaways
Alabama
In Q2 2026, 1.5% of Alabama mortgages were 90 or more days late or in foreclosure (rank 8 of 51, where 1 is highest; U.S. 1.2%), up 0.3 points from 1.2% a year earlier. Another 2.6% were 30 to 89 days late (U.S. 1.7%). Before the pandemic (Q4 2019) the serious rate was 2.0%. Among government-backed loans (FHA, VA, USDA), 2.4% were 90+ days late, vs 0.2% of loans bought by Fannie Mae and Freddie Mac. 0.4% of loans were in forbearance.
Alaska
In Q2 2026, 1.0% of Alaska mortgages were 90 or more days late or in foreclosure (rank 32 of 51, where 1 is highest; U.S. 1.2%), up 0.3 points from 0.7% a year earlier. Another 1.4% were 30 to 89 days late (U.S. 1.7%). Before the pandemic (Q4 2019) the serious rate was 0.8%. Among government-backed loans (FHA, VA, USDA), 1.7% were 90+ days late, vs 0.2% of loans bought by Fannie Mae and Freddie Mac. 0.4% of loans were in forbearance.
Arizona
In Q2 2026, 1.1% of Arizona mortgages were 90 or more days late or in foreclosure (rank 27 of 51, where 1 is highest; U.S. 1.2%), up 0.4 points from 0.7% a year earlier. Another 1.5% were 30 to 89 days late (U.S. 1.7%). Before the pandemic (Q4 2019) the serious rate was 0.7%. Among government-backed loans (FHA, VA, USDA), 2.7% were 90+ days late, vs 0.3% of loans bought by Fannie Mae and Freddie Mac. 0.3% of loans were in forbearance.
Arkansas
In Q2 2026, 1.6% of Arkansas mortgages were 90 or more days late or in foreclosure (rank 6 of 51, where 1 is highest; U.S. 1.2%), up 0.4 points from 1.2% a year earlier. Another 2.3% were 30 to 89 days late (U.S. 1.7%). Before the pandemic (Q4 2019) the serious rate was 1.6%. Among government-backed loans (FHA, VA, USDA), 2.5% were 90+ days late, vs 0.3% of loans bought by Fannie Mae and Freddie Mac. 0.5% of loans were in forbearance.
California
In Q2 2026, 0.7% of California mortgages were 90 or more days late or in foreclosure (rank 47 of 51, where 1 is highest; U.S. 1.2%), up 0.1 points from 0.6% a year earlier. Another 1.1% were 30 to 89 days late (U.S. 1.7%). Before the pandemic (Q4 2019) the serious rate was 0.6%. Among government-backed loans (FHA, VA, USDA), 2.4% were 90+ days late, vs 0.3% of loans bought by Fannie Mae and Freddie Mac. 0.3% of loans were in forbearance.
Colorado
In Q2 2026, 0.9% of Colorado mortgages were 90 or more days late or in foreclosure (rank 39 of 51, where 1 is highest; U.S. 1.2%), up 0.2 points from 0.7% a year earlier. Another 1.2% were 30 to 89 days late (U.S. 1.7%). Before the pandemic (Q4 2019) the serious rate was 0.5%. Among government-backed loans (FHA, VA, USDA), 2.6% were 90+ days late, vs 0.2% of loans bought by Fannie Mae and Freddie Mac. 0.3% of loans were in forbearance.
Connecticut
In Q2 2026, 1.3% of Connecticut mortgages were 90 or more days late or in foreclosure (rank 19 of 51, where 1 is highest; U.S. 1.2%), up 0.4 points from 0.9% a year earlier. Another 1.7% were 30 to 89 days late (U.S. 1.7%). Before the pandemic (Q4 2019) the serious rate was 1.7%. Among government-backed loans (FHA, VA, USDA), 3.8% were 90+ days late, vs 0.4% of loans bought by Fannie Mae and Freddie Mac. 0.4% of loans were in forbearance.
Delaware
In Q2 2026, 1.3% of Delaware mortgages were 90 or more days late or in foreclosure (rank 19 of 51, where 1 is highest; U.S. 1.2%), up 0.1 points from 1.2% a year earlier. Another 2.1% were 30 to 89 days late (U.S. 1.7%). Before the pandemic (Q4 2019) the serious rate was 1.6%. Among government-backed loans (FHA, VA, USDA), 2.6% were 90+ days late, vs 0.4% of loans bought by Fannie Mae and Freddie Mac. 0.5% of loans were in forbearance.
District of Columbia
In Q2 2026, 1.5% of District of Columbia mortgages were 90 or more days late or in foreclosure (rank 8 of 51, where 1 is highest; U.S. 1.2%), up 0.1 points from 1.4% a year earlier. Another 1.0% were 30 to 89 days late (U.S. 1.7%). Before the pandemic (Q4 2019) the serious rate was 1.1%. Among government-backed loans (FHA, VA, USDA), 5.7% were 90+ days late, vs 0.7% of loans bought by Fannie Mae and Freddie Mac. 0.5% of loans were in forbearance.
Florida
In Q2 2026, 1.7% of Florida mortgages were 90 or more days late or in foreclosure (rank 3 of 51, where 1 is highest; U.S. 1.2%), up 0.6 points from 1.1% a year earlier. Another 1.8% were 30 to 89 days late (U.S. 1.7%). Before the pandemic (Q4 2019) the serious rate was 1.3%. Among government-backed loans (FHA, VA, USDA), 3.1% were 90+ days late, vs 0.5% of loans bought by Fannie Mae and Freddie Mac. 0.5% of loans were in forbearance.
Georgia
In Q2 2026, 1.7% of Georgia mortgages were 90 or more days late or in foreclosure (rank 3 of 51, where 1 is highest; U.S. 1.2%), up 0.6 points from 1.1% a year earlier. Another 2.3% were 30 to 89 days late (U.S. 1.7%). Before the pandemic (Q4 2019) the serious rate was 1.5%. Among government-backed loans (FHA, VA, USDA), 3.5% were 90+ days late, vs 0.4% of loans bought by Fannie Mae and Freddie Mac. 0.7% of loans were in forbearance.
Hawaii
In Q2 2026, 0.9% of Hawaii mortgages were 90 or more days late or in foreclosure (rank 39 of 51, where 1 is highest; U.S. 1.2%), unchanged from 0.9% a year earlier. Another 0.6% were 30 to 89 days late (U.S. 1.7%). Before the pandemic (Q4 2019) the serious rate was 0.9%. Among government-backed loans (FHA, VA, USDA), 1.6% were 90+ days late, vs 0.3% of loans bought by Fannie Mae and Freddie Mac. 2.6% of loans were in forbearance.
Idaho
In Q2 2026, 0.7% of Idaho mortgages were 90 or more days late or in foreclosure (rank 47 of 51, where 1 is highest; U.S. 1.2%), up 0.2 points from 0.5% a year earlier. Another 1.3% were 30 to 89 days late (U.S. 1.7%). Before the pandemic (Q4 2019) the serious rate was 0.6%. Among government-backed loans (FHA, VA, USDA), 2.1% were 90+ days late, vs 0.3% of loans bought by Fannie Mae and Freddie Mac. 0.2% of loans were in forbearance.
Illinois
In Q2 2026, 1.5% of Illinois mortgages were 90 or more days late or in foreclosure (rank 8 of 51, where 1 is highest; U.S. 1.2%), up 0.3 points from 1.2% a year earlier. Another 1.7% were 30 to 89 days late (U.S. 1.7%). Before the pandemic (Q4 2019) the serious rate was 1.5%. Among government-backed loans (FHA, VA, USDA), 4.0% were 90+ days late, vs 0.4% of loans bought by Fannie Mae and Freddie Mac. 0.4% of loans were in forbearance.
Indiana
In Q2 2026, 1.4% of Indiana mortgages were 90 or more days late or in foreclosure (rank 16 of 51, where 1 is highest; U.S. 1.2%), up 0.3 points from 1.1% a year earlier. Another 2.1% were 30 to 89 days late (U.S. 1.7%). Before the pandemic (Q4 2019) the serious rate was 1.4%. Among government-backed loans (FHA, VA, USDA), 3.0% were 90+ days late, vs 0.3% of loans bought by Fannie Mae and Freddie Mac. 0.4% of loans were in forbearance.
Iowa
In Q2 2026, 1.1% of Iowa mortgages were 90 or more days late or in foreclosure (rank 27 of 51, where 1 is highest; U.S. 1.2%), up 0.3 points from 0.8% a year earlier. Another 1.4% were 30 to 89 days late (U.S. 1.7%). Before the pandemic (Q4 2019) the serious rate was 1.0%. Among government-backed loans (FHA, VA, USDA), 3.2% were 90+ days late, vs 0.4% of loans bought by Fannie Mae and Freddie Mac. 0.3% of loans were in forbearance.
Kansas
In Q2 2026, 1.2% of Kansas mortgages were 90 or more days late or in foreclosure (rank 23 of 51, where 1 is highest; U.S. 1.2%), up 0.3 points from 0.9% a year earlier. Another 1.6% were 30 to 89 days late (U.S. 1.7%). Before the pandemic (Q4 2019) the serious rate was 1.1%. Among government-backed loans (FHA, VA, USDA), 2.5% were 90+ days late, vs 0.4% of loans bought by Fannie Mae and Freddie Mac. 0.3% of loans were in forbearance.
Kentucky
In Q2 2026, 1.5% of Kentucky mortgages were 90 or more days late or in foreclosure (rank 8 of 51, where 1 is highest; U.S. 1.2%), up 0.3 points from 1.2% a year earlier. Another 1.9% were 30 to 89 days late (U.S. 1.7%). Before the pandemic (Q4 2019) the serious rate was 1.8%. Among government-backed loans (FHA, VA, USDA), 2.3% were 90+ days late, vs 0.3% of loans bought by Fannie Mae and Freddie Mac. 0.3% of loans were in forbearance.
Louisiana
In Q2 2026, 2.6% of Louisiana mortgages were 90 or more days late or in foreclosure (rank 1 of 51, where 1 is highest; U.S. 1.2%), up 0.5 points from 2.1% a year earlier. Another 3.4% were 30 to 89 days late (U.S. 1.7%). Before the pandemic (Q4 2019) the serious rate was 2.2%. Among government-backed loans (FHA, VA, USDA), 4.0% were 90+ days late, vs 0.6% of loans bought by Fannie Mae and Freddie Mac. 1.4% of loans were in forbearance.
Maine
In Q2 2026, 1.0% of Maine mortgages were 90 or more days late or in foreclosure (rank 32 of 51, where 1 is highest; U.S. 1.2%), up 0.1 points from 0.9% a year earlier. Another 1.7% were 30 to 89 days late (U.S. 1.7%). Before the pandemic (Q4 2019) the serious rate was 1.6%. Among government-backed loans (FHA, VA, USDA), 2.0% were 90+ days late, vs 0.2% of loans bought by Fannie Mae and Freddie Mac. 0.2% of loans were in forbearance.
Maryland
In Q2 2026, 1.6% of Maryland mortgages were 90 or more days late or in foreclosure (rank 6 of 51, where 1 is highest; U.S. 1.2%), up 0.6 points from 1.0% a year earlier. Another 1.9% were 30 to 89 days late (U.S. 1.7%). Before the pandemic (Q4 2019) the serious rate was 1.6%. Among government-backed loans (FHA, VA, USDA), 3.7% were 90+ days late, vs 0.3% of loans bought by Fannie Mae and Freddie Mac. 0.7% of loans were in forbearance.
Massachusetts
In Q2 2026, 0.8% of Massachusetts mortgages were 90 or more days late or in foreclosure (rank 42 of 51, where 1 is highest; U.S. 1.2%), up 0.2 points from 0.6% a year earlier. Another 1.2% were 30 to 89 days late (U.S. 1.7%). Before the pandemic (Q4 2019) the serious rate was 1.0%. Among government-backed loans (FHA, VA, USDA), 3.3% were 90+ days late, vs 0.3% of loans bought by Fannie Mae and Freddie Mac. 0.3% of loans were in forbearance.
Michigan
In Q2 2026, 1.0% of Michigan mortgages were 90 or more days late or in foreclosure (rank 32 of 51, where 1 is highest; U.S. 1.2%), up 0.2 points from 0.8% a year earlier. Another 1.8% were 30 to 89 days late (U.S. 1.7%). Before the pandemic (Q4 2019) the serious rate was 0.9%. Among government-backed loans (FHA, VA, USDA), 3.1% were 90+ days late, vs 0.3% of loans bought by Fannie Mae and Freddie Mac. 0.7% of loans were in forbearance.
Minnesota
In Q2 2026, 0.8% of Minnesota mortgages were 90 or more days late or in foreclosure (rank 42 of 51, where 1 is highest; U.S. 1.2%), up 0.1 points from 0.7% a year earlier. Another 1.2% were 30 to 89 days late (U.S. 1.7%). Before the pandemic (Q4 2019) the serious rate was 0.8%. Among government-backed loans (FHA, VA, USDA), 3.0% were 90+ days late, vs 0.2% of loans bought by Fannie Mae and Freddie Mac. 0.3% of loans were in forbearance.
Mississippi
In Q2 2026, 2.2% of Mississippi mortgages were 90 or more days late or in foreclosure (rank 2 of 51, where 1 is highest; U.S. 1.2%), up 0.5 points from 1.7% a year earlier. Another 3.3% were 30 to 89 days late (U.S. 1.7%). Before the pandemic (Q4 2019) the serious rate was 2.1%. Among government-backed loans (FHA, VA, USDA), 2.9% were 90+ days late, vs 0.6% of loans bought by Fannie Mae and Freddie Mac. 1.3% of loans were in forbearance.
Missouri
In Q2 2026, 1.1% of Missouri mortgages were 90 or more days late or in foreclosure (rank 27 of 51, where 1 is highest; U.S. 1.2%), up 0.3 points from 0.8% a year earlier. Another 1.8% were 30 to 89 days late (U.S. 1.7%). Before the pandemic (Q4 2019) the serious rate was 1.1%. Among government-backed loans (FHA, VA, USDA), 2.6% were 90+ days late, vs 0.3% of loans bought by Fannie Mae and Freddie Mac. 0.4% of loans were in forbearance.
Montana
In Q2 2026, 0.8% of Montana mortgages were 90 or more days late or in foreclosure (rank 42 of 51, where 1 is highest; U.S. 1.2%), up 0.1 points from 0.7% a year earlier. Another 1.1% were 30 to 89 days late (U.S. 1.7%). Before the pandemic (Q4 2019) the serious rate was 0.9%. Among government-backed loans (FHA, VA, USDA), 1.7% were 90+ days late, vs 0.3% of loans bought by Fannie Mae and Freddie Mac. 0.5% of loans were in forbearance.
Nebraska
In Q2 2026, 0.9% of Nebraska mortgages were 90 or more days late or in foreclosure (rank 39 of 51, where 1 is highest; U.S. 1.2%), up 0.4 points from 0.5% a year earlier. Another 1.4% were 30 to 89 days late (U.S. 1.7%). Before the pandemic (Q4 2019) the serious rate was 0.7%. Among government-backed loans (FHA, VA, USDA), 2.3% were 90+ days late, vs 0.3% of loans bought by Fannie Mae and Freddie Mac. 0.2% of loans were in forbearance.
Nevada
In Q2 2026, 1.1% of Nevada mortgages were 90 or more days late or in foreclosure (rank 27 of 51, where 1 is highest; U.S. 1.2%), up 0.2 points from 0.9% a year earlier. Another 1.2% were 30 to 89 days late (U.S. 1.7%). Before the pandemic (Q4 2019) the serious rate was 0.8%. Among government-backed loans (FHA, VA, USDA), 2.6% were 90+ days late, vs 0.3% of loans bought by Fannie Mae and Freddie Mac. 0.4% of loans were in forbearance.
New Hampshire
In Q2 2026, 0.7% of New Hampshire mortgages were 90 or more days late or in foreclosure (rank 47 of 51, where 1 is highest; U.S. 1.2%), up 0.1 points from 0.6% a year earlier. Another 1.1% were 30 to 89 days late (U.S. 1.7%). Before the pandemic (Q4 2019) the serious rate was 0.8%. Among government-backed loans (FHA, VA, USDA), 2.4% were 90+ days late, vs 0.2% of loans bought by Fannie Mae and Freddie Mac. 0.3% of loans were in forbearance.
New Jersey
In Q2 2026, 1.2% of New Jersey mortgages were 90 or more days late or in foreclosure (rank 23 of 51, where 1 is highest; U.S. 1.2%), up 0.3 points from 0.9% a year earlier. Another 1.5% were 30 to 89 days late (U.S. 1.7%). Before the pandemic (Q4 2019) the serious rate was 1.7%. Among government-backed loans (FHA, VA, USDA), 3.6% were 90+ days late, vs 0.3% of loans bought by Fannie Mae and Freddie Mac. 0.4% of loans were in forbearance.
New Mexico
In Q2 2026, 1.3% of New Mexico mortgages were 90 or more days late or in foreclosure (rank 19 of 51, where 1 is highest; U.S. 1.2%), up 0.3 points from 1.0% a year earlier. Another 2.0% were 30 to 89 days late (U.S. 1.7%). Before the pandemic (Q4 2019) the serious rate was 1.2%. Among government-backed loans (FHA, VA, USDA), 2.0% were 90+ days late, vs 0.3% of loans bought by Fannie Mae and Freddie Mac. 0.6% of loans were in forbearance.
New York
In Q2 2026, 1.3% of New York mortgages were 90 or more days late or in foreclosure (rank 19 of 51, where 1 is highest; U.S. 1.2%), up 0.2 points from 1.1% a year earlier. Another 1.3% were 30 to 89 days late (U.S. 1.7%). Before the pandemic (Q4 2019) the serious rate was 1.6%. Among government-backed loans (FHA, VA, USDA), 3.0% were 90+ days late, vs 0.4% of loans bought by Fannie Mae and Freddie Mac. 0.3% of loans were in forbearance.
North Carolina
In Q2 2026, 1.2% of North Carolina mortgages were 90 or more days late or in foreclosure (rank 23 of 51, where 1 is highest; U.S. 1.2%), up 0.3 points from 0.9% a year earlier. Another 1.8% were 30 to 89 days late (U.S. 1.7%). Before the pandemic (Q4 2019) the serious rate was 1.4%. Among government-backed loans (FHA, VA, USDA), 2.3% were 90+ days late, vs 0.3% of loans bought by Fannie Mae and Freddie Mac. 0.4% of loans were in forbearance.
North Dakota
In Q2 2026, 1.0% of North Dakota mortgages were 90 or more days late or in foreclosure (rank 32 of 51, where 1 is highest; U.S. 1.2%), up 0.1 points from 0.9% a year earlier. Another 1.2% were 30 to 89 days late (U.S. 1.7%). Before the pandemic (Q4 2019) the serious rate was 0.8%. Among government-backed loans (FHA, VA, USDA), 2.3% were 90+ days late, vs 0.3% of loans bought by Fannie Mae and Freddie Mac. 0.1% of loans were in forbearance.
Ohio
In Q2 2026, 1.4% of Ohio mortgages were 90 or more days late or in foreclosure (rank 16 of 51, where 1 is highest; U.S. 1.2%), up 0.4 points from 1.0% a year earlier. Another 1.8% were 30 to 89 days late (U.S. 1.7%). Before the pandemic (Q4 2019) the serious rate was 1.3%. Among government-backed loans (FHA, VA, USDA), 2.9% were 90+ days late, vs 0.4% of loans bought by Fannie Mae and Freddie Mac. 0.3% of loans were in forbearance.
Oklahoma
In Q2 2026, 1.7% of Oklahoma mortgages were 90 or more days late or in foreclosure (rank 3 of 51, where 1 is highest; U.S. 1.2%), up 0.5 points from 1.2% a year earlier. Another 2.1% were 30 to 89 days late (U.S. 1.7%). Before the pandemic (Q4 2019) the serious rate was 1.7%. Among government-backed loans (FHA, VA, USDA), 2.5% were 90+ days late, vs 0.4% of loans bought by Fannie Mae and Freddie Mac. 0.4% of loans were in forbearance.
Oregon
In Q2 2026, 0.8% of Oregon mortgages were 90 or more days late or in foreclosure (rank 42 of 51, where 1 is highest; U.S. 1.2%), up 0.2 points from 0.6% a year earlier. Another 0.9% were 30 to 89 days late (U.S. 1.7%). Before the pandemic (Q4 2019) the serious rate was 0.6%. Among government-backed loans (FHA, VA, USDA), 2.3% were 90+ days late, vs 0.3% of loans bought by Fannie Mae and Freddie Mac. 0.3% of loans were in forbearance.
Pennsylvania
In Q2 2026, 1.4% of Pennsylvania mortgages were 90 or more days late or in foreclosure (rank 16 of 51, where 1 is highest; U.S. 1.2%), up 0.3 points from 1.1% a year earlier. Another 2.0% were 30 to 89 days late (U.S. 1.7%). Before the pandemic (Q4 2019) the serious rate was 1.6%. Among government-backed loans (FHA, VA, USDA), 3.2% were 90+ days late, vs 0.3% of loans bought by Fannie Mae and Freddie Mac. 0.4% of loans were in forbearance.
Rhode Island
In Q2 2026, 1.5% of Rhode Island mortgages were 90 or more days late or in foreclosure (rank 8 of 51, where 1 is highest; U.S. 1.2%), up 0.8 points from 0.7% a year earlier. Another 1.8% were 30 to 89 days late (U.S. 1.7%). Before the pandemic (Q4 2019) the serious rate was 1.3%. Among government-backed loans (FHA, VA, USDA), 4.2% were 90+ days late, vs 0.4% of loans bought by Fannie Mae and Freddie Mac. 0.4% of loans were in forbearance.
South Carolina
In Q2 2026, 1.5% of South Carolina mortgages were 90 or more days late or in foreclosure (rank 8 of 51, where 1 is highest; U.S. 1.2%), up 0.3 points from 1.2% a year earlier. Another 2.4% were 30 to 89 days late (U.S. 1.7%). Before the pandemic (Q4 2019) the serious rate was 1.7%. Among government-backed loans (FHA, VA, USDA), 2.9% were 90+ days late, vs 0.3% of loans bought by Fannie Mae and Freddie Mac. 0.6% of loans were in forbearance.
South Dakota
In Q2 2026, 0.8% of South Dakota mortgages were 90 or more days late or in foreclosure (rank 42 of 51, where 1 is highest; U.S. 1.2%), up 0.2 points from 0.6% a year earlier. Another 1.5% were 30 to 89 days late (U.S. 1.7%). Before the pandemic (Q4 2019) the serious rate was 0.8%. Among government-backed loans (FHA, VA, USDA), 2.3% were 90+ days late, vs 0.2% of loans bought by Fannie Mae and Freddie Mac. 0.3% of loans were in forbearance.
Tennessee
In Q2 2026, 1.2% of Tennessee mortgages were 90 or more days late or in foreclosure (rank 23 of 51, where 1 is highest; U.S. 1.2%), up 0.3 points from 0.9% a year earlier. Another 1.7% were 30 to 89 days late (U.S. 1.7%). Before the pandemic (Q4 2019) the serious rate was 1.4%. Among government-backed loans (FHA, VA, USDA), 2.2% were 90+ days late, vs 0.3% of loans bought by Fannie Mae and Freddie Mac. 1.3% of loans were in forbearance.
Texas
In Q2 2026, 1.5% of Texas mortgages were 90 or more days late or in foreclosure (rank 8 of 51, where 1 is highest; U.S. 1.2%), up 0.3 points from 1.2% a year earlier. Another 2.3% were 30 to 89 days late (U.S. 1.7%). Before the pandemic (Q4 2019) the serious rate was 1.1%. Among government-backed loans (FHA, VA, USDA), 2.9% were 90+ days late, vs 0.4% of loans bought by Fannie Mae and Freddie Mac. 0.6% of loans were in forbearance.
Utah
In Q2 2026, 1.1% of Utah mortgages were 90 or more days late or in foreclosure (rank 27 of 51, where 1 is highest; U.S. 1.2%), up 0.4 points from 0.7% a year earlier. Another 1.2% were 30 to 89 days late (U.S. 1.7%). Before the pandemic (Q4 2019) the serious rate was 0.7%. Among government-backed loans (FHA, VA, USDA), 3.5% were 90+ days late, vs 0.3% of loans bought by Fannie Mae and Freddie Mac. 0.3% of loans were in forbearance.
Vermont
In Q2 2026, 1.0% of Vermont mortgages were 90 or more days late or in foreclosure (rank 32 of 51, where 1 is highest; U.S. 1.2%), up 0.2 points from 0.8% a year earlier. Another 1.0% were 30 to 89 days late (U.S. 1.7%). Before the pandemic (Q4 2019) the serious rate was 1.4%. Among government-backed loans (FHA, VA, USDA), 3.0% were 90+ days late, vs 0.4% of loans bought by Fannie Mae and Freddie Mac. 0.3% of loans were in forbearance.
Virginia
In Q2 2026, 1.0% of Virginia mortgages were 90 or more days late or in foreclosure (rank 32 of 51, where 1 is highest; U.S. 1.2%), up 0.3 points from 0.7% a year earlier. Another 1.5% were 30 to 89 days late (U.S. 1.7%). Before the pandemic (Q4 2019) the serious rate was 1.1%. Among government-backed loans (FHA, VA, USDA), 2.1% were 90+ days late, vs 0.2% of loans bought by Fannie Mae and Freddie Mac. 0.4% of loans were in forbearance.
Washington
In Q2 2026, 0.7% of Washington mortgages were 90 or more days late or in foreclosure (rank 47 of 51, where 1 is highest; U.S. 1.2%), up 0.2 points from 0.5% a year earlier. Another 0.7% were 30 to 89 days late (U.S. 1.7%). Before the pandemic (Q4 2019) the serious rate was 0.6%. Among government-backed loans (FHA, VA, USDA), 1.9% were 90+ days late, vs 0.2% of loans bought by Fannie Mae and Freddie Mac. 1.2% of loans were in forbearance.
West Virginia
In Q2 2026, 1.5% of West Virginia mortgages were 90 or more days late or in foreclosure (rank 8 of 51, where 1 is highest; U.S. 1.2%), up 0.1 points from 1.4% a year earlier. Another 3.0% were 30 to 89 days late (U.S. 1.7%). Before the pandemic (Q4 2019) the serious rate was 2.1%. Among government-backed loans (FHA, VA, USDA), 1.9% were 90+ days late, vs 0.4% of loans bought by Fannie Mae and Freddie Mac. 0.6% of loans were in forbearance.
Wisconsin
In Q2 2026, 0.6% of Wisconsin mortgages were 90 or more days late or in foreclosure (rank 51 of 51, where 1 is highest; U.S. 1.2%), up 0.1 points from 0.5% a year earlier. Another 1.1% were 30 to 89 days late (U.S. 1.7%). Before the pandemic (Q4 2019) the serious rate was 0.8%. Among government-backed loans (FHA, VA, USDA), 2.2% were 90+ days late, vs 0.2% of loans bought by Fannie Mae and Freddie Mac. 0.9% of loans were in forbearance.
Wyoming
In Q2 2026, 1.0% of Wyoming mortgages were 90 or more days late or in foreclosure (rank 32 of 51, where 1 is highest; U.S. 1.2%), up 0.3 points from 0.7% a year earlier. Another 2.4% were 30 to 89 days late (U.S. 1.7%). Before the pandemic (Q4 2019) the serious rate was 0.9%. Among government-backed loans (FHA, VA, USDA), 2.1% were 90+ days late, vs 0.2% of loans bought by Fannie Mae and Freddie Mac. 0.2% of loans were in forbearance.
What this means for local businesses
Some homes with seriously delinquent loans end up as short sales or foreclosures, which brings work for agents, appraisers, attorneys and repair contractors. Delinquency is still low by historical standards, so in most states the effect is small. For related local data, see real estate agents by state, mortgage rate lock-in by state and where home prices are falling. Small business owners whose household finances are stretched can also see business bankruptcy filings by state.
Methods and limits
- Source: National Mortgage Database (NMDB) mortgage performance statistics, quarterly, published by FHFA and built with the CFPB from a nationally representative 5% sample of credit records. Downloaded as the official state, national and metro files. Latest quarter: Q2 2026.
- Measures: shares of active first-lien closed-end mortgages that are 30–89 days past due, 90+ days past due, or in foreclosure, bankruptcy or deed-in-lieu, in the last month of the quarter. These categories don’t overlap. “Seriously delinquent” on this page = 90+ days past due plus in foreclosure, bankruptcy or deed-in-lieu, added by us from the published rounded rates.
- Comparisons: we compare the same quarter a year apart because late payments are seasonal (they tend to be higher in the fourth quarter).
- Preliminary data: NMDB says the latest two quarters are preliminary and initial delinquency estimates are usually higher than the revised numbers.
- Forbearance: under the CARES Act, loans in forbearance that were current when it began are reported as current. NMDB notes lenders often grant forbearance after natural disasters, which can hold delinquency down in affected areas.
- Rates are published rounded to 0.1 percentage point.
Sources
- FHFA, National Mortgage Database aggregate statistics: mortgage performance (states, national, metros) (bulk files)
Cite this data
Reporters and bloggers may use these numbers and charts. Please credit StartBusinessByState and link to this page.
Source: StartBusinessByState, “Mortgage Delinquency by State: Where Late Payments Are Rising (2026),” https://startbusinessbystate.com/mortgage-delinquency-by-state/ (updated October 8, 2026).
FAQ
What is the mortgage delinquency rate right now?
In Q2 2026, 1.7% of U.S. first-lien mortgages were 30–89 days late and 1.0% were 90 or more days late, according to the National Mortgage Database. 0.2% were in foreclosure, bankruptcy or deed-in-lieu.
Which state has the highest mortgage delinquency?
Louisiana had the highest share of mortgages 90+ days late or in foreclosure in Q2 2026 (2.6%), followed by Mississippi (2.2%) and Florida (1.7%).
Are mortgage delinquencies rising?
Yes, from low levels. The serious delinquency rate rose from 0.9% to 1.2% over the past year and increased in 50 states. It is still far below the 2009–2010 peak.
Which loans are most likely to be late?
Government-backed FHA, VA and USDA loans: 2.8% were 90+ days late in Q2 2026, vs 0.3% of loans bought by Fannie Mae and Freddie Mac.
Where is this data from?
The National Mortgage Database, published by the Federal Housing Finance Agency with the CFPB. We downloaded the official quarterly files.
Last updated October 8, 2026 by StartBusinessByState.