Updated October 12, 2026. Data: U.S. Labor Department, Quarterly Census of Employment and Wages, first quarter 2026 (preliminary, released September 2026), compared with the first quarter of 2025. The second-quarter figures are scheduled for early December 2026.
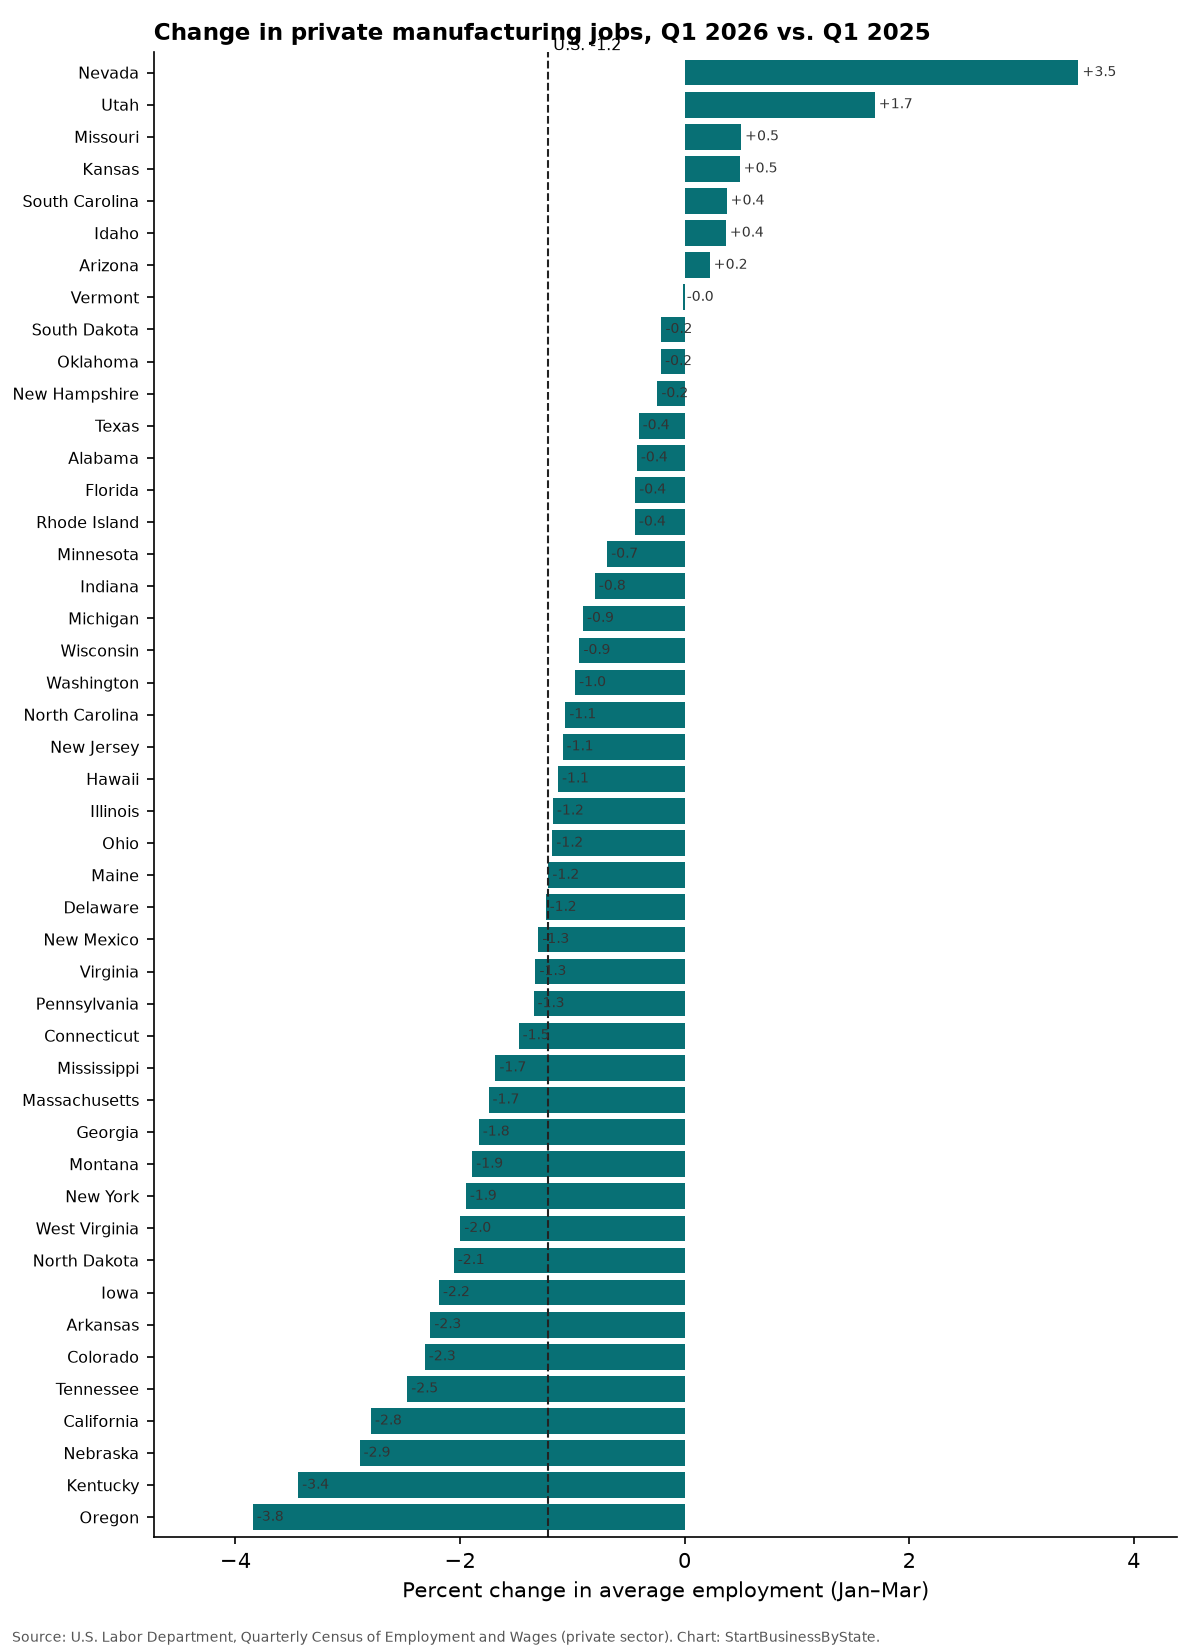
Private manufacturing employment averaged 12.44 million jobs in January–March 2026, -1.2% (-152,947) compared with the same months of 2025. Of the 46 states with published figures, jobs rose in 7 and fell in 39. The biggest increases were in Nevada (+3.5%), Utah (+1.7%) and Missouri (+0.5%). The biggest decreases were in Oregon (-3.8%), Kentucky (-3.4%) and Nebraska (-2.9%). Small shops that want to grow with this demand usually need small business loans for machines and materials.
Change by state
Context
Factory employment moves for many reasons: demand for specific products, the mix of industries in each state (cars, aircraft, food processing, chips, energy equipment), plant openings and closings, automation, energy costs and trade conditions. A single large plant can swing a small state’s numbers. This page reports the counts and doesn’t try to assign causes. For trade data, see tariff exposure by trade and state and exports to Canada by state.
State-by-state table
Click a column to sort. “n/a” means the government withheld the figure to protect the privacy of individual employers.
| State | Jobs, Q1 2026 | Jobs, Q1 2025 | Change | Percent change | Workplaces | Avg. weekly pay |
|---|---|---|---|---|---|---|
| U.S. | 12,442,445 | 12,595,392 | -152,947 | -1.2% | 403,603 | $1,918 |
| Alabama | 283,577 | 284,786 | -1,210 | -0.4% | 7,356 | $1,533 |
| Arizona | 193,530 | 193,098 | +432 | +0.2% | 6,239 | $2,317 |
| Arkansas | 157,101 | 160,740 | -3,639 | -2.3% | 2,705 | $1,261 |
| California | 1,187,468 | 1,221,583 | -34,114 | -2.8% | 44,316 | $2,955 |
| Colorado | 143,489 | 146,886 | -3,397 | -2.3% | 5,662 | $2,097 |
| Connecticut | 151,806 | 154,082 | -2,277 | -1.5% | 4,370 | $2,359 |
| Delaware | 26,194 | 26,522 | -328 | -1.2% | 818 | $1,621 |
| Florida | 426,346 | 428,227 | -1,881 | -0.4% | 28,099 | $1,925 |
| Georgia | 418,422 | 426,233 | -7,811 | -1.8% | 13,482 | $1,541 |
| Hawaii | 12,811 | 12,957 | -146 | -1.1% | 1,198 | $1,321 |
| Idaho | 73,983 | 73,712 | +271 | +0.4% | 4,268 | $1,726 |
| Illinois | 564,616 | 571,313 | -6,697 | -1.2% | 19,755 | $2,067 |
| Indiana | 513,674 | 517,808 | -4,134 | -0.8% | 9,510 | $1,919 |
| Iowa | 212,487 | 217,239 | -4,752 | -2.2% | 4,181 | $1,581 |
| Kansas | 174,696 | 173,843 | +853 | +0.5% | 3,693 | $1,578 |
| Kentucky | 245,257 | 253,997 | -8,740 | -3.4% | 7,646 | $1,566 |
| Louisiana | 139,291 | n/a | n/a | n/a | 4,593 | $2,020 |
| Maine | 49,746 | 50,356 | -611 | -1.2% | 1,785 | $1,500 |
| Maryland | 112,309 | n/a | n/a | n/a | 5,250 | $2,407 |
| Massachusetts | 222,679 | 226,636 | -3,957 | -1.7% | 7,231 | $2,626 |
| Michigan | 575,587 | 580,838 | -5,251 | -0.9% | 20,584 | $1,774 |
| Minnesota | 311,058 | 313,215 | -2,157 | -0.7% | 8,466 | $1,835 |
| Mississippi | 137,254 | 139,605 | -2,351 | -1.7% | 2,404 | $1,284 |
| Missouri | 282,560 | 281,145 | +1,415 | +0.5% | 9,244 | $1,622 |
| Montana | 20,563 | 20,959 | -396 | -1.9% | 1,904 | $1,462 |
| Nebraska | 100,369 | 103,361 | -2,991 | -2.9% | 1,911 | $1,345 |
| Nevada | 68,987 | 66,649 | +2,338 | +3.5% | 2,118 | $1,509 |
| New Hampshire | 67,236 | 67,399 | -163 | -0.2% | 2,045 | $2,023 |
| New Jersey | 246,752 | 249,460 | -2,708 | -1.1% | 9,802 | $2,362 |
| New Mexico | 27,947 | 28,316 | -369 | -1.3% | 1,473 | $1,491 |
| New York | 394,442 | 402,277 | -7,835 | -1.9% | 17,443 | $1,807 |
| North Carolina | 457,653 | 462,563 | -4,910 | -1.1% | 11,486 | $1,632 |
| North Dakota | 27,262 | 27,834 | -572 | -2.1% | 896 | $1,530 |
| Ohio | 668,435 | 676,402 | -7,967 | -1.2% | 16,585 | $1,652 |
| Oklahoma | 140,982 | 141,278 | -295 | -0.2% | 4,048 | $1,474 |
| Oregon | 172,525 | 179,424 | -6,899 | -3.8% | 6,901 | $2,013 |
| Pennsylvania | 550,054 | 557,550 | -7,496 | -1.3% | 14,641 | $1,643 |
| Rhode Island | 39,065 | 39,238 | -173 | -0.4% | 1,335 | $1,543 |
| South Carolina | 262,258 | 261,280 | +978 | +0.4% | 9,723 | $1,615 |
| South Dakota | 44,171 | 44,262 | -91 | -0.2% | 1,050 | $1,356 |
| Tennessee | 349,503 | 358,353 | -8,850 | -2.5% | 10,092 | $1,572 |
| Texas | 984,812 | 988,851 | -4,039 | -0.4% | 31,528 | $2,126 |
| Utah | 154,949 | 152,368 | +2,581 | +1.7% | 5,842 | $1,648 |
| Vermont | 27,117 | 27,121 | -4 | -0.0% | 1,080 | $1,539 |
| Virginia | 234,796 | 237,955 | -3,160 | -1.3% | 9,262 | $1,668 |
| Washington | 266,910 | 269,537 | -2,626 | -1.0% | 8,081 | $2,301 |
| West Virginia | 44,409 | 45,314 | -905 | -2.0% | 1,391 | $1,546 |
| Wisconsin | 452,692 | 456,968 | -4,276 | -0.9% | 8,601 | $1,513 |
| Alaska | n/a | n/a | n/a | n/a | n/a | n/a |
| District of Columbia | n/a | n/a | n/a | n/a | n/a | n/a |
| Wyoming | n/a | n/a | n/a | n/a | n/a | n/a |
Running a small manufacturing business?
Job sites and shop floors carry real risk. Compare general liability and workers' comp quotes from Simply Business.
We may earn a commission if you use this link. It doesn’t change what you pay, and it doesn’t affect the data on this page.
About the data
- Source: U.S. Labor Department, Quarterly Census of Employment and Wages, which counts jobs reported by employers covered by unemployment insurance, nearly every paying employer in the country.
- Industry: all manufacturing industries, private employers only.
- Jobs are the average of January, February and March employment. Change compares the same three months a year earlier, as published.
- Preliminary: first-quarter 2026 figures may be revised. States marked n/a had figures withheld for privacy: Alaska, District of Columbia, Louisiana, Maryland, Wyoming.
Sources
Cite this data
Reporters and bloggers may use these numbers and charts. Please credit StartBusinessByState and link to this page.
Source: StartBusinessByState, “Manufacturing Jobs by State (Q1 2026),” https://startbusinessbystate.com/manufacturing-jobs-by-state/ (updated October 12, 2026).
FAQ
Are manufacturing jobs growing or shrinking?
Nationally, private manufacturing employment was -1.2% in the first quarter of 2026 compared with a year earlier (-152,947 jobs). It rose in 7 states and fell in 39 of the 46 states with published figures.
Which state added the most manufacturing jobs?
By percent, Nevada (+3.5%), Utah (+1.7%) and Missouri (+0.5%).
Which states lost manufacturing jobs?
The largest percent declines were in Oregon (-3.8%), Kentucky (-3.4%) and Nebraska (-2.9%).
How many manufacturing jobs are there in the U.S.?
About 12.44 million private manufacturing jobs in early 2026, at 403,603 workplaces.
Where is this data from?
The U.S. Labor Department’s Quarterly Census of Employment and Wages, based on employer unemployment insurance reports.
Last updated October 12, 2026 by StartBusinessByState.