Updated October 14, 2026. Data: U.S. Census Bureau, American Community Survey, 2024 (latest available; 2025 results are due later this fall), with 2019 for comparison.
About 11.3 million U.S. households, 8.5% of all households, didn’t have a car, truck or van in 2024. In Washington, DC, it was more than a third (36.5%). Among the states, the share was highest in New York (29.8%), Massachusetts (11.8%) and Illinois (11.4%) and lowest in Idaho (3.8%), Wyoming (4.3%) and Utah (4.5%).
Going without a car is most common in big cities with subways and buses, and among older adults and lower-income households. New York has the most car-free households by count (2,332,989).
Share of households without a car
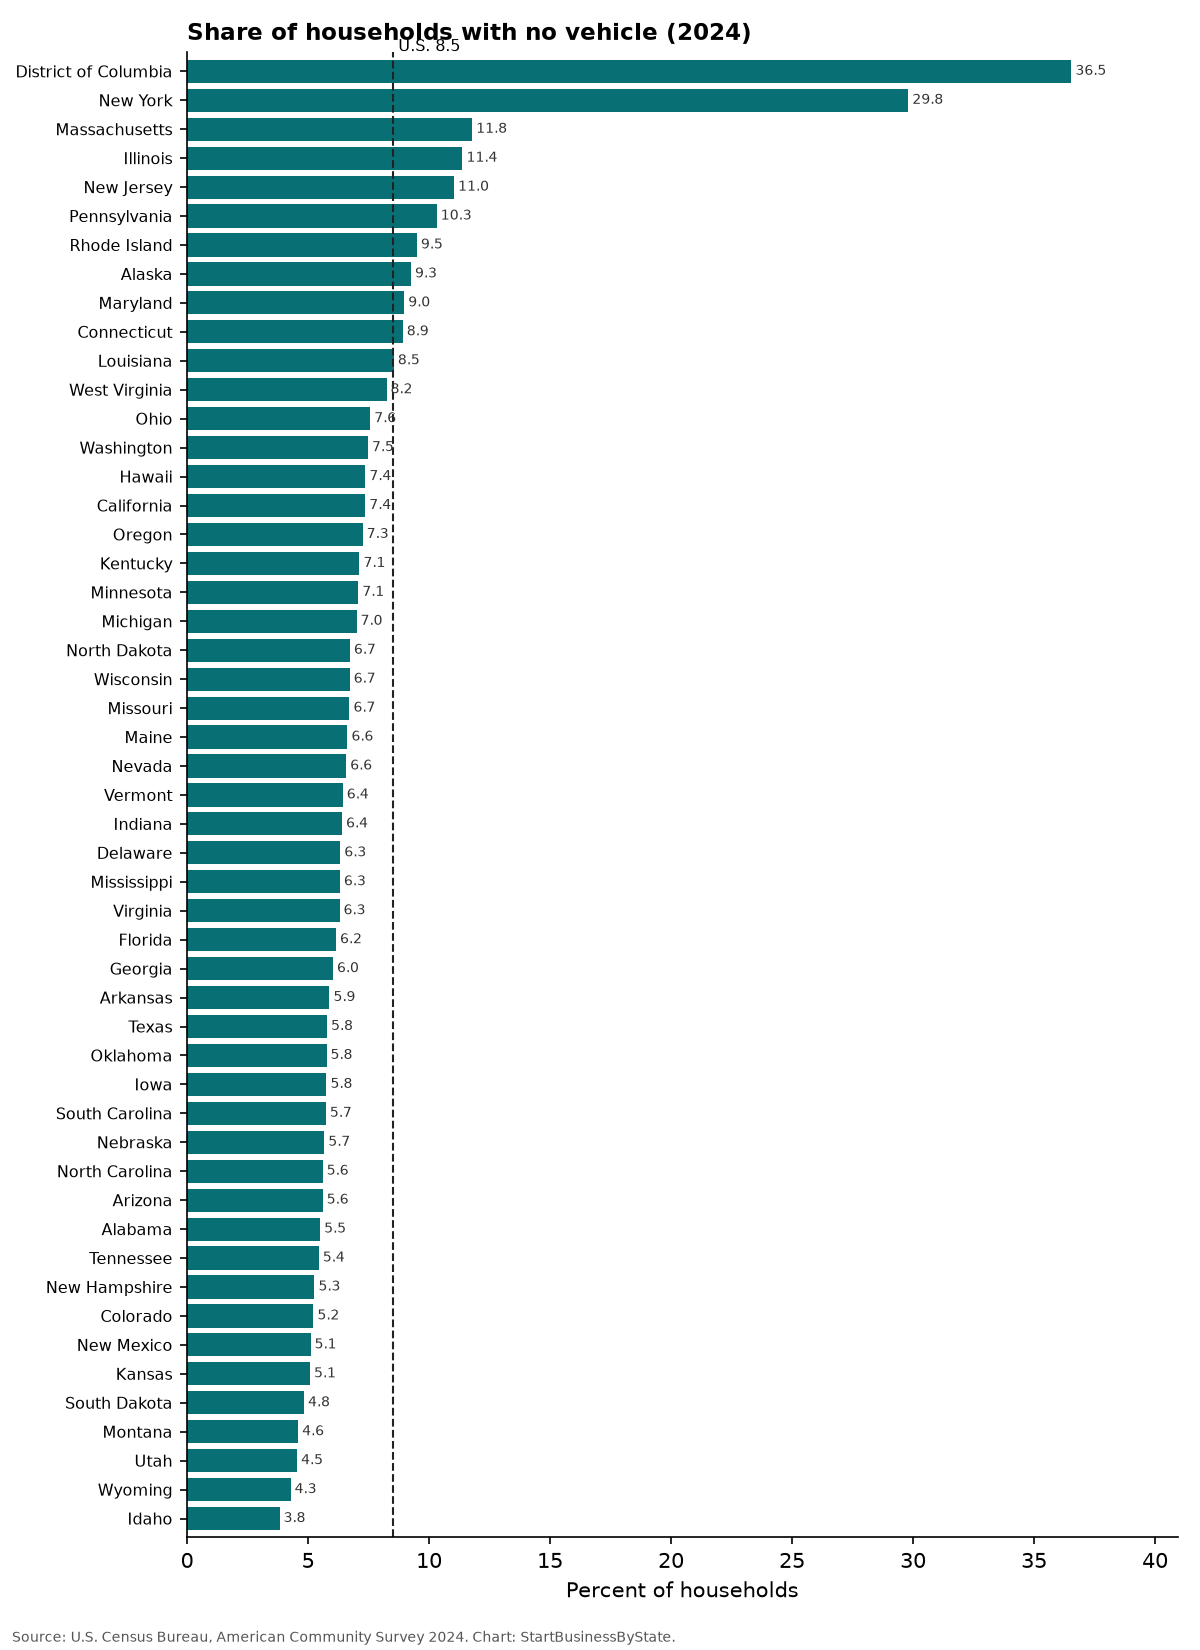
Every state: households with no vehicle
Click a column to sort.
| State | Share with no vehicle, 2024 | Households with no vehicle | All households | Share, 2019 | Change (points) |
|---|---|---|---|---|---|
| U.S. | 8.5% | 11,310,673 | 132,737,146 | 8.6% | -0.1 |
| Alabama | 5.5% | 113,260 | 2,059,528 | 6.0% | -0.5 |
| Alaska | 9.3% | 25,356 | 274,045 | 9.9% | -0.7 |
| Arizona | 5.6% | 167,144 | 2,982,475 | 6.0% | -0.4 |
| Arkansas | 5.9% | 73,364 | 1,246,754 | 6.4% | -0.5 |
| California | 7.4% | 1,015,896 | 13,797,638 | 7.1% | +0.3 |
| Colorado | 5.2% | 129,442 | 2,479,892 | 5.1% | +0.1 |
| Connecticut | 8.9% | 129,701 | 1,455,235 | 8.7% | +0.3 |
| Delaware | 6.3% | 26,105 | 412,304 | 5.7% | +0.7 |
| District of Columbia | 36.5% | 120,469 | 329,687 | 34.9% | +1.6 |
| Florida | 6.2% | 562,652 | 9,141,675 | 6.1% | +0.0 |
| Georgia | 6.0% | 254,453 | 4,220,732 | 6.4% | -0.4 |
| Hawaii | 7.4% | 36,336 | 493,151 | 7.7% | -0.3 |
| Idaho | 3.8% | 28,701 | 751,181 | 4.1% | -0.3 |
| Illinois | 11.4% | 581,024 | 5,105,448 | 11.1% | +0.3 |
| Indiana | 6.4% | 177,750 | 2,775,637 | 6.5% | -0.1 |
| Iowa | 5.8% | 77,385 | 1,343,422 | 6.1% | -0.3 |
| Kansas | 5.1% | 61,185 | 1,204,374 | 5.3% | -0.3 |
| Kentucky | 7.1% | 132,890 | 1,865,456 | 7.2% | -0.1 |
| Louisiana | 8.5% | 157,975 | 1,848,965 | 8.5% | +0.0 |
| Maine | 6.6% | 40,775 | 615,235 | 6.4% | +0.3 |
| Maryland | 9.0% | 215,513 | 2,401,394 | 9.1% | -0.1 |
| Massachusetts | 11.8% | 333,386 | 2,829,804 | 12.4% | -0.6 |
| Michigan | 7.0% | 289,334 | 4,131,281 | 7.5% | -0.5 |
| Minnesota | 7.1% | 167,202 | 2,363,442 | 6.6% | +0.5 |
| Mississippi | 6.3% | 74,315 | 1,176,690 | 6.5% | -0.2 |
| Missouri | 6.7% | 171,996 | 2,563,244 | 6.9% | -0.2 |
| Montana | 4.6% | 21,527 | 468,981 | 4.6% | +0.0 |
| Nebraska | 5.7% | 46,720 | 824,012 | 5.4% | +0.3 |
| Nevada | 6.6% | 81,475 | 1,238,925 | 7.1% | -0.5 |
| New Hampshire | 5.3% | 30,035 | 570,689 | 5.3% | -0.0 |
| New Jersey | 11.0% | 390,980 | 3,543,944 | 11.6% | -0.5 |
| New Mexico | 5.1% | 43,725 | 856,970 | 5.8% | -0.7 |
| New York | 29.8% | 2,332,989 | 7,828,074 | 29.4% | +0.4 |
| North Carolina | 5.6% | 251,997 | 4,496,359 | 5.8% | -0.2 |
| North Dakota | 6.7% | 23,530 | 349,705 | 5.3% | +1.4 |
| Ohio | 7.6% | 373,111 | 4,929,322 | 7.7% | -0.1 |
| Oklahoma | 5.8% | 92,418 | 1,603,748 | 5.6% | +0.1 |
| Oregon | 7.3% | 126,586 | 1,744,270 | 7.8% | -0.5 |
| Pennsylvania | 10.3% | 553,134 | 5,361,724 | 11.0% | -0.7 |
| Rhode Island | 9.5% | 42,578 | 448,318 | 9.7% | -0.2 |
| South Carolina | 5.7% | 127,477 | 2,222,890 | 6.0% | -0.2 |
| South Dakota | 4.8% | 18,476 | 382,302 | 5.1% | -0.3 |
| Tennessee | 5.4% | 159,397 | 2,928,765 | 5.7% | -0.2 |
| Texas | 5.8% | 662,197 | 11,449,769 | 5.4% | +0.4 |
| Utah | 4.5% | 53,845 | 1,184,428 | 3.9% | +0.7 |
| Vermont | 6.4% | 18,372 | 285,548 | 6.9% | -0.4 |
| Virginia | 6.3% | 217,318 | 3,449,307 | 6.1% | +0.2 |
| Washington | 7.5% | 236,798 | 3,168,080 | 7.1% | +0.4 |
| West Virginia | 8.2% | 61,057 | 740,840 | 9.3% | -1.0 |
| Wisconsin | 6.7% | 170,359 | 2,535,198 | 6.7% | +0.0 |
| Wyoming | 4.3% | 10,963 | 256,289 | 4.4% | -0.1 |
Why it matters for small businesses
- Delivery and mobile services fill a real need where many people can’t drive to a store: grocery delivery, mobile salons, home repair and errand services.
- Hiring. In car-light areas, a job site near transit can widen your pool of workers. See work from home rates in each state.
- Costs of driving. Compare with gas prices and Main Street spending.
Starting a delivery or mobile service?
Form your LLC with ZenBusiness. For coverage, compare business insurance quotes from Simply Business.
We may earn a commission if you use this link. It doesn’t change what you pay, and it doesn’t affect the data on this page.
How we counted
- Source: U.S. Census Bureau, American Community Survey 1-year estimates, table B08201 (household size by vehicles available), 2024 and 2019.
- Vehicles means cars, vans and trucks of one ton or less kept at home and available to the household, including company cars. Motorcycles don’t count.
- Survey figures have margins of error, especially in smaller states, so small differences between states may not be meaningful.
Sources
Cite this data
Reporters and bloggers may use these numbers and charts. Please credit StartBusinessByState and link to this page.
Source: StartBusinessByState, “11.3 Million U.S. Households Don't Have a Car,” https://startbusinessbystate.com/households-without-a-car/ (updated October 14, 2026).
FAQ
How many households don't have a car?
About 11,310,673 U.S. households, 8.5%, had no vehicle in 2024, according to the U.S. Census Bureau.
Which state has the most households without a car?
New York, where 29.8% of households have no vehicle. Washington, DC, is higher at 36.5%.
Which state has the fewest car-free households?
Idaho (3.8%), then Wyoming (4.3%) and Utah (4.5%).
Is the number of car-free households changing?
The share was about the same as before the pandemic: 8.6% in 2019 and 8.5% in 2024.
Where is this data from?
The U.S. Census Bureau’s yearly American Community Survey.
Last updated October 14, 2026 by StartBusinessByState.