By StartBusinessByStatePublisher: Robert SmithResearch process
Original research · Census ACS 2024, FHFA house price index through Q2 2026, Freddie Mac 30-year rate of 7.11% (November 12, 2026) · By StartBusinessByState · Published November 18, 2026
Short answer: you need about $109,043 a year to comfortably buy a typical home in the U.S. right now. That ranges from about $52,571 in West Virginia to $242,578 in Hawaii. In 47 states and DC, the median household earns less than that. For business owners, the bigger hurdle is often proving income: lenders usually want two years of tax returns, and the profit on those returns is after your business deductions.
How the income needed is figured
We start with a typical home price in each state, then add up the monthly cost of owning it:
- Principal and interest on a 30-year fixed loan for 90% of the price, at the 7.11% Freddie Mac average from November 12, 2026.
- Property tax, the state’s median real estate tax from the Census Bureau.
- Home insurance, the state’s median premium from our home insurance cost by state data.
Then we ask what yearly income keeps that payment at 30% of gross income. Federal housing rules (24 CFR 91.5) define cost burden as housing costs above 30% of gross income, so 30% is a common line for what is affordable. HUD’s definition includes utilities, which we leave out, so this is a generous version of that line. We also show the income at 36%, the most Fannie Mae allows for total debt on a manually underwritten loan without extra credit and savings requirements. That second number assumes you have no car loan, credit card or other debt payments, so it is the bare minimum.
Example: in Ohio, a typical home costs about $264,513. With $26,451 down, the monthly payment, tax and insurance come to about $1,946. To keep that at 30% of income, a buyer needs about $77,848 a year.
Income needed to buy a home, by state
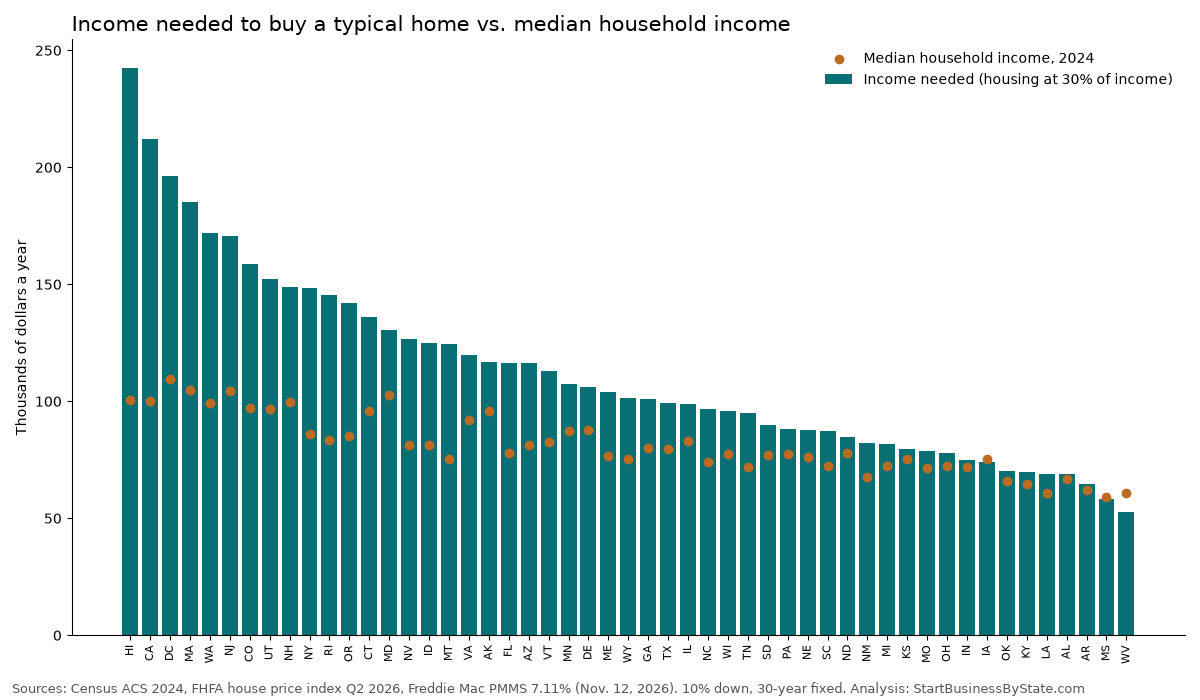
Most income needed: Hawaii ($242,578), California ($212,286), Massachusetts ($185,101). Least: West Virginia ($52,571), Mississippi ($58,444), Arkansas ($64,489). Only in West Virginia, Mississippi and Iowa does the 2024 median household income reach the income needed.
| State | Typical home price | 10% down payment | Monthly payment, tax and insurance | Income needed (30%) | Minimum income (36%, no other debt) | Median household income, 2024 | Average owner income, 2025 |
|---|---|---|---|---|---|---|---|
| Alabama | $251,259 | $25,126 | $1,720 | $68,815 | $57,346 | $66,659 | $25,727 |
| Alaska | $409,615 | $40,961 | $2,920 | $116,785 | $97,321 | $95,665 | $41,532 |
| Arizona | $438,601 | $43,860 | $2,908 | $116,311 | $96,926 | $81,486 | $30,471 |
| Arkansas | $230,325 | $23,033 | $1,612 | $64,489 | $53,741 | $62,106 | $23,871 |
| California | $782,037 | $78,204 | $5,307 | $212,286 | $176,905 | $100,149 | $41,661 |
| Colorado | $583,800 | $58,380 | $3,962 | $158,475 | $132,062 | $97,113 | $42,806 |
| Connecticut | $449,551 | $44,955 | $3,403 | $136,113 | $113,427 | $96,049 | $58,989 |
| Delaware | $400,602 | $40,060 | $2,655 | $106,182 | $88,485 | $87,534 | $9,189 |
| District of Columbia | $730,428 | $73,043 | $4,905 | $196,204 | $163,503 | $109,707 | Not shown |
| Florida | $405,041 | $40,504 | $2,910 | $116,400 | $97,000 | $77,735 | $17,970 |
| Georgia | $360,645 | $36,065 | $2,521 | $100,852 | $84,044 | $79,991 | $17,974 |
| Hawaii | $948,191 | $94,819 | $6,064 | $242,578 | $202,148 | $100,745 | $36,482 |
| Idaho | $474,669 | $47,467 | $3,125 | $124,993 | $104,160 | $81,166 | $34,298 |
| Illinois | $316,442 | $31,644 | $2,474 | $98,964 | $82,470 | $83,211 | $34,135 |
| Indiana | $267,078 | $26,708 | $1,875 | $75,006 | $62,505 | $71,959 | $51,107 |
| Iowa | $244,236 | $24,424 | $1,848 | $73,938 | $61,615 | $75,501 | $42,045 |
| Kansas | $259,439 | $25,944 | $1,986 | $79,440 | $66,200 | $75,514 | $36,102 |
| Kentucky | $247,044 | $24,704 | $1,747 | $69,864 | $58,220 | $64,526 | $29,398 |
| Louisiana | $235,652 | $23,565 | $1,726 | $69,025 | $57,521 | $60,986 | $30,918 |
| Maine | $373,311 | $37,331 | $2,602 | $104,083 | $86,736 | $76,442 | $32,732 |
| Maryland | $462,462 | $46,246 | $3,262 | $130,476 | $108,730 | $102,905 | $29,962 |
| Massachusetts | $657,244 | $65,724 | $4,628 | $185,101 | $154,251 | $104,828 | $52,079 |
| Michigan | $280,439 | $28,044 | $2,039 | $81,542 | $67,951 | $72,389 | $31,990 |
| Minnesota | $368,760 | $36,876 | $2,683 | $107,308 | $89,423 | $87,117 | $41,240 |
| Mississippi | $201,125 | $20,112 | $1,461 | $58,444 | $48,703 | $59,127 | $20,364 |
| Missouri | $276,249 | $27,625 | $1,974 | $78,970 | $65,809 | $71,589 | $40,417 |
| Montana | $452,383 | $45,238 | $3,117 | $124,686 | $103,905 | $75,340 | $34,351 |
| Nebraska | $282,161 | $28,216 | $2,195 | $87,795 | $73,163 | $76,376 | $62,761 |
| Nevada | $479,782 | $47,978 | $3,167 | $126,667 | $105,556 | $81,134 | $27,361 |
| New Hampshire | $505,251 | $50,525 | $3,718 | $148,716 | $123,930 | $99,782 | $55,686 |
| New Jersey | $557,605 | $55,761 | $4,264 | $170,564 | $142,137 | $104,294 | $38,879 |
| New Mexico | $298,791 | $29,879 | $2,057 | $82,279 | $68,566 | $67,816 | $32,895 |
| New York | $506,102 | $50,610 | $3,709 | $148,372 | $123,643 | $85,820 | $48,172 |
| North Carolina | $352,746 | $35,275 | $2,414 | $96,573 | $80,477 | $73,958 | $29,706 |
| North Dakota | $293,324 | $29,332 | $2,113 | $84,536 | $70,446 | $77,871 | $48,641 |
| Ohio | $264,513 | $26,451 | $1,946 | $77,848 | $64,874 | $72,212 | $31,390 |
| Oklahoma | $236,414 | $23,641 | $1,754 | $70,160 | $58,467 | $66,148 | $59,753 |
| Oregon | $517,825 | $51,782 | $3,551 | $142,054 | $118,378 | $85,220 | $36,156 |
| Pennsylvania | $306,927 | $30,693 | $2,209 | $88,377 | $73,647 | $77,545 | $39,942 |
| Rhode Island | $508,003 | $50,800 | $3,633 | $145,312 | $121,093 | $83,504 | $36,178 |
| South Carolina | $324,749 | $32,475 | $2,186 | $87,436 | $72,863 | $72,350 | $22,384 |
| South Dakota | $307,291 | $30,729 | $2,247 | $89,885 | $74,904 | $76,881 | $71,212 |
| Tennessee | $352,714 | $35,271 | $2,376 | $95,045 | $79,204 | $71,997 | $58,550 |
| Texas | $323,281 | $32,328 | $2,483 | $99,317 | $82,764 | $79,721 | $48,083 |
| Utah | $577,035 | $57,703 | $3,806 | $152,236 | $126,864 | $96,658 | $33,867 |
| Vermont | $383,612 | $38,361 | $2,825 | $112,988 | $94,156 | $82,730 | $37,149 |
| Virginia | $438,322 | $43,832 | $2,993 | $119,724 | $99,770 | $92,090 | $26,233 |
| Washington | $628,292 | $62,829 | $4,298 | $171,919 | $143,266 | $99,389 | $37,046 |
| West Virginia | $191,189 | $19,119 | $1,314 | $52,571 | $43,809 | $60,798 | $31,425 |
| Wisconsin | $330,304 | $33,030 | $2,398 | $95,925 | $79,937 | $77,488 | $33,944 |
| Wyoming | $370,415 | $37,041 | $2,538 | $101,528 | $84,607 | $75,532 | $29,893 |
| United States | $385,423 | $38,542 | $2,726 | $109,043 | $90,869 | $81,604 | $37,237 |
“Average owner income” is the Bureau of Economic Analysis figure for proprietors’ income per proprietor job in 2025. It counts side businesses as well as full-time owners, so it understates what many full-time owners earn, and many owners have a spouse or other income too. We leave DC out of that column, as on our business owner income by state page. Even so, the gap is wide: the average owner income of $37,237 is about a third of the $109,043 needed nationally.
What’s different when you’re self-employed
Lenders qualify everyone with the same math, income against debts. What changes for business owners is how income is proven.
- Who counts as self-employed. Fannie Mae treats anyone who owns 25% or more of a business as self-employed, including LLC members and S corporation owners.
- Two years of history. Fannie Mae generally requires lenders to get a two-year history of earnings. Less than two years can work if your latest tax returns show a full 12 months from the current business and you earned similar income in the same field before.
- Tax returns, not bank deposits. Lenders verify income with your signed federal tax returns for the past two years, personal and sometimes business, or IRS transcripts. A business that has existed for five years may need only one year of returns.
- A trend check. Lenders look at whether your business income is steady or rising from year to year. Falling income can reduce what they count.
- Deductions cut both ways. The same write-offs that lower your tax bill lower the income on your return. Fannie Mae’s cash flow analysis lets lenders add back some non-cash items, so ask a lender how they would treat your return.
- Business debt can count. Fannie Mae says business debt you are personally obligated on must be included in your monthly debts.
Example: a plumber with an LLC grosses $190,000 and reports $85,000 of profit after expenses. A lender starts from about $85,000, not $190,000. In Texas, where the income needed is about $99,317, that buyer would fall short at the 30% line but could still qualify at Fannie Mae’s 36% limit ($82,764) with no other debts.
Steps for business owners planning to buy
- Plan two tax years ahead. Decide with your tax preparer how to balance write-offs against the income a lender will see.
- Keep business and personal money separate. A business bank account and clean books make your returns easier for an underwriter to follow.
- Pay down personal debts. Every monthly payment you drop raises what you can borrow under the same income.
- Leave cash in the business. If you plan to use business money for the down payment, lenders may check that taking it out won’t hurt the business.
- Get preapproved early. A preapproval tells you what a lender will count before you shop.
Related: rent vs. own cost by state, property taxes by state and mortgage delinquency by state.
Running your business as a sole proprietor?
Form an LLC with LegalNature. Compare business insurance quotes from Simply Business.
We may earn a commission if you use these links. It doesn’t change what you pay, and it doesn’t affect the information on this page.
How we did this
Typical home price is the Census ACS 2024 1-year median home value (B25077) times the change in the state’s FHFA all-transactions house price index from its 2024 average to Q2 2026, the latest quarter. The loan is 90% of that price, 30-year fixed, at the Freddie Mac Primary Mortgage Market Survey average of 7.11% for the week of November 12, 2026. Property tax is the ACS 2024 median real estate tax (B25103). Insurance is the median homeowners premium from Census survey microdata used on our home insurance page. We leave out mortgage insurance, HOA fees and closing costs, so real costs are usually higher. Income needed equals 12 months of payment, tax and insurance divided by 0.30 (or 0.36). Median household income is ACS 2024 (B19013), the latest available; the 2025 ACS release has been delayed. Owner income is BEA table SAINC4, nonfarm and farm proprietors’ income divided by proprietors’ employment, 2025. This page uses the same home price model as our rent vs. own page, updated to the November 12 rate. Sources: Freddie Mac PMMS; FHFA House Price Index; Census American Community Survey 2024; Fannie Mae Selling Guide B3-6-02, Debt-to-Income Ratios; Fannie Mae Selling Guide B3-3.5-01, Self-Employed Borrower; 24 CFR 91.5 definitions; BEA regional income data.
Common questions
How much income do you need to buy a house in 2026?
About $109,043 a year for a typical U.S. home, if you put 10% down at the 7.11% average 30-year rate from November 12, 2026 and keep housing costs to 30% of income. The typical home in our model costs $385,423, and the monthly payment with property tax and insurance is about $2,726.
What state needs the most income to buy a home?
Hawaii, at about $242,578 a year, followed by California ($212,286) and Massachusetts ($185,101). West Virginia needs the least, about $52,571.
In how many states can a median household afford a typical home?
Only 3 states: West Virginia, Mississippi and Iowa. In the other 47 states and DC, the median household income in 2024 was below the income needed to keep a typical home’s costs at 30% of income.
Can self-employed people get a mortgage?
Yes. Fannie Mae’s rules treat anyone with a 25% or greater ownership stake in a business as self-employed. Lenders generally want a two-year history of self-employment income, shown on signed federal tax returns. One year can be enough in some cases, such as when the business has existed for five years.
Does writing off business expenses hurt my mortgage application?
It can. Lenders start from the income on your tax returns, so deductions that lower your taxable profit can also lower the income a lender counts. Fannie Mae asks lenders to study self-employed income with a cash flow analysis, and some items can be added back, so talk to a lender a year or two before you plan to buy.
How much does a lower mortgage rate help?
At 6.00% instead of 7.11%, the income needed for a typical U.S. home drops from about $109,043 to about $98,900. Putting 20% down instead of 10% at 7.11% lowers it to about $98,700.
Published November 18, 2026. Mortgage rate as of November 12, 2026.