Flood losses 2016–2025 (FEMA data as of 2026-06-01) and insurance prices through Aug. 2026 (BLS) · Updated by StartBusinessByState
Short answer: Flood damage to commercial buildings is concentrated on the Gulf and Southeast coasts, but every state had paid claims. Business insurance prices are also rising. The federal producer price index for commercial package (multiple-peril) policies is up 5.1% from a year earlier and 49.9% since August 2021.
Key facts
- 44,228 NFIP flood claims on non-residential buildings with losses in 2016–2025; 32,564 received a payment.
- $3.68 billion paid in total (building, contents and increased-cost-of-compliance coverage). Median paid claim $50,000; average $113,084.
- Top states by dollars paid: Florida $1,046M, Texas $863M, Louisiana $374M, North Carolina $284M, New Jersey $174M.
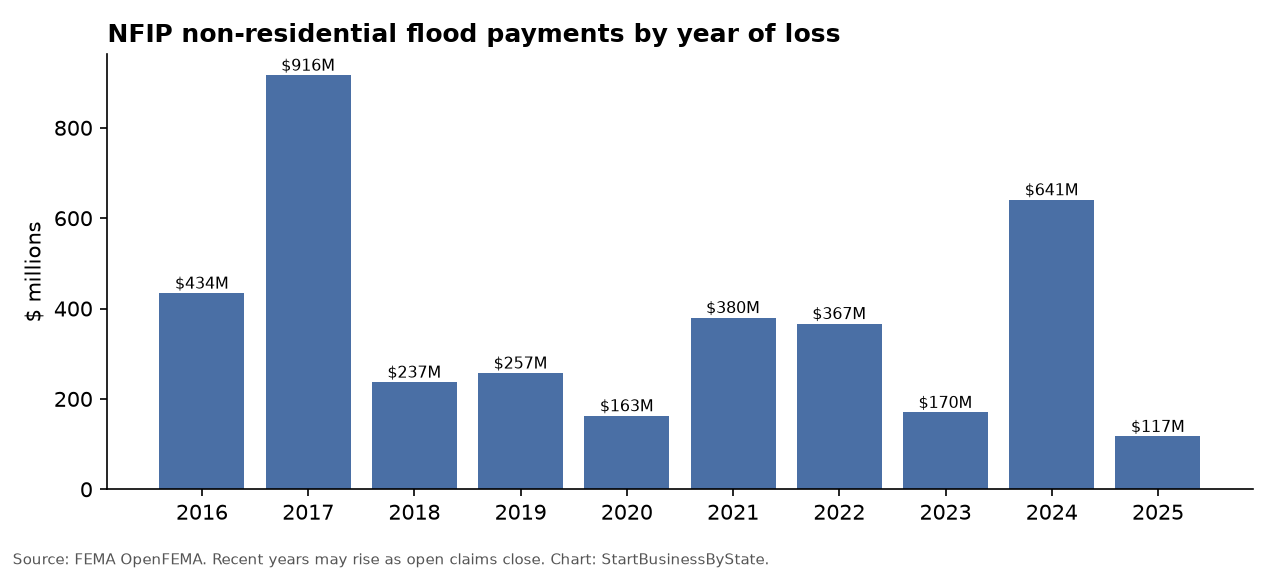
- The biggest year was 2017 ($916 million), driven by Hurricanes Harvey and Irma.
- Commercial multiple-peril insurance prices (BLS PPI): +5.1% year over year and +49.9% since Aug. 2021. Non-auto liability: +9.3% and +35.4%.
Where business flood claims are paid
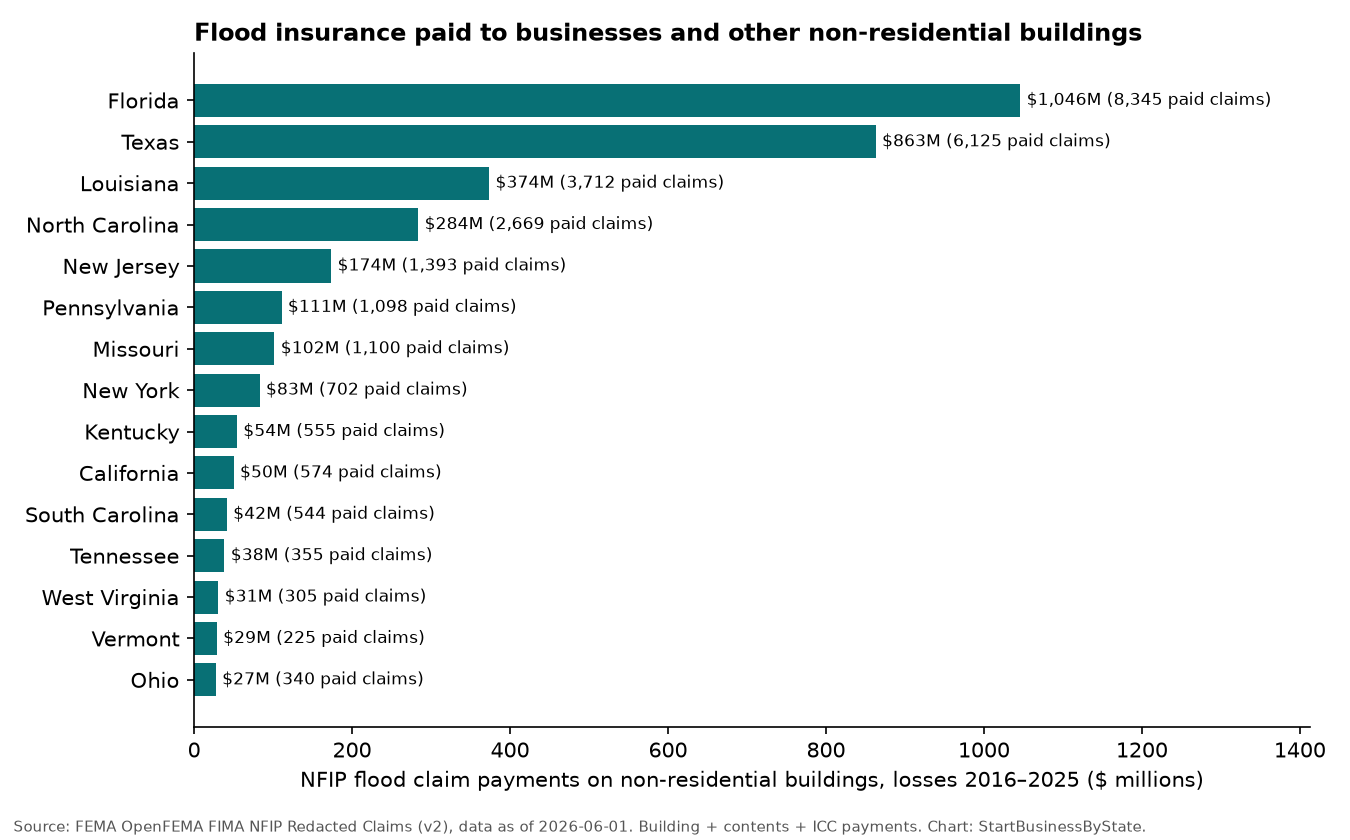
“Non-residential” in FEMA’s data covers businesses but also other non-residential buildings, such as churches and nonprofits. These are payouts under the National Flood Insurance Program only. Many businesses buy private flood coverage or none, so the true cost of flood damage to businesses is higher than this.
Business flood claims by state, 2016–2025
| State | Claims filed | Claims paid | Total paid | Median paid claim |
|---|---|---|---|---|
| Florida | 12,375 | 8,345 | $1,046.1M | $60,899 |
| Texas | 8,709 | 6,125 | $863.0M | $62,747 |
| Louisiana | 4,862 | 3,712 | $373.6M | $47,337 |
| North Carolina | 3,145 | 2,669 | $283.9M | $41,215 |
| New Jersey | 1,695 | 1,393 | $173.6M | $56,519 |
| Pennsylvania | 1,348 | 1,098 | $110.7M | $38,761 |
| Missouri | 1,277 | 1,100 | $101.7M | $34,022 |
| New York | 974 | 702 | $83.0M | $52,150 |
| Kentucky | 664 | 555 | $54.3M | $47,000 |
| California | 840 | 574 | $50.1M | $49,262 |
| South Carolina | 769 | 544 | $41.5M | $33,084 |
| Tennessee | 440 | 355 | $38.5M | $50,000 |
| West Virginia | 377 | 305 | $30.7M | $41,992 |
| Vermont | 276 | 225 | $28.8M | $55,000 |
| Ohio | 409 | 340 | $27.5M | $35,354 |
| Alabama | 402 | 271 | $27.4M | $43,586 |
| Iowa | 553 | 463 | $25.8M | $13,756 |
| Maryland | 297 | 254 | $25.6M | $64,420 |
| Virginia | 313 | 250 | $22.0M | $39,768 |
| Georgia | 400 | 269 | $21.4M | $29,073 |
| Mississippi | 510 | 361 | $21.1M | $27,717 |
| Illinois | 381 | 293 | $21.1M | $35,091 |
| Massachusetts | 368 | 262 | $20.1M | $30,052 |
| Wisconsin | 211 | 163 | $17.9M | $38,485 |
| Arkansas | 260 | 205 | $17.8M | $40,367 |
| Oklahoma | 245 | 205 | $16.5M | $33,476 |
| Connecticut | 216 | 159 | $15.6M | $50,000 |
| Michigan | 170 | 130 | $13.8M | $49,116 |
| Indiana | 178 | 146 | $13.8M | $45,075 |
| Nebraska | 128 | 99 | $13.4M | $30,000 |
| Maine | 229 | 167 | $11.7M | $33,845 |
| Washington | 145 | 101 | $11.6M | $62,205 |
| Rhode Island | 103 | 82 | $10.1M | $62,741 |
| Hawaii | 154 | 104 | $8.8M | $49,989 |
| Kansas | 117 | 90 | $7.8M | $47,117 |
| Minnesota | 116 | 96 | $7.1M | $29,140 |
| South Dakota | 72 | 49 | $4.0M | $10,249 |
| Delaware | 36 | 26 | $3.9M | $62,301 |
| Arizona | 75 | 42 | $3.6M | $30,119 |
| New Hampshire | 64 | 52 | $3.5M | $27,700 |
| New Mexico | 73 | 40 | $2.7M | $27,384 |
| Nevada | 52 | 35 | $2.4M | $1,766 |
| Colorado | 56 | 19 | $1.4M | $63,785 |
| Oregon | 50 | 29 | $0.9M | $14,801 |
| Alaska | 10 | 7 | $0.8M | $61,000 |
| Utah | 11 | 6 | $0.6M | $33,593 |
| Montana | 23 | 11 | $0.5M | $10,694 |
| North Dakota | 31 | 23 | $0.3M | $8,382 |
| District of Columbia | 5 | 3 | $0.3M | $9,056 |
| Wyoming | 7 | 6 | $0.1M | $7,040 |
| Idaho | 7 | 4 | $0.1M | $17,055 |
Source: FEMA OpenFEMA, FIMA NFIP Redacted Claims v2, non-residential occupancy types, year of loss 2016–2025, data as of 2026-06-01. Nominal dollars, not inflation-adjusted.
Business insurance price trends
No free public source reports average commercial property or fire insurance premiums for every state, so we don’t list state premiums. The federal producer price index, which tracks what insurers charge for the same coverage over time, shows the national trend:
| Insurance line (BLS PPI) | Index, Aug. 2026 | 1-year change | Change since Aug. 2021 |
|---|---|---|---|
| Commercial multiple peril (business package policies) | 198.803 | +5.1% | +49.9% |
| Other liability (non-auto) | 167.334 | +9.3% | +35.4% |
| Commercial auto | 148.005 | -1.2% | +15.3% |
| All property and casualty insurance | 200.665 | +2.7% | +27.7% |
Source: BLS Producer Price Index, series PCU5241265241265, PCU5241265241264, PCU5241265241263, PCU524126524126, not seasonally adjusted. Commercial multiple-peril policies bundle property (including fire) and liability coverage, like a business owner’s policy.
Related
See flood insurance deadlines by state, disaster declarations by state, disaster aid dollars by state and property taxes for small businesses. Trade insurance guides: food trucks, landscaping, HVAC, cleaning and daycare.
Methods and limits
- We pulled every NFIP claim with a non-residential occupancy type (codes 4, 6, 17, 18 and 19) and a loss year of 2016 or later from OpenFEMA, then summed building, contents and increased-cost-of-compliance payments by state. Claims with no payment count as filed but not paid.
- 2024 and 2025 totals may still rise as open claims close.
- FEMA is retiring the v2 claims dataset; future updates will use the v3 dataset.
- We tried to add NFIP policy counts by state, but FEMA’s policy dataset didn’t return results in time, so policies aren’t shown.
- State premium data from the National Association of Insurance Commissioners isn’t freely available at the level of detail we’d need, so we didn’t estimate it.
Cite this data
Reporters and bloggers may use these numbers and charts. Please credit StartBusinessByState and link to this page.
Source: StartBusinessByState, “Business Flood Insurance Claims and Commercial Insurance Costs by State,” https://startbusinessbystate.com/business-flood-insurance-claims-by-state/ (updated October 7, 2026).
FAQ
Which state has the most business flood insurance claims?
Florida. NFIP paid $1,046 million on 8,345 non-residential flood claims for losses in 2016–2025, followed by Texas and Louisiana.
How much does a typical business flood claim pay?
The median paid NFIP claim on a non-residential building with a 2016–2025 loss was $50,000. The average was higher, $113,084, because a few large losses pull it up.
Is business insurance getting more expensive?
Yes, nationally. BLS producer prices for commercial multiple-peril policies rose 5.1% in the year to August 2026 and 49.9% since August 2021.
Does commercial property insurance cover floods?
Usually not. Standard commercial property and business owner’s policies typically exclude flood, so businesses buy NFIP or private flood coverage separately.
Last updated October 7, 2026 by StartBusinessByState.