Updated October 14, 2026. Data: U.S. Commerce Department, Bureau of Economic Analysis, state household spending for 2025, released September 30, 2026. Next update: fall 2027.
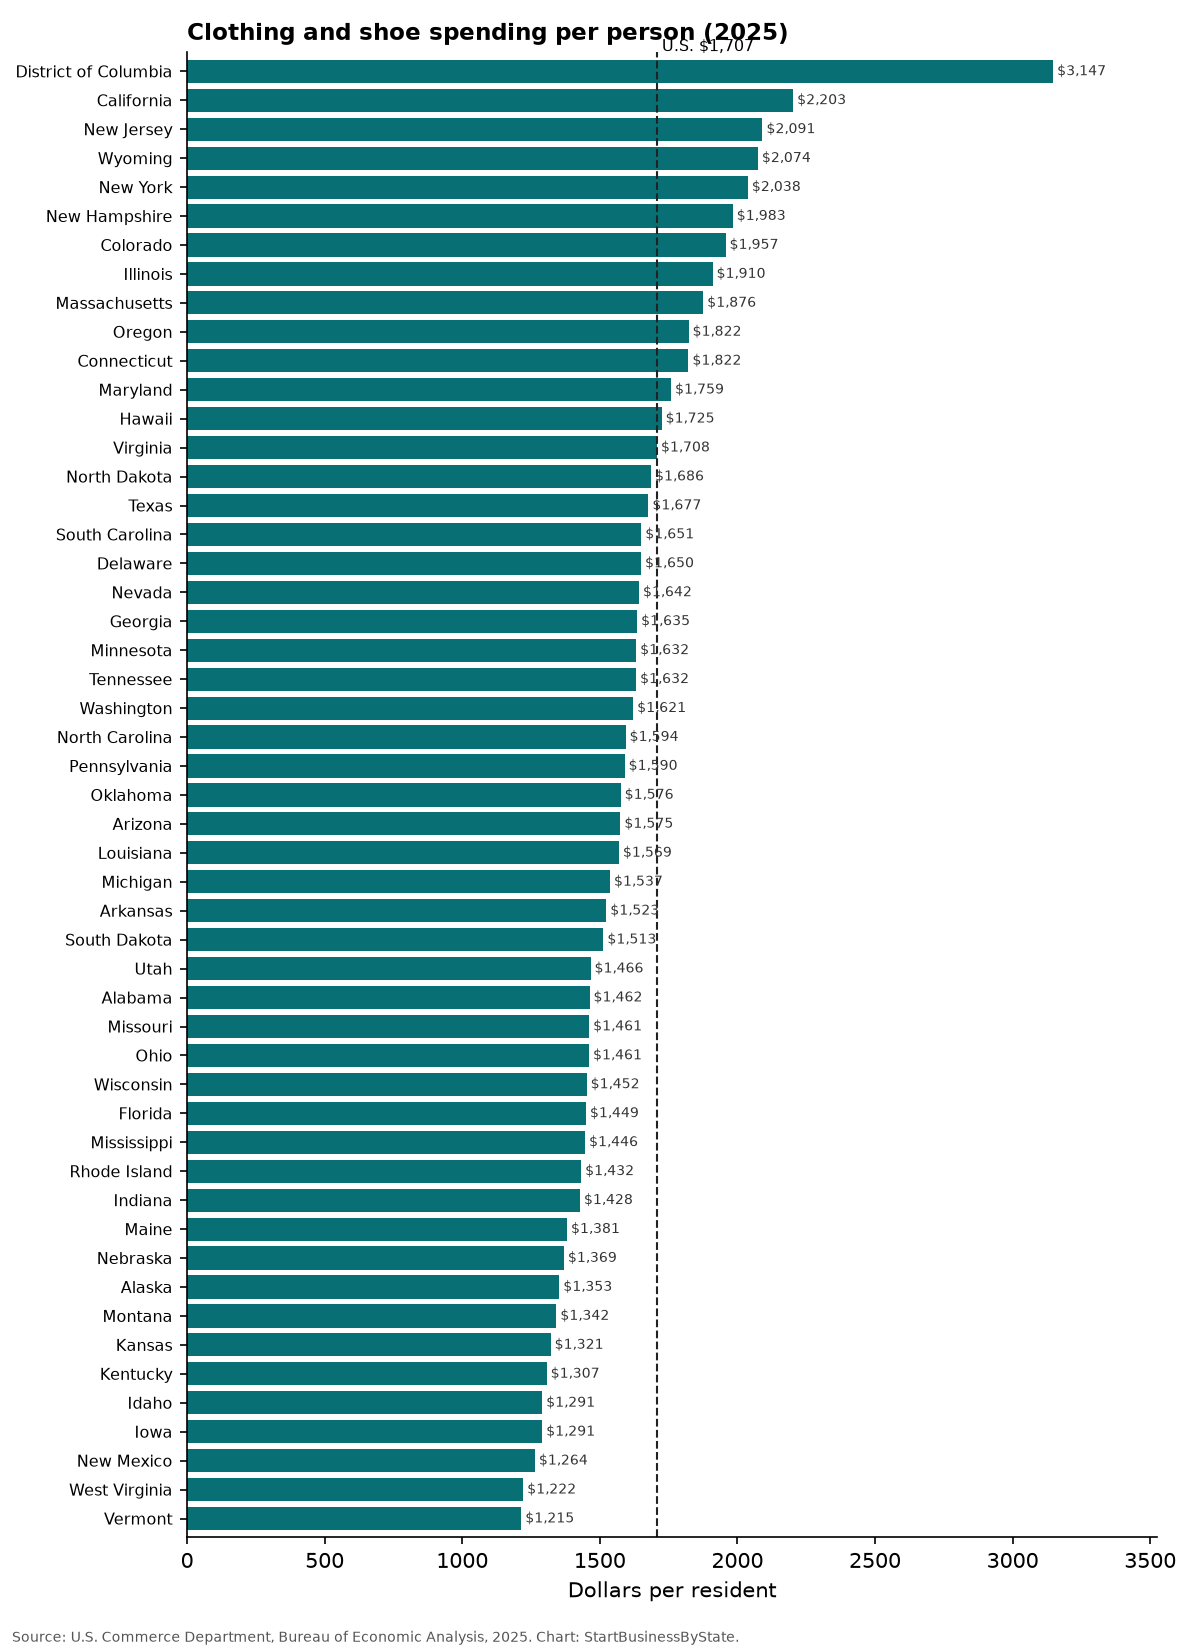
Americans spent $1,707 per person on clothing and shoes in 2025, with total spending up 5.5% from 2024. Among the states, spending per person was highest in California ($2,203), New Jersey ($2,091) and Wyoming ($2,074) and lowest in Vermont ($1,215), West Virginia ($1,222) and New Mexico ($1,264). Washington, DC, was higher than any state at $3,147.
This counts clothing, shoes and related services such as alterations and clothing rental, bought by people who live in each state. It is in current dollars, so part of any increase is higher prices, not more clothes.
Washington, DC, is a single city, so it is better compared with other cities than with whole states.
Spending per person in each state
Total spending grew fastest in South Carolina (+9.6%), District of Columbia (+8.8%) and Connecticut (+8.1%) and slowest in Wyoming (+2.9%), Mississippi (+3.3%) and California (+3.6%).
Every state: spending per person, 2025
Click a column to sort.
| State | Per person, 2025 | Per person, 2024 | Per person, 2019 | Total change, 2024–25 | Total, 2025 | Share of all spending |
|---|---|---|---|---|---|---|
| U.S. | $1,707 | $1,626 | $1,311 | +5.5% | $583.6B | 2.80% |
| Alabama | $1,462 | $1,390 | $1,093 | +5.8% | $7.59B | 3.00% |
| Alaska | $1,353 | $1,265 | $1,021 | +7.1% | $1.00B | 1.93% |
| Arizona | $1,575 | $1,503 | $1,194 | +5.7% | $12.00B | 2.70% |
| Arkansas | $1,523 | $1,458 | $1,128 | +5.1% | $4.75B | 3.16% |
| California | $2,203 | $2,126 | $1,667 | +3.6% | $86.68B | 3.14% |
| Colorado | $1,957 | $1,843 | $1,386 | +6.6% | $11.77B | 2.86% |
| Connecticut | $1,822 | $1,692 | $1,388 | +8.1% | $6.72B | 2.59% |
| Delaware | $1,650 | $1,576 | $1,384 | +5.6% | $1.75B | 2.59% |
| District of Columbia | $3,147 | $2,903 | $2,612 | +8.8% | $2.18B | 3.19% |
| Florida | $1,449 | $1,381 | $1,132 | +5.9% | $34.01B | 2.19% |
| Georgia | $1,635 | $1,589 | $1,242 | +3.8% | $18.49B | 2.97% |
| Hawaii | $1,725 | $1,633 | $1,552 | +5.4% | $2.47B | 2.71% |
| Idaho | $1,291 | $1,237 | $926 | +5.9% | $2.62B | 2.60% |
| Illinois | $1,910 | $1,810 | $1,408 | +5.6% | $24.29B | 3.00% |
| Indiana | $1,428 | $1,371 | $1,093 | +4.8% | $9.96B | 2.63% |
| Iowa | $1,291 | $1,216 | $984 | +6.4% | $4.18B | 2.52% |
| Kansas | $1,321 | $1,257 | $1,029 | +5.5% | $3.93B | 2.47% |
| Kentucky | $1,307 | $1,244 | $966 | +5.6% | $6.02B | 2.53% |
| Louisiana | $1,569 | $1,485 | $1,156 | +5.7% | $7.25B | 2.98% |
| Maine | $1,381 | $1,322 | $1,048 | +4.9% | $1.95B | 2.11% |
| Maryland | $1,759 | $1,670 | $1,331 | +5.6% | $11.02B | 2.89% |
| Massachusetts | $1,876 | $1,761 | $1,498 | +6.8% | $13.42B | 2.50% |
| Michigan | $1,537 | $1,457 | $1,122 | +5.8% | $15.56B | 2.68% |
| Minnesota | $1,632 | $1,555 | $1,230 | +5.6% | $9.52B | 2.67% |
| Mississippi | $1,446 | $1,403 | $1,069 | +3.3% | $4.27B | 3.15% |
| Missouri | $1,461 | $1,386 | $1,068 | +5.9% | $9.16B | 2.56% |
| Montana | $1,342 | $1,276 | $975 | +5.8% | $1.54B | 2.19% |
| Nebraska | $1,369 | $1,305 | $1,047 | +5.6% | $2.76B | 2.41% |
| Nevada | $1,642 | $1,573 | $1,283 | +5.3% | $5.39B | 2.81% |
| New Hampshire | $1,983 | $1,865 | $1,470 | +6.8% | $2.81B | 2.74% |
| New Jersey | $2,091 | $1,995 | $1,726 | +5.3% | $19.97B | 3.05% |
| New Mexico | $1,264 | $1,195 | $940 | +5.7% | $2.69B | 2.48% |
| New York | $2,038 | $1,915 | $1,670 | +6.4% | $40.76B | 2.93% |
| North Carolina | $1,594 | $1,536 | $1,200 | +5.1% | $17.84B | 2.86% |
| North Dakota | $1,686 | $1,587 | $1,310 | +7.1% | $1.35B | 2.76% |
| Ohio | $1,461 | $1,386 | $1,062 | +5.8% | $17.38B | 2.64% |
| Oklahoma | $1,576 | $1,514 | $1,196 | +4.8% | $6.50B | 3.30% |
| Oregon | $1,822 | $1,744 | $1,271 | +4.7% | $7.79B | 3.00% |
| Pennsylvania | $1,590 | $1,497 | $1,207 | +6.3% | $20.76B | 2.55% |
| Rhode Island | $1,432 | $1,344 | $1,055 | +7.0% | $1.60B | 2.35% |
| South Carolina | $1,651 | $1,527 | $1,317 | +9.6% | $9.19B | 3.08% |
| South Dakota | $1,513 | $1,454 | $1,119 | +5.0% | $1.41B | 2.66% |
| Tennessee | $1,632 | $1,527 | $1,165 | +7.8% | $11.94B | 3.05% |
| Texas | $1,677 | $1,601 | $1,348 | +6.0% | $53.16B | 3.00% |
| Utah | $1,466 | $1,402 | $1,121 | +5.6% | $5.19B | 2.69% |
| Vermont | $1,215 | $1,153 | $935 | +5.0% | $0.78B | 1.85% |
| Virginia | $1,708 | $1,623 | $1,308 | +6.0% | $15.16B | 2.82% |
| Washington | $1,621 | $1,547 | $1,245 | +5.8% | $12.97B | 2.47% |
| West Virginia | $1,222 | $1,155 | $899 | +5.7% | $2.16B | 2.31% |
| Wisconsin | $1,452 | $1,378 | $1,067 | +5.6% | $8.67B | 2.54% |
| Wyoming | $2,074 | $2,023 | $1,459 | +2.9% | $1.22B | 3.32% |
Why it matters for small businesses
- Boutiques and resale shops compete for this money. Higher spending per person can mean a bigger local market, but also more competition from big chains and online sellers.
- Holiday season matters. See how Small Business Saturday spending compares across states.
- Prices vs. paychecks. Compare with how paychecks have kept up with inflation.
- Home goods are a separate budget. See furniture spending per person.
Opening a clothing shop?
Form your LLC with ZenBusiness. For coverage, compare business insurance quotes from Simply Business.
We may earn a commission if you use this link. It doesn’t change what you pay, and it doesn’t affect the data on this page.
How we counted
- Source: U.S. Commerce Department, Bureau of Economic Analysis, state personal consumption spending by type of product (released September 30, 2026), category “Clothing, footwear, and related services,” 2019, 2024 and 2025, in current dollars (not adjusted for inflation).
- Per person: total spending divided by the department’s own population estimate for the same state and year.
- Where it’s counted: spending is assigned to the state where the buyer lives, as best the department can estimate.
- Change compares total spending in 2025 with 2024. Per-person change is a little lower because population grew.
Sources
Cite this data
Reporters and bloggers may use these numbers and charts. Please credit StartBusinessByState and link to this page.
Source: StartBusinessByState, “Americans Spent $1,707 a Person on Clothes and Shoes in 2025, Up 5.5%,” https://startbusinessbystate.com/clothing-spending/ (updated October 14, 2026).
FAQ
How much do Americans spend on clothing per year?
$1,707 per person on clothing, shoes and related services in 2025, according to the U.S. Commerce Department.
Which state spends the most on clothes?
California ($2,203 per person), followed by New Jersey ($2,091) and Wyoming ($2,074). Washington, DC, is higher at $3,147.
Which state spends the least on clothes?
Vermont ($1,215), then West Virginia ($1,222) and New Mexico ($1,264).
Is clothing spending rising?
Yes. The U.S. total rose 5.5% from 2024 to 2025 before inflation, fastest in South Carolina (+9.6%).
Where is this data from?
The U.S. Commerce Department publishes household spending for each state and type of product every fall.
Last updated October 14, 2026 by StartBusinessByState.