Original research · BLS state earnings + regional CPI · Last updated October 6, 2026
Data through: August 2026 for state earnings (August is preliminary) and regional prices. National earnings through September 2026. Next update after the October 14, 2026 CPI release and October state jobs data.
Paychecks are losing ground to prices in 30 states. Across the U.S., average hourly earnings for private-sector workers rose 3.0% in the year to September 2026, while consumer prices rose 3.4% in the year to August 2026. State by state, the picture splits. Minnesota, Nebraska and Arkansas saw the biggest drops in real hourly pay, while New Mexico and Hawaii kept well ahead of inflation. Data: Bureau of Labor Statistics, Jun–Aug 2026.
Key findings
- Real hourly pay fell in 30 of 51 states. That compares average hourly earnings for Jun–Aug 2026 with the same months a year earlier, after regional inflation. Using only August instead of the three-month average, the count is 19. Modeled
- Minnesota is furthest behind. Pay averaged $39.26 an hour, down 0.6% from a year earlier, while Midwest prices rose 3.6%. Real pay: −4.1%. Nebraska (−3.5%) and Arkansas (−3.3%) follow.
- New Mexico leads. Real hourly pay rose 5.0%, to $31.30 an hour. Hawaii (+4.3%) and District of Columbia (+4.0%) are next.
- The Northeast has the fastest inflation. Regional prices rose 4.1% over the period, against 3.2% in the West. All 9 Northeast states saw real pay fall.
- A full-time worker in Minnesota lost about $3,338 a year in buying power. That is the real hourly drop ($1.60 an hour at current prices) times 2,080 hours. Modeled
- Nationally, pay is barely ahead. U.S. average hourly earnings were $37.81 in September 2026, up 3.0% from a year earlier. Consumer prices were up 3.4% in the year to August.
Hiring cleaners in a changing wage market?
Turn the local pay comparison into a role, hours and employer-cost budget. Then set up the staffing process for your cleaning business.
Where are wages falling behind inflation?
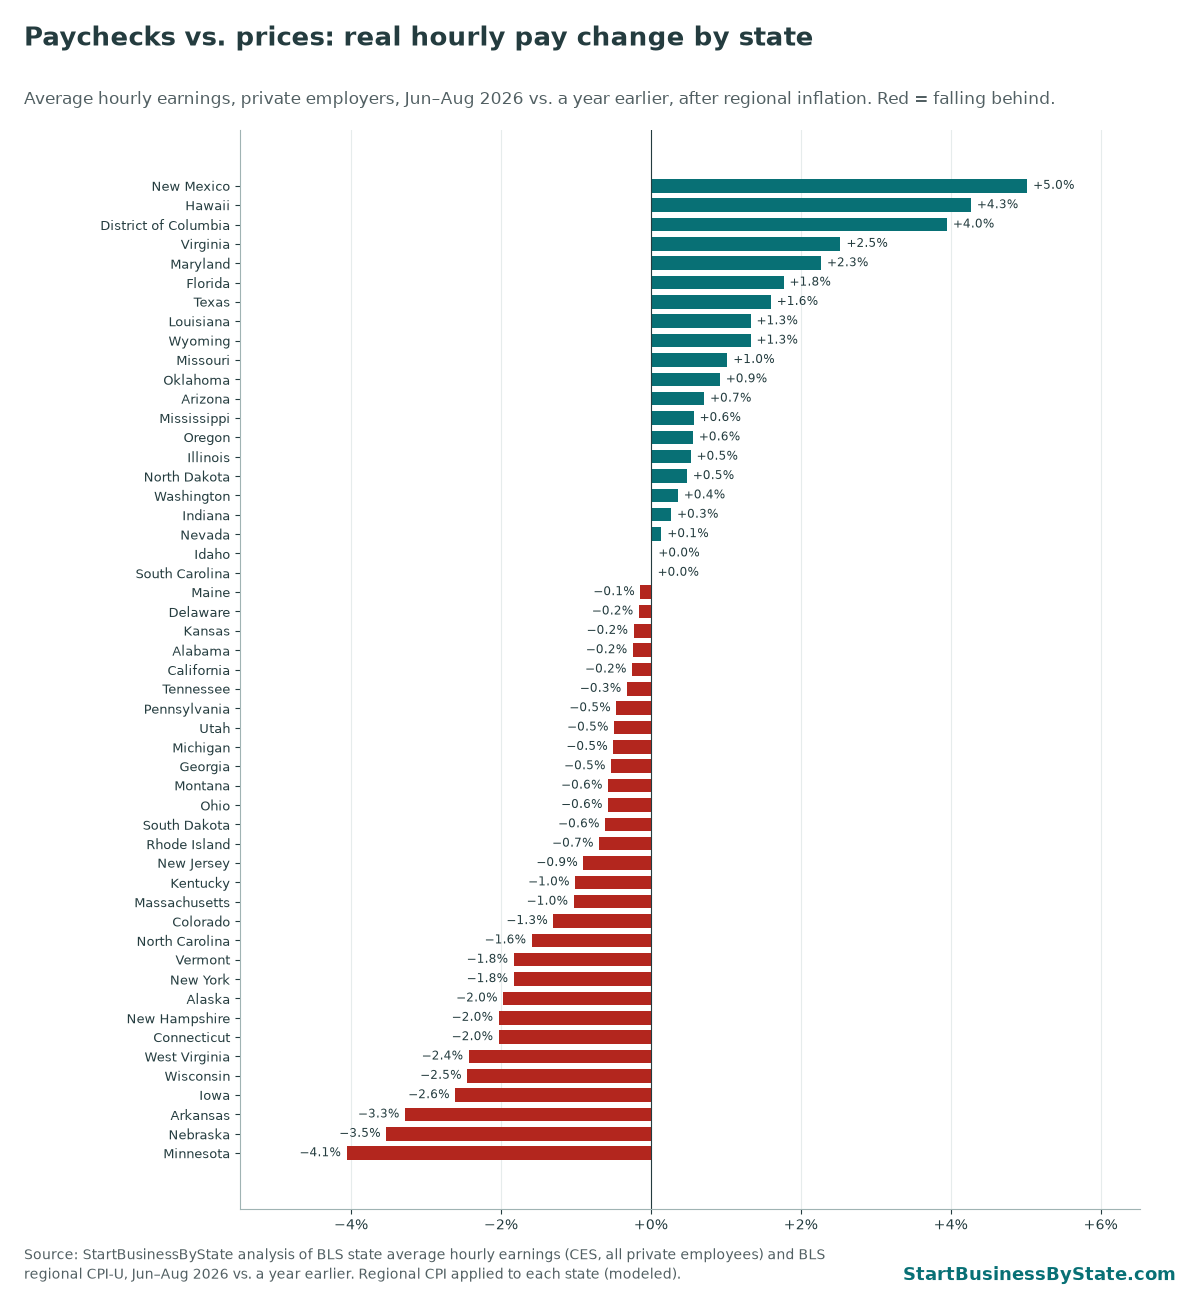
Two things push a state down this list: slow pay growth and fast regional inflation. The 10 states furthest behind break down as 4 in the Midwest, 3 in the Northeast, 2 in the South and 1 in the West. Northeast prices rose 4.1%, the most of the four regions, so a state there needed raises above that just to stay even. In Minnesota and Nebraska, average pay fell even before inflation.
Paychecks vs. inflation in every state
Click a column header to sort. The table starts with the states where real pay fell most.
| Rank | State | CPI region | Avg. hourly pay, Jun–Aug 2026 | Pay change vs. year ago | Regional inflation | Real pay change Modeled | Real change, $ per hour | Real change, August only |
|---|---|---|---|---|---|---|---|---|
| 1 | Minnesota | Midwest | $39.26 | −0.6% | 3.6% | −4.1% | −$1.60 | −3.1% |
| 2 | Nebraska | Midwest | $32.48 | −0.0% | 3.6% | −3.5% | −$1.15 | −3.2% |
| 3 | Arkansas | South | $29.71 | −0.2% | 3.2% | −3.3% | −$0.98 | −2.2% |
| 4 | Iowa | Midwest | $30.63 | +0.9% | 3.6% | −2.6% | −$0.79 | −2.4% |
| 5 | Wisconsin | Midwest | $34.28 | +1.1% | 3.6% | −2.5% | −$0.83 | −3.1% |
| 6 | West Virginia | South | $30.16 | +0.7% | 3.2% | −2.4% | −$0.73 | −1.6% |
| 7 | Connecticut | Northeast | $39.69 | +2.0% | 4.1% | −2.0% | −$0.79 | −1.8% |
| 8 | New Hampshire | Northeast | $36.00 | +2.0% | 4.1% | −2.0% | −$0.72 | −1.7% |
| 9 | Alaska | West | $38.12 | +1.1% | 3.1% | −2.0% | −$0.74 | −2.0% |
| 10 | New York | Northeast | $39.89 | +2.2% | 4.1% | −1.8% | −$0.71 | −1.1% |
| 11 | Vermont | Northeast | $35.66 | +2.2% | 4.1% | −1.8% | −$0.64 | −1.5% |
| 12 | North Carolina | South | $34.44 | +1.5% | 3.2% | −1.6% | −$0.54 | −1.4% |
| 13 | Colorado | West | $39.77 | +1.8% | 3.1% | −1.3% | −$0.51 | −0.2% |
| 14 | Massachusetts | Northeast | $43.14 | +3.0% | 4.1% | −1.0% | −$0.43 | −0.2% |
| 15 | Kentucky | South | $30.60 | +2.1% | 3.2% | −1.0% | −$0.30 | −0.8% |
| 16 | New Jersey | Northeast | $39.08 | +3.1% | 4.1% | −0.9% | −$0.34 | +0.1% |
| 17 | Rhode Island | Northeast | $37.67 | +3.4% | 4.1% | −0.7% | −$0.25 | +0.4% |
| 18 | South Dakota | Midwest | $31.96 | +3.0% | 3.6% | −0.6% | −$0.19 | +0.4% |
| 19 | Ohio | Midwest | $34.07 | +3.0% | 3.6% | −0.6% | −$0.19 | +0.7% |
| 20 | Montana | West | $33.18 | +2.6% | 3.1% | −0.6% | −$0.18 | +0.0% |
| 21 | Georgia | South | $35.50 | +2.6% | 3.2% | −0.5% | −$0.18 | +0.6% |
| 22 | Michigan | Midwest | $34.14 | +3.1% | 3.6% | −0.5% | −$0.17 | +0.6% |
| 23 | Utah | West | $35.76 | +2.6% | 3.1% | −0.5% | −$0.17 | −0.8% |
| 24 | Pennsylvania | Northeast | $33.72 | +3.6% | 4.1% | −0.5% | −$0.15 | +0.2% |
| 25 | Tennessee | South | $31.84 | +2.8% | 3.2% | −0.3% | −$0.10 | +0.2% |
| 26 | California | West | $42.38 | +2.9% | 3.1% | −0.2% | −$0.10 | −0.1% |
| 27 | Alabama | South | $32.31 | +2.9% | 3.2% | −0.2% | −$0.08 | +0.2% |
| 28 | Kansas | Midwest | $32.77 | +3.4% | 3.6% | −0.2% | −$0.07 | +1.3% |
| 29 | Delaware | South | $33.70 | +3.0% | 3.2% | −0.2% | −$0.05 | +0.4% |
| 30 | Maine | Northeast | $33.59 | +3.9% | 4.1% | −0.1% | −$0.05 | +0.3% |
| 31 | South Carolina | South | $33.02 | +3.2% | 3.2% | +0.0% | +$0.00 | −0.7% |
| 32 | Idaho | West | $35.32 | +3.2% | 3.1% | +0.0% | +$0.01 | +0.8% |
| 33 | Nevada | West | $33.39 | +3.3% | 3.1% | +0.1% | +$0.05 | +0.5% |
| 34 | Indiana | Midwest | $33.23 | +3.9% | 3.6% | +0.3% | +$0.09 | +0.2% |
| 35 | Washington | West | $43.81 | +3.5% | 3.1% | +0.4% | +$0.15 | +0.2% |
| 36 | North Dakota | Midwest | $35.83 | +4.1% | 3.6% | +0.5% | +$0.17 | −0.1% |
| 37 | Illinois | Midwest | $36.62 | +4.2% | 3.6% | +0.5% | +$0.19 | +1.1% |
| 38 | Oregon | West | $38.52 | +3.7% | 3.1% | +0.6% | +$0.21 | +0.7% |
| 39 | Mississippi | South | $29.18 | +3.7% | 3.2% | +0.6% | +$0.16 | +1.9% |
| 40 | Arizona | West | $36.17 | +3.9% | 3.1% | +0.7% | +$0.25 | +1.3% |
| 41 | Oklahoma | South | $32.04 | +4.1% | 3.2% | +0.9% | +$0.28 | +0.6% |
| 42 | Missouri | Midwest | $33.96 | +4.7% | 3.6% | +1.0% | +$0.33 | +2.5% |
| 43 | Wyoming | West | $33.19 | +4.5% | 3.1% | +1.3% | +$0.42 | +1.9% |
| 44 | Louisiana | South | $30.94 | +4.5% | 3.2% | +1.3% | +$0.39 | +2.6% |
| 45 | Texas | South | $36.01 | +4.8% | 3.2% | +1.6% | +$0.55 | +2.7% |
| 46 | Florida | South | $36.06 | +5.0% | 3.2% | +1.8% | +$0.61 | +2.1% |
| 47 | Maryland | South | $37.94 | +5.5% | 3.2% | +2.3% | +$0.81 | +3.3% |
| 48 | Virginia | South | $38.49 | +5.8% | 3.2% | +2.5% | +$0.92 | +3.4% |
| 49 | District of Columbia | South | $58.10 | +7.2% | 3.2% | +4.0% | +$2.14 | +4.7% |
| 50 | Hawaii | West | $40.34 | +7.5% | 3.1% | +4.3% | +$1.60 | +5.9% |
| 51 | New Mexico | West | $31.30 | +8.3% | 3.1% | +5.0% | +$1.45 | +4.4% |
Average hourly earnings of all private employees, not seasonally adjusted, three-month average. BLS did not publish an October 2025 CPI because of the federal shutdown, so the national chart skips that month. Regional inflation is the CPI-U for the state’s Census region over the same months. “Real change, $ per hour” is the latest average pay converted to year-ago prices, minus year-ago pay.
Download the data (CSV)Are U.S. wages keeping up with inflation?
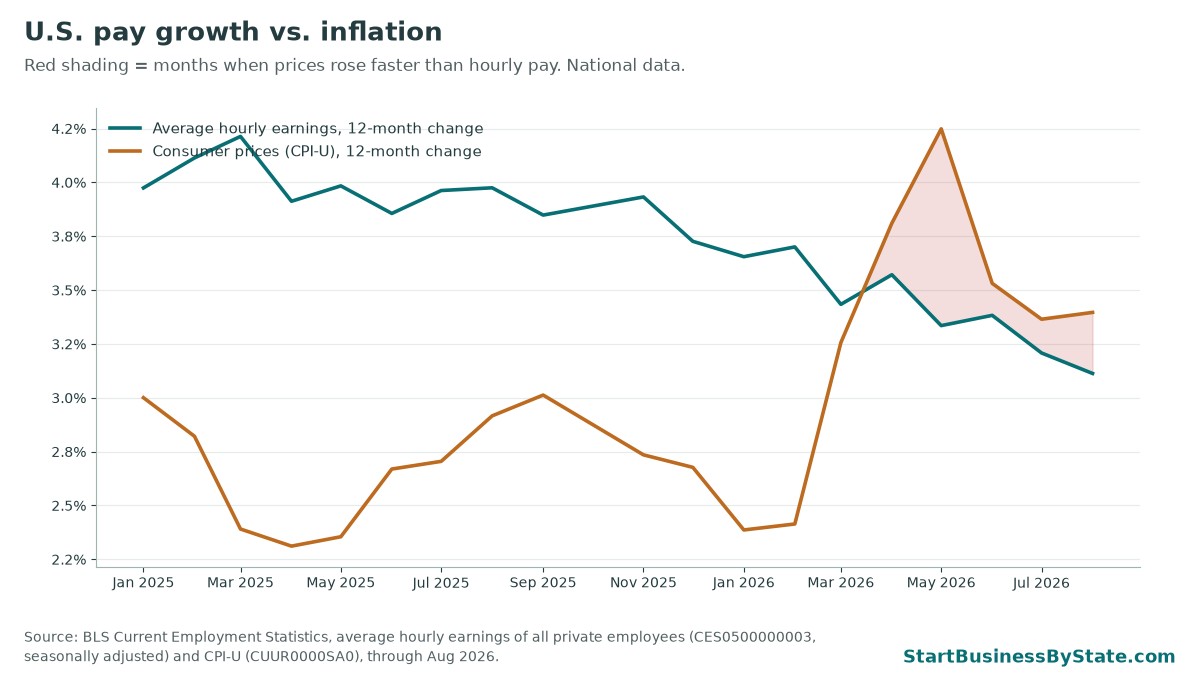
The national line hides wide swings. A state average can rise fast because low-wage jobs disappeared, not because anyone got a raise. That is one reason we use three-month averages and show the single-month figure next to them.
What falling real wages mean for your business
For a service firm adjusting pay and customer prices, make the written terms and coverage budget match the plan. Review landscaping customer agreements for recurring work and cleaning-business insurance for payroll-related coverage costs.
When prices outrun pay, two things happen at once. Your workers feel poorer, and so do your customers. Both affect a small service business quickly.
- Hiring and keeping staff. In states near the top of this table, a worker who gets no raise is losing money every month. Expect more people to leave for an extra dollar an hour. Check what employers near you pay with our service employer pay by state data and service wages vs. fair market rent.
- Cleaning services. Labor is usually your biggest cost. If you raise pay, raise prices in the same month. See what share of revenue goes to payroll in cleaning business payroll percentage.
- Daycares. Teachers can earn more in retail in many states, and parents are squeezed too. Our daycare wage vs. price by state report shows the gap.
- Salons and barbers. Clients who feel squeezed stretch time between visits. Run your numbers with the salon break-even calculator before you change prices.
- Landscaping and HVAC. Homeowners delay jobs they can put off. Recurring service plans hold up better than one-off jobs. See how to price an HVAC maintenance agreement.
Minimum wage changes on January 1 will lift the bottom of the pay scale in many states. See minimum wage by state in 2027 and the real minimum wage by state.
How we did this
- Pay. BLS Current Employment Statistics (State and Metro Area), average hourly earnings of all employees, total private, series SMU[state FIPS]000000500000003, not seasonally adjusted. Months: Jun 2026, Jul 2026, Aug 2026 vs. Jun 2025, Jul 2025, Aug 2025. The latest month is preliminary and will be revised.
- Prices. BLS Consumer Price Index for All Urban Consumers, all items, not seasonally adjusted: Northeast CUUR0100SA0, Midwest CUUR0200SA0, South CUUR0300SA0, West CUUR0400SA0, U.S. city average CUUR0000SA0. Same months.
- National line. BLS CES average hourly earnings, total private, CES0500000003 (seasonally adjusted), through September 2026.
- Math. Real change = (1 + pay change) ÷ (1 + regional price change) − 1. Yearly buying power = real hourly change in dollars × 2,080 hours.
Caveats
- State earnings come from a sample of employers and move around from month to month, especially in small states. Three-month averages reduce, but do not remove, that noise.
- Average hourly earnings change when the mix of jobs changes. If low-wage jobs are cut, the average rises even if no one got a raise.
- Earnings are not seasonally adjusted, so we compare the same months a year apart.
- BLS revises state data each March. Numbers here will change.
BLS data is public domain. This page has no ads or affiliate links. Cite as: StartBusinessByState, “Paychecks vs. Inflation by State,” updated October 6, 2026, https://startbusinessbystate.com/paychecks-vs-inflation-by-state/
Related research
- Wages by state: what common service jobs pay.
- Real minimum wage by state: the minimum wage after local prices.
- Minimum wage 2027 vs. what workers earn.
- Regional price parities, wages and daycare.
- Labor market tightness by state.
- clothing spending per person: what residents of each state spent on clothes and shoes in 2025.
Your next step: plan staffing for a cleaning business
FAQ
Are wages keeping up with inflation in 2026?
Nationally, barely. Private-sector average hourly earnings rose 3.0% in the year to September 2026, and consumer prices rose 3.4% in the year to August 2026. In 30 of 51 states (with DC), pay growth fell short of regional inflation over Jun–Aug 2026.
Which state has the worst real wage decline?
Minnesota. Average hourly earnings for private employees rose -0.6% over Jun–Aug 2026 compared with a year earlier, while Midwest consumer prices rose 3.6%. That leaves real hourly pay down 4.1%.
Why do you use regional inflation instead of state inflation?
The Bureau of Labor Statistics does not publish a consumer price index for each state. It publishes indexes for four Census regions and some large metro areas. We apply each region’s index to every state in it, so the real pay numbers are modeled estimates.
What does “average hourly earnings” include?
It is total payroll for private-sector employees divided by hours paid, from the BLS Current Employment Statistics survey of employers. It includes overtime and regular bonuses paid each period. It does not include the self-employed, government workers or benefits.
Should I raise wages if prices are rising faster than pay?
If your workers are falling behind, they are more likely to leave for a small raise elsewhere. Compare your pay with your state’s average and local rents before you decide. Replacing a worker usually costs more than a modest raise, but every business has to check its own margins.
How often is this updated?
Monthly. BLS releases state earnings about three weeks after the end of each month and the consumer price index about two weeks after. The next CPI release is October 14, 2026.
Last updated October 6, 2026. State earnings and regional CPI through August 2026.