Research edition: September 16, 2026 · HUD Fair Market Rent FY2026 (2BR county median) · BLS OEWS May 2025 median hourly wages
This page is about service wages and apartment rent — how many hours of cleaner / maid, janitor, landscaping, or HVAC median pay cover one month of a state’s county-median 2-bedroom Fair Market Rent. It is not a Fair Market Rent vs daycare or childcare-price study (see FMR vs daycare prices for that pairing). A typical maid or housekeeper needs about 69 hours of median wage to cover one month of FMR — roughly 40% of a conventional full-time month. High-rent markets push that past 100 hours. Low-wage states are not automatically the hardest once rent is in the denominator.
We join the same HUD FY2026 county-median 2BR FMR rollup used on our Fair Market Rent vs daycare prices page with the OEWS May 2025 occupation medians on service-business wages by state. Distinct from daycare wages vs parent prices (caregiver pay vs tuition): here the denominator is housing, not childcare prices. For the same FY2026 rents at metro/MSA grain (QCEW industry pay × HUD metro 2BR FMR), see metro service pay vs Fair Market Rent. For ACS owner-occupied housing stock and young-child household demand context (not wages vs rent), see home-services demand by state.
Primary sources: HUD Fair Market Rents via the HUD User FMR API; BLS Occupational Employment and Wage Statistics (May 2025 state estimates).
What hours-to-rent shows
Across 51 states and D.C., the median county-median 2BR FMR is $1,086/month. For Maids and Housekeeping Cleaners (SOC 37-2012), the median hours to cover that rent is 69.1 at a median wage of $16.62/hr.
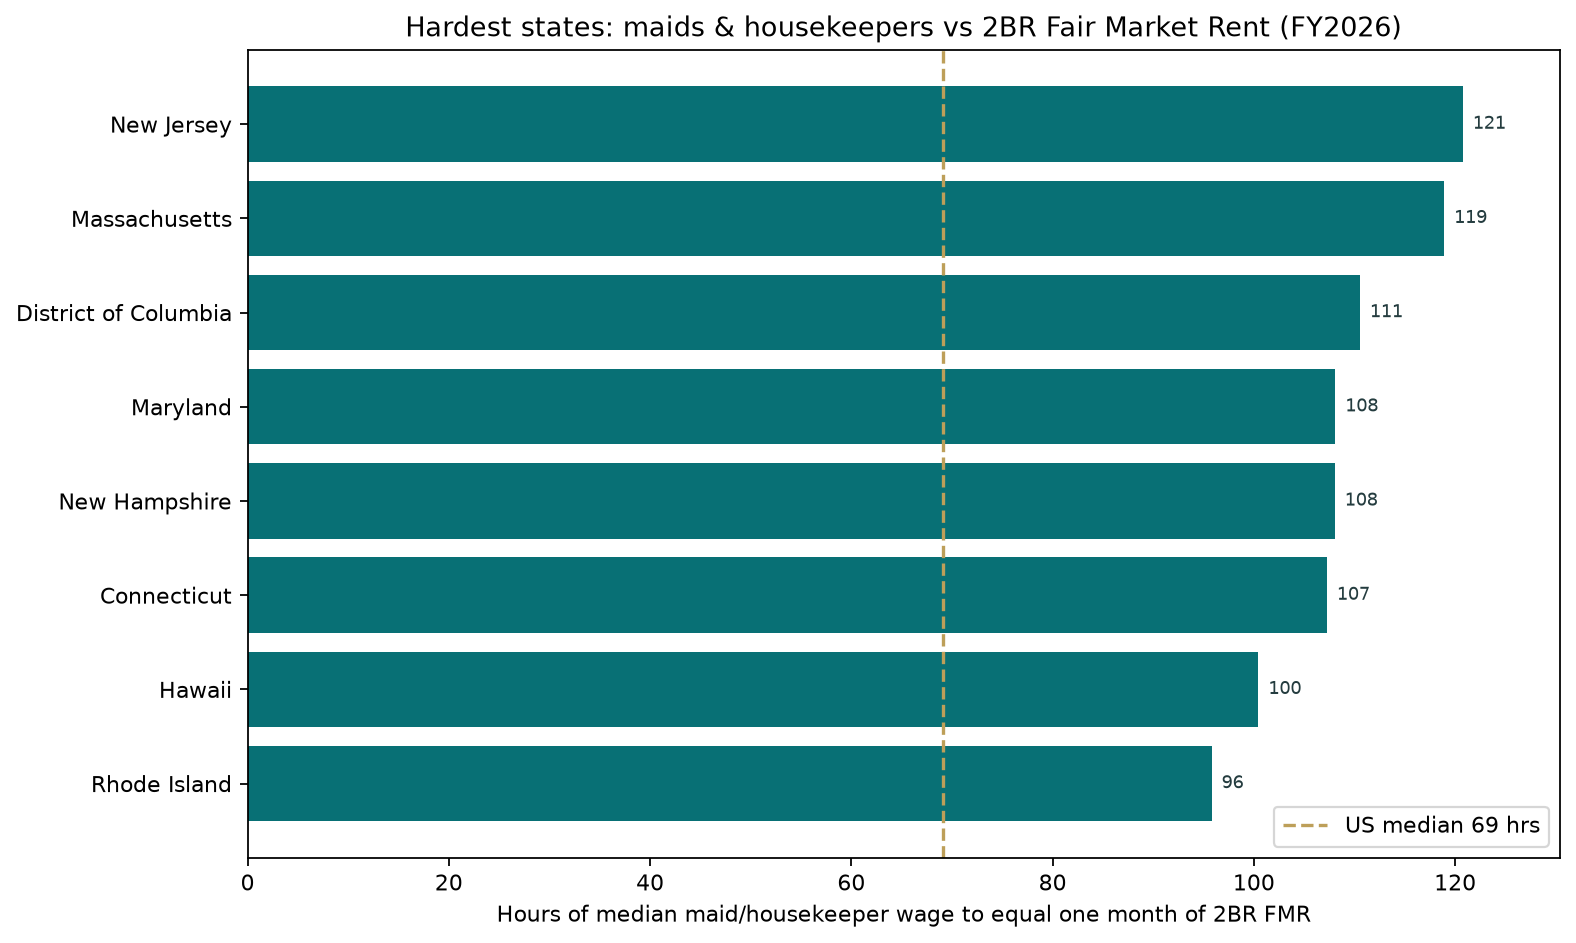
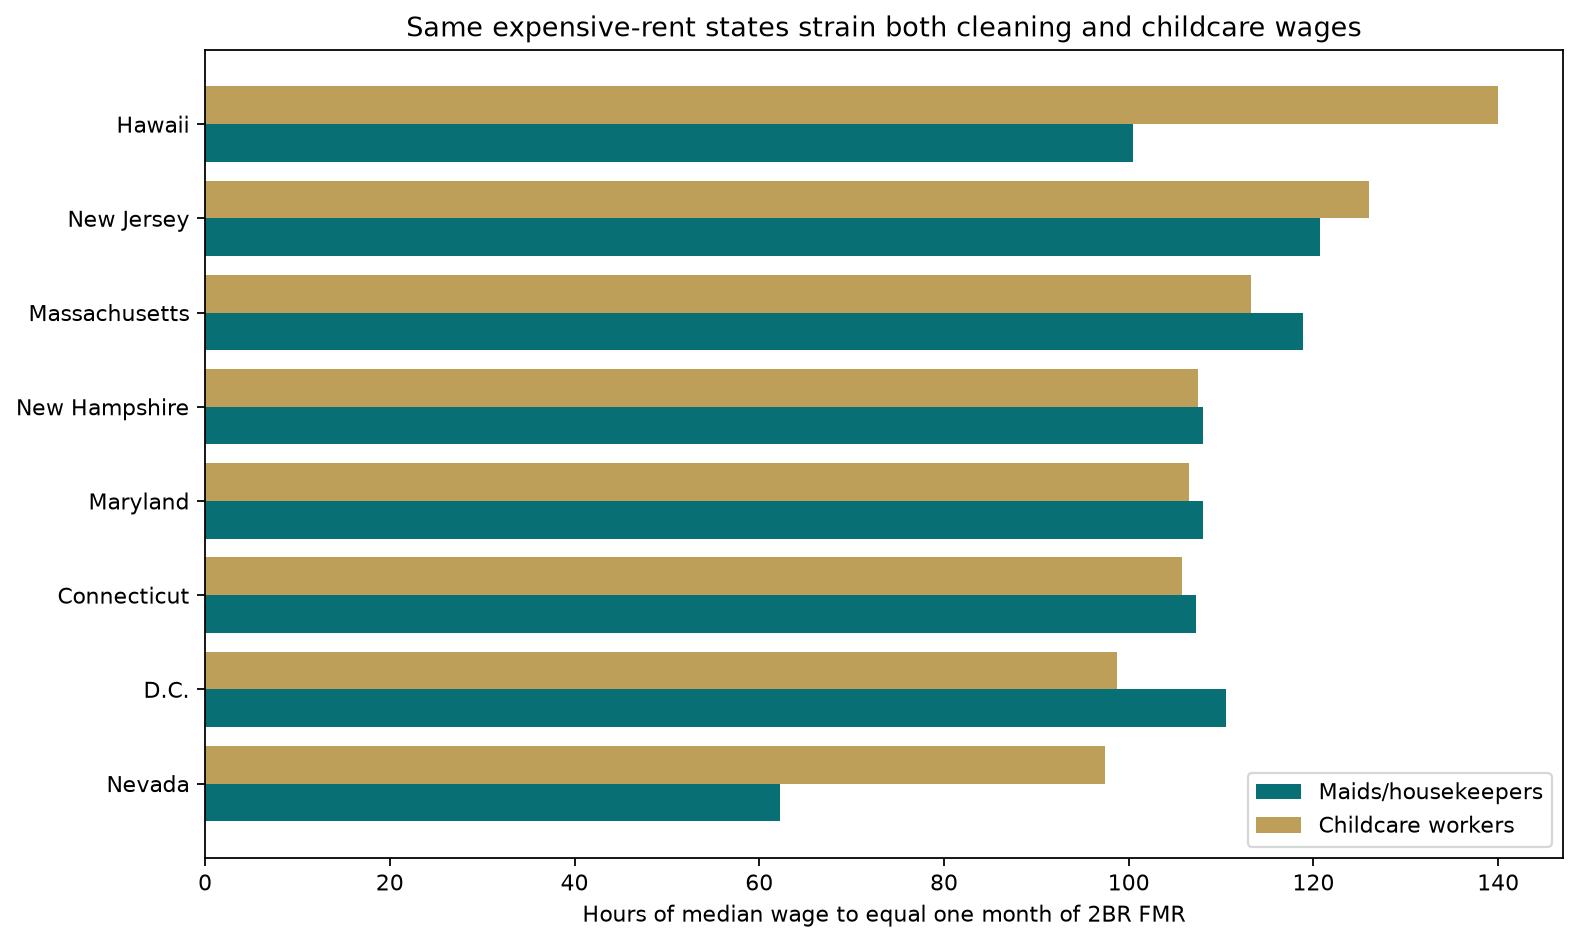
- Hardest hours-to-rent (maids): New Jersey, Massachusetts, D.C., Maryland, and New Hampshire all exceed 100 hours of median wage per month of FMR — high-rent geography, not the lowest wages.
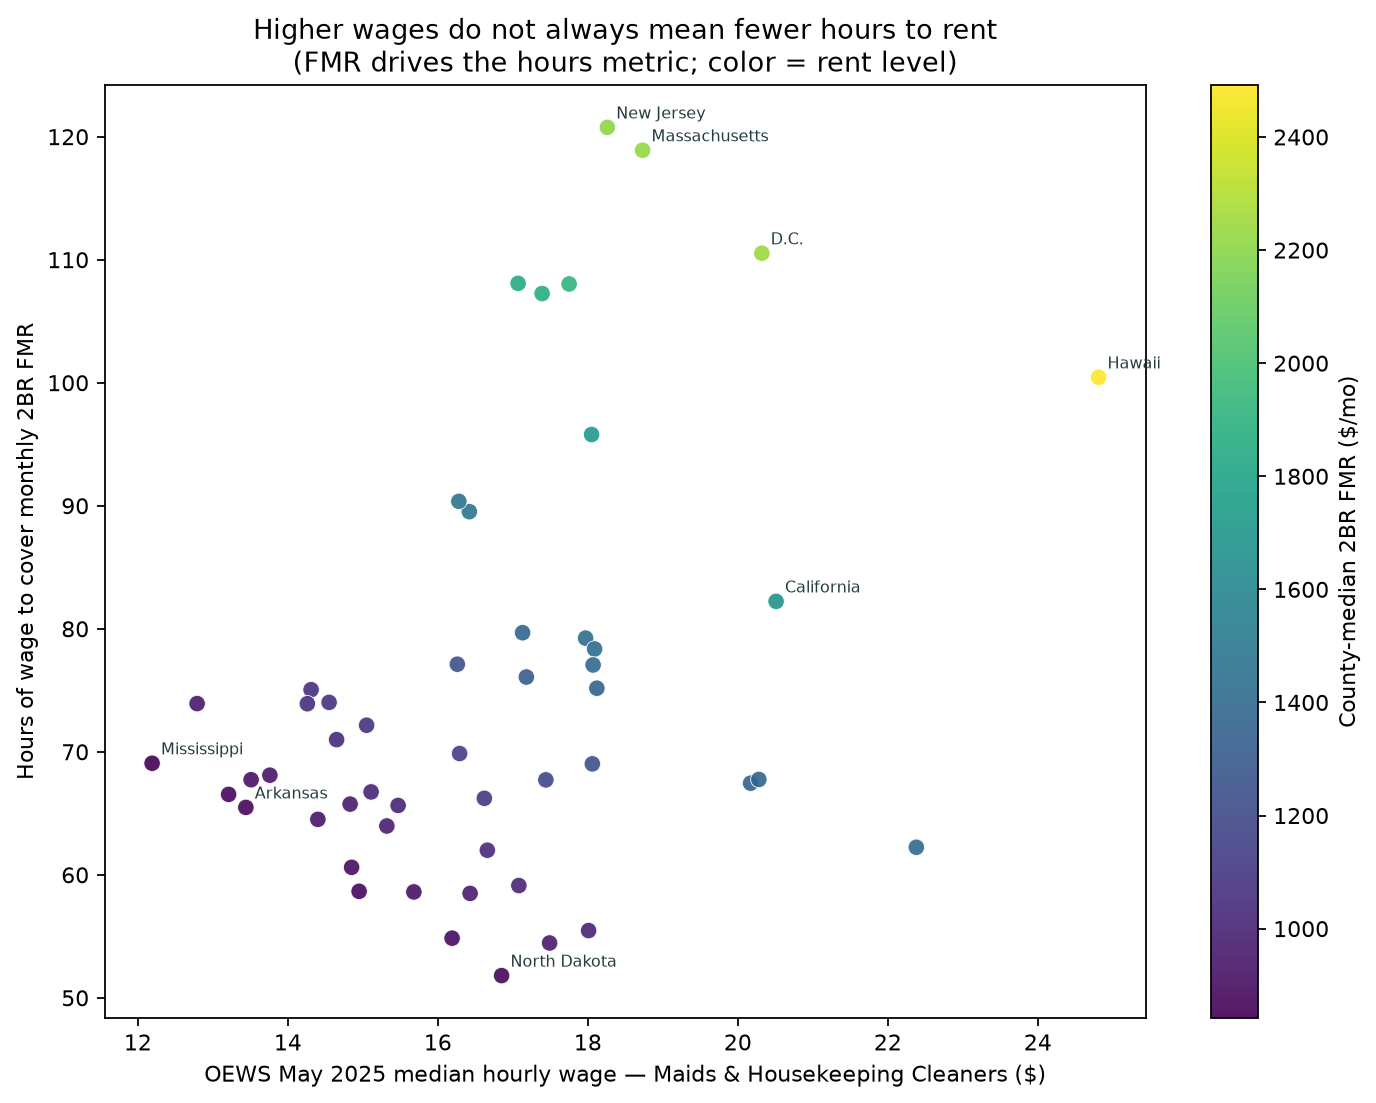
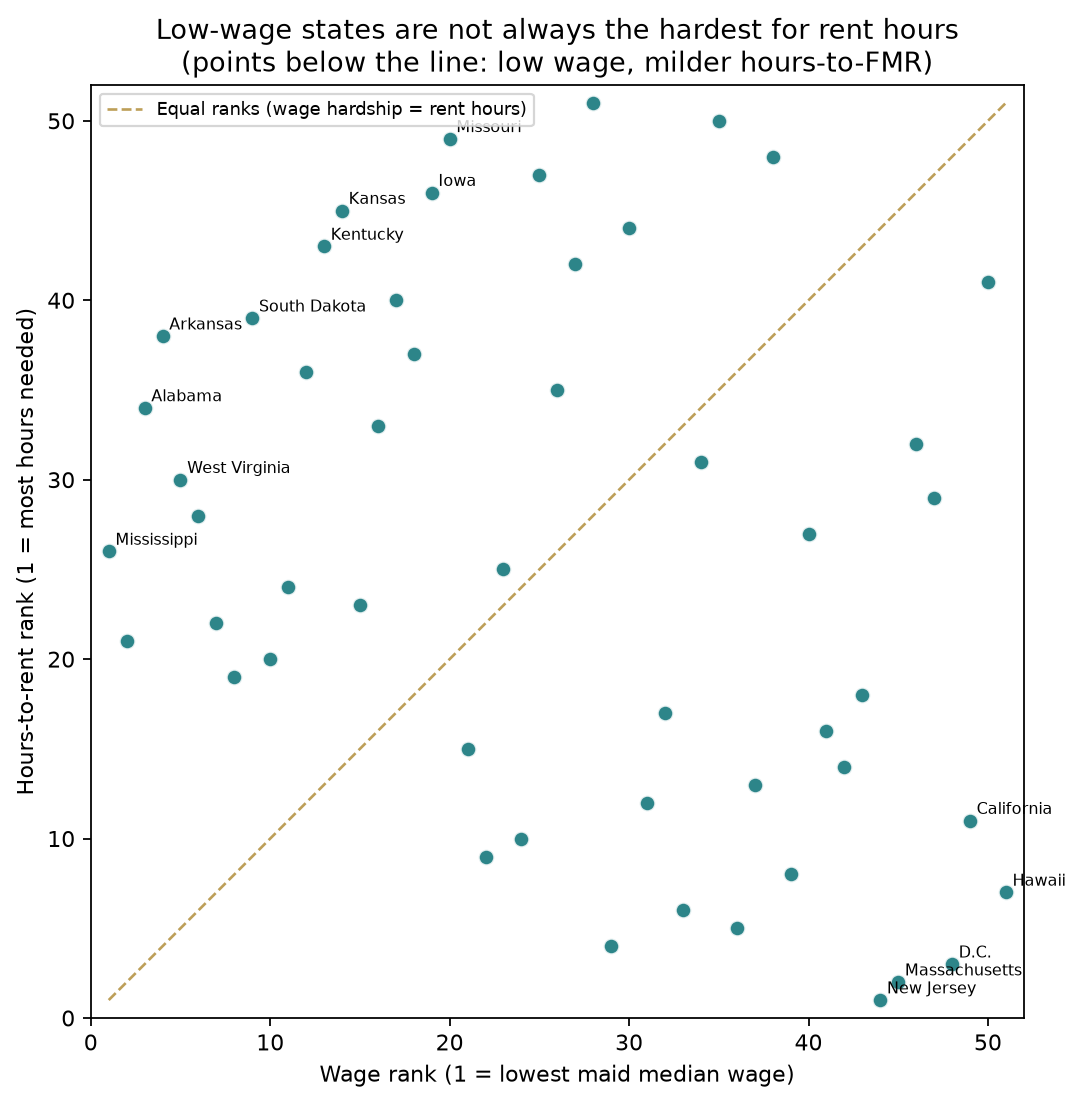
- Hypothesis check: None of the ten lowest maid-wage states appear in the ten hardest hours-to-rent states. FMR correlates with hours-to-rent at Pearson 0.91; wage alone only 0.36.
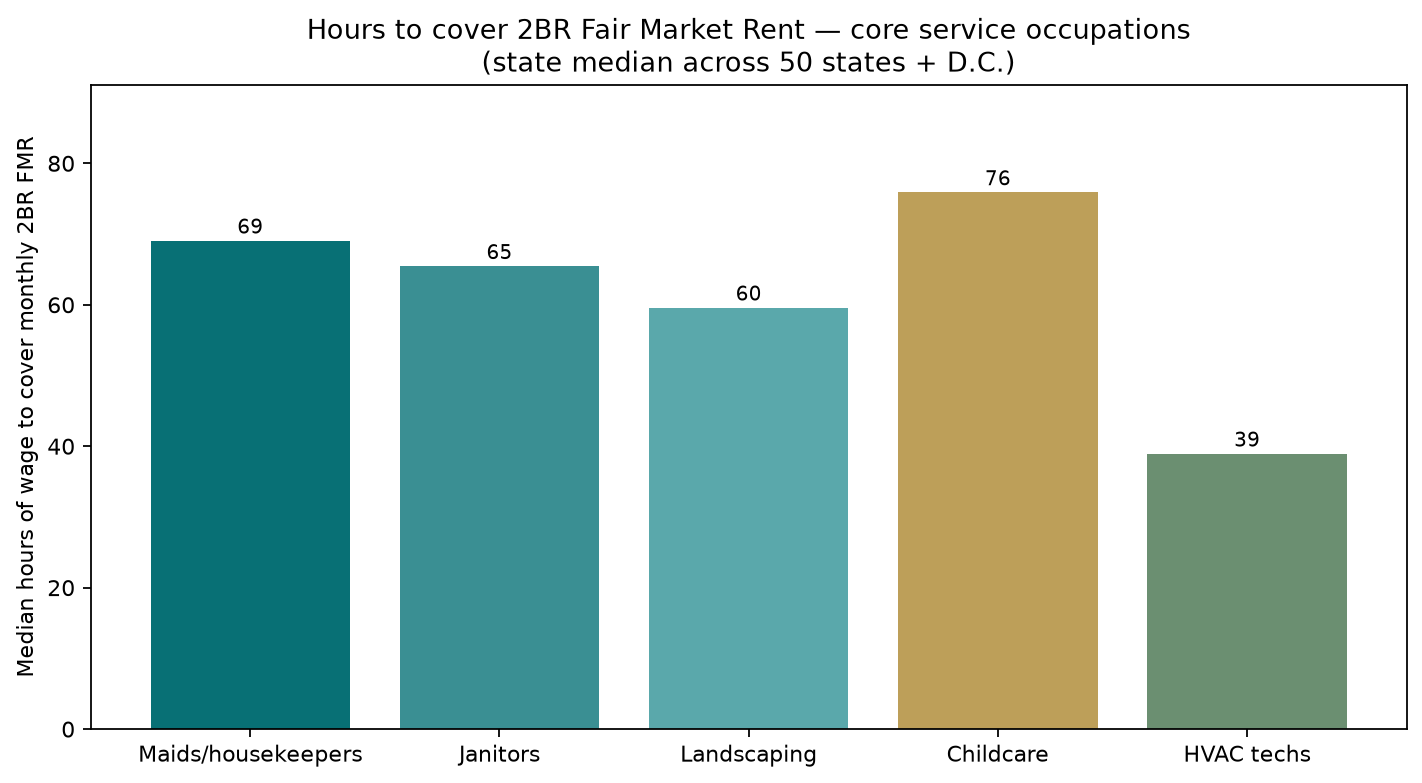
- Core occupations (state median hours): childcare 75.9; maids 69.1; janitors 65.5; landscaping 59.6; HVAC techs 39.0. HVAC roughly halves the burden versus childcare — but Hawaii still needs ~79 HVAC hours.
- Childcare workers (SOC 39-9011): median 75.9 hours; hardest Hawaii (140), New Jersey (126), Massachusetts (113).
Highest maid hours-to-2BR-FMR:
- New Jersey: 120.8 hours ($18.26/hr median vs $2,205/mo 2BR FMR).
- Massachusetts: 118.9 hours ($18.73/hr median vs $2,227/mo 2BR FMR).
- District of Columbia: 110.5 hours ($20.32/hr median vs $2,246/mo 2BR FMR).
- Maryland: 108.1 hours ($17.07/hr median vs $1,845/mo 2BR FMR).
- New Hampshire: 108.0 hours ($17.75/hr median vs $1,918/mo 2BR FMR).
Largest negative rank gaps (low wage rank but milder hours-to-rent — hypothesis support):
- Arkansas: wage-lowest rank #4 vs hours-hardest rank #38 (gap -34; $13.44/hr, 65.5 hrs, $880 FMR).
- Alabama: wage-lowest rank #3 vs hours-hardest rank #34 (gap -31; $13.21/hr, 66.5 hrs, $879 FMR).
- Kansas: wage-lowest rank #14 vs hours-hardest rank #45 (gap -31; $14.95/hr, 58.7 hrs, $877 FMR).
- Kentucky: wage-lowest rank #13 vs hours-hardest rank #43 (gap -30; $14.85/hr, 60.6 hrs, $900 FMR).
- South Dakota: wage-lowest rank #9 vs hours-hardest rank #39 (gap -30; $14.40/hr, 64.5 hrs, $929 FMR).
Read FMR and wages carefully. Fair Market Rent is HUD’s program rent estimate (around the 40th percentile of recent-mover gross rents) — not current asking rent and not commercial shop rent. OEWS medians are occupation wages for one earner, not total compensation or owner draw. Hours use monthly FMR ÷ hourly median; the “% of full-time month” uses 2080÷12 ≈ 173.33 hours as an arithmetic convention only.
Charts
State-by-state table
Default sort: maid hours-to-rent, high to low. State names link to our state hubs (cross-industry). Full occupation detail — including cooks, cosmetologists, tree trimmers, massage therapists, and private investigators — is in the CSV download.
Showing 51 rows (50 states + D.C.).
| State | 2BR FMR, $/mo | Maids $/hr | Maids hours | Maids % of FT mo. | Childcare hours | Janitors hours | Landscaping hours | HVAC hours | Maids hours rank | Maids low-wage rank | Rank gap |
|---|---|---|---|---|---|---|---|---|---|---|---|
| New Jersey | $2,205 | $18.26 | 120.8 | 69.7% | 126.1 | 121.9 | 110.9 | 61.6 | 1 | 44 | 43 |
| Massachusetts | $2,227 | $18.73 | 118.9 | 68.6% | 113.3 | 101.6 | 95.2 | 59.9 | 2 | 45 | 43 |
| District of Columbia | $2,246 | $20.32 | 110.5 | 63.8% | 98.7 | 121.3 | 95.7 | 55.4 | 3 | 48 | 45 |
| Maryland | $1,845 | $17.07 | 108.1 | 62.4% | 106.5 | 104.8 | 97.5 | 54.8 | 4 | 29 | 25 |
| New Hampshire | $1,918 | $17.75 | 108.0 | 62.3% | 107.5 | 101.9 | 88.9 | 54.0 | 5 | 36 | 31 |
| Connecticut | $1,865 | $17.39 | 107.2 | 61.9% | 105.8 | 102.2 | 84.8 | 50.6 | 6 | 33 | 27 |
| Hawaii | $2,492 | $24.81 | 100.4 | 57.9% | 140.0 | 137.4 | 112.9 | 79.2 | 7 | 51 | 44 |
| Rhode Island | $1,729 | $18.05 | 95.8 | 55.3% | 97.3 | 96.4 | 80.4 | 53.4 | 8 | 39 | 31 |
| Florida | $1,471 | $16.28 | 90.4 | 52.1% | 89.4 | 88.7 | 82.5 | 54.0 | 9 | 22 | 13 |
| Delaware | $1,470 | $16.42 | 89.5 | 51.6% | 92.0 | 86.6 | 81.8 | 49.1 | 10 | 24 | 14 |
| California | $1,686 | $20.51 | 82.2 | 47.4% | 87.7 | 85.4 | 77.0 | 48.4 | 11 | 49 | 38 |
| Arizona | $1,365 | $17.13 | 79.7 | 46.0% | 80.9 | 78.4 | 73.0 | 47.8 | 12 | 31 | 19 |
| Alaska | $1,424 | $17.97 | 79.2 | 45.7% | 81.8 | 73.1 | 62.1 | 38.2 | 13 | 37 | 24 |
| Maine | $1,418 | $18.09 | 78.4 | 45.2% | 81.1 | 75.7 | 64.1 | 46.7 | 14 | 42 | 28 |
| Virginia | $1,254 | $16.26 | 77.1 | 44.5% | 76.0 | 74.2 | 67.9 | 43.7 | 15 | 21 | 6 |
| Oregon | $1,392 | $18.07 | 77.1 | 44.5% | 75.0 | 73.6 | 64.3 | 46.0 | 16 | 41 | 25 |
| Montana | $1,307 | $17.18 | 76.1 | 43.9% | 77.4 | 73.3 | 60.0 | 44.7 | 17 | 32 | 15 |
| Vermont | $1,362 | $18.12 | 75.2 | 43.4% | 74.5 | 69.2 | 61.3 | 45.6 | 18 | 43 | 25 |
| Georgia | $1,074 | $14.31 | 75.0 | 43.3% | 79.7 | 65.1 | 58.9 | 39.6 | 19 | 8 | -11 |
| South Carolina | $1,077 | $14.55 | 74.0 | 42.7% | 75.5 | 71.8 | 61.0 | 39.6 | 20 | 10 | -10 |
| Louisiana | $946 | $12.79 | 73.9 | 42.6% | 85.9 | 68.0 | 56.4 | 33.5 | 21 | 2 | -19 |
| Texas | $1,054 | $14.26 | 73.9 | 42.6% | 76.8 | 66.4 | 59.7 | 38.0 | 22 | 7 | -15 |
| North Carolina | $1,086 | $15.05 | 72.2 | 41.6% | 77.5 | 65.5 | 59.6 | 39.5 | 23 | 15 | -8 |
| New Mexico | $1,040 | $14.65 | 71.0 | 41.0% | 60.4 | 60.0 | 57.6 | 43.0 | 24 | 11 | -13 |
| Pennsylvania | $1,138 | $16.29 | 69.9 | 40.3% | 78.5 | 64.8 | 59.9 | 37.9 | 25 | 23 | -2 |
| Mississippi | $842 | $12.19 | 69.1 | 39.8% | 79.4 | 61.7 | 55.4 | 36.0 | 26 | 1 | -25 |
| Colorado | $1,246 | $18.06 | 69.0 | 39.8% | 63.6 | 67.2 | 56.7 | 39.8 | 27 | 40 | 13 |
| Oklahoma | $937 | $13.76 | 68.1 | 39.3% | 70.3 | 62.6 | 54.5 | 33.9 | 28 | 6 | -22 |
| Washington | $1,374 | $20.28 | 67.8 | 39.1% | 68.6 | 62.8 | 60.9 | 37.8 | 29 | 47 | 18 |
| West Virginia | $915 | $13.51 | 67.7 | 39.1% | 68.7 | 61.4 | 59.0 | 39.0 | 30 | 5 | -25 |
| Utah | $1,181 | $17.44 | 67.7 | 39.1% | 77.7 | 76.3 | 60.3 | 41.8 | 31 | 34 | 3 |
| New York | $1,360 | $20.17 | 67.5 | 38.9% | 75.3 | 68.0 | 63.1 | 38.0 | 32 | 46 | 14 |
| Indiana | $1,008 | $15.11 | 66.7 | 38.5% | 69.5 | 57.5 | 55.1 | 34.7 | 33 | 16 | -17 |
| Alabama | $879 | $13.21 | 66.5 | 38.4% | 80.5 | 59.7 | 51.3 | 37.8 | 34 | 3 | -31 |
| Idaho | $1,100 | $16.62 | 66.2 | 38.2% | 75.9 | 63.4 | 55.0 | 40.7 | 35 | 26 | -9 |
| Tennessee | $975 | $14.83 | 65.8 | 37.9% | 68.4 | 60.6 | 54.8 | 36.5 | 36 | 12 | -24 |
| Ohio | $1,016 | $15.47 | 65.6 | 37.9% | 71.2 | 58.8 | 55.2 | 33.8 | 37 | 18 | -19 |
| Arkansas | $880 | $13.44 | 65.5 | 37.8% | 64.3 | 61.5 | 51.2 | 38.0 | 38 | 4 | -34 |
| South Dakota | $929 | $14.40 | 64.5 | 37.2% | 69.2 | 54.5 | 54.6 | 31.5 | 39 | 9 | -30 |
| Wyoming | $980 | $15.32 | 64.0 | 36.9% | 72.2 | 56.5 | 53.2 | 37.3 | 40 | 17 | -23 |
| Nevada | $1,393 | $22.38 | 62.2 | 35.9% | 97.4 | 75.4 | 74.7 | 47.9 | 41 | 50 | 9 |
| Michigan | $1,033 | $16.66 | 62.0 | 35.8% | 69.4 | 59.6 | 56.4 | 35.3 | 42 | 27 | -15 |
| Kentucky | $900 | $14.85 | 60.6 | 35.0% | 64.8 | 57.9 | 51.0 | 31.9 | 43 | 13 | -30 |
| Wisconsin | $1,010 | $17.08 | 59.1 | 34.1% | 64.7 | 56.8 | 51.0 | 34.0 | 44 | 30 | -14 |
| Kansas | $877 | $14.95 | 58.7 | 33.8% | 62.4 | 52.9 | 46.4 | 30.2 | 45 | 14 | -31 |
| Iowa | $919 | $15.68 | 58.6 | 33.8% | 67.3 | 54.0 | 49.1 | 31.5 | 46 | 19 | -27 |
| Nebraska | $961 | $16.43 | 58.5 | 33.7% | 65.0 | 55.7 | 51.1 | 33.4 | 47 | 25 | -22 |
| Minnesota | $999 | $18.01 | 55.5 | 32.0% | 58.5 | 52.5 | 44.6 | 27.2 | 48 | 38 | -10 |
| Missouri | $888 | $16.19 | 54.9 | 31.6% | 60.0 | 51.5 | 48.0 | 30.8 | 49 | 20 | -29 |
| Illinois | $952 | $17.49 | 54.5 | 31.4% | 55.3 | 52.4 | 45.2 | 25.6 | 50 | 35 | -15 |
| North Dakota | $873 | $16.85 | 51.8 | 29.9% | 60.0 | 48.1 | 44.5 | 24.4 | 51 | 28 | -23 |
Hours = monthly 2BR FMR ÷ hourly median. % of FT month uses 173.33 hours (2080÷12). Hours rank 1 = most hours needed. Low-wage rank 1 = lowest wage. Rank gap = low-wage rank − hours rank (negative = low wage but milder rent hours). FMR is not asking rent; one earner; medians not means.
Use this for service-business planning — without treating FMR as your rent quote
Hours-to-rent is a labor-market affordability lens for workers and a wage-context check for owners hiring in high-rent states. It is not a P&L, staffing model, or “best state” ranking.
- Absolute occupation wages: service-business wages by state (same OEWS May 2025 SOCs).
- Housing vs childcare prices (different pairing): Fair Market Rent vs daycare prices.
- Caregiver wage vs parent tuition: daycare wages vs parent prices.
- Industry guides: how to start a cleaning business, landscaping, HVAC, daycare.
- Insurance next steps: cleaning business insurance, landscaping business insurance, HVAC insurance, daycare insurance.
Related research: HUD income limits vs daycare costs — childcare prices against Section 8 / AMI income thresholds (companion to FMR studies).
Download, methods, and limitations
Download wide state table (CSV) ·
Long state×occupation CSV ·
Hardest-hours chart ·
Wage vs hours scatter ·
Rank-gap chart ·
Core occupations chart
Sources. Housing: HUD User FMR API fmr/statedata/{ST}?year=2026, Two-Bedroom field, fiscal year 2026 — same archived county extracts as our Fair Market Rent vs daycare prices study (cross-checked identical). Wages: BLS OEWS May 2025 state estimates for the SOC list on wages-by-state (39-9011, 37-2012, 37-2011, 35-2014, 39-5012, 37-3011, 37-3013, 49-9021, 31-9011, 33-9021).
State FMR rollup. Primary metric = unweighted median of county 2BR FMRs. Town-level rows collapsed to county median first. Not population-weighted in this edition.
Constructed metrics. hours_to_2br_fmr = monthly FMR ÷ hourly median. pct_of_ft_month_173 = hours ÷ (2080÷12) × 100. Rank gap = low-wage rank − hours-hardest rank.
Limitations. FMR ≠ asking rent, owner costs, or commercial lease rates. One earner; medians not means; wages ≠ total labor cost. Statewide county median ≠ every metro. Suppressions shown as unavailable. Not a best-state score.
Primary links: HUD FMR datasets; FMR API docs; BLS OEWS tables. Official FMR JSON pulls and the OEWS extract are archived with this study. Source files checked September 16, 2026. Analysis by StartBusinessByState.com.
Cite this study: StartBusinessByState.com, “Can a Cleaner’s Wage Cover a Modest Apartment? Service Wages vs Fair Market Rent by State,” September 16, 2026. Analysis of HUD FY2026 2BR Fair Market Rents and BLS OEWS May 2025 median hourly wages. When quoting hours-to-rent, retain both source vintages and link to this page.
FAQ
Is Fair Market Rent what workers actually pay?
Not necessarily. FMR is a HUD voucher-program estimate around the 40th percentile of recent-mover gross rents. Local asking rents can be higher or lower. We use FMR as a comparable statewide housing benchmark.
Why use hours instead of a rent-to-income ratio?
Hours make the wage and rent units meet without assuming a fixed full-time schedule or household size. The optional % of a 173.33-hour month is an arithmetic convention for context only.
How is this different from the other FMR and wage studies?
FMR vs daycare prices compares HUD rent benchmarks to parent daycare tuition (not this page). Wage vs price compares caregiver pay to tuition. This page compares service occupation wages to housing (FMR).
Is this a ranking of the best states to start a business?
No. It measures how many hours of median wage equal a month of Fair Market Rent. Licensing, demand, real estate, insurance, and local comps still dominate a real plan — start from the industry guides linked above.