Research edition: September 16, 2026 · HUD Fair Market Rent FY2026 (2BR county median) · Childcare prices: DOL NDCP state medians (mostly 2022)
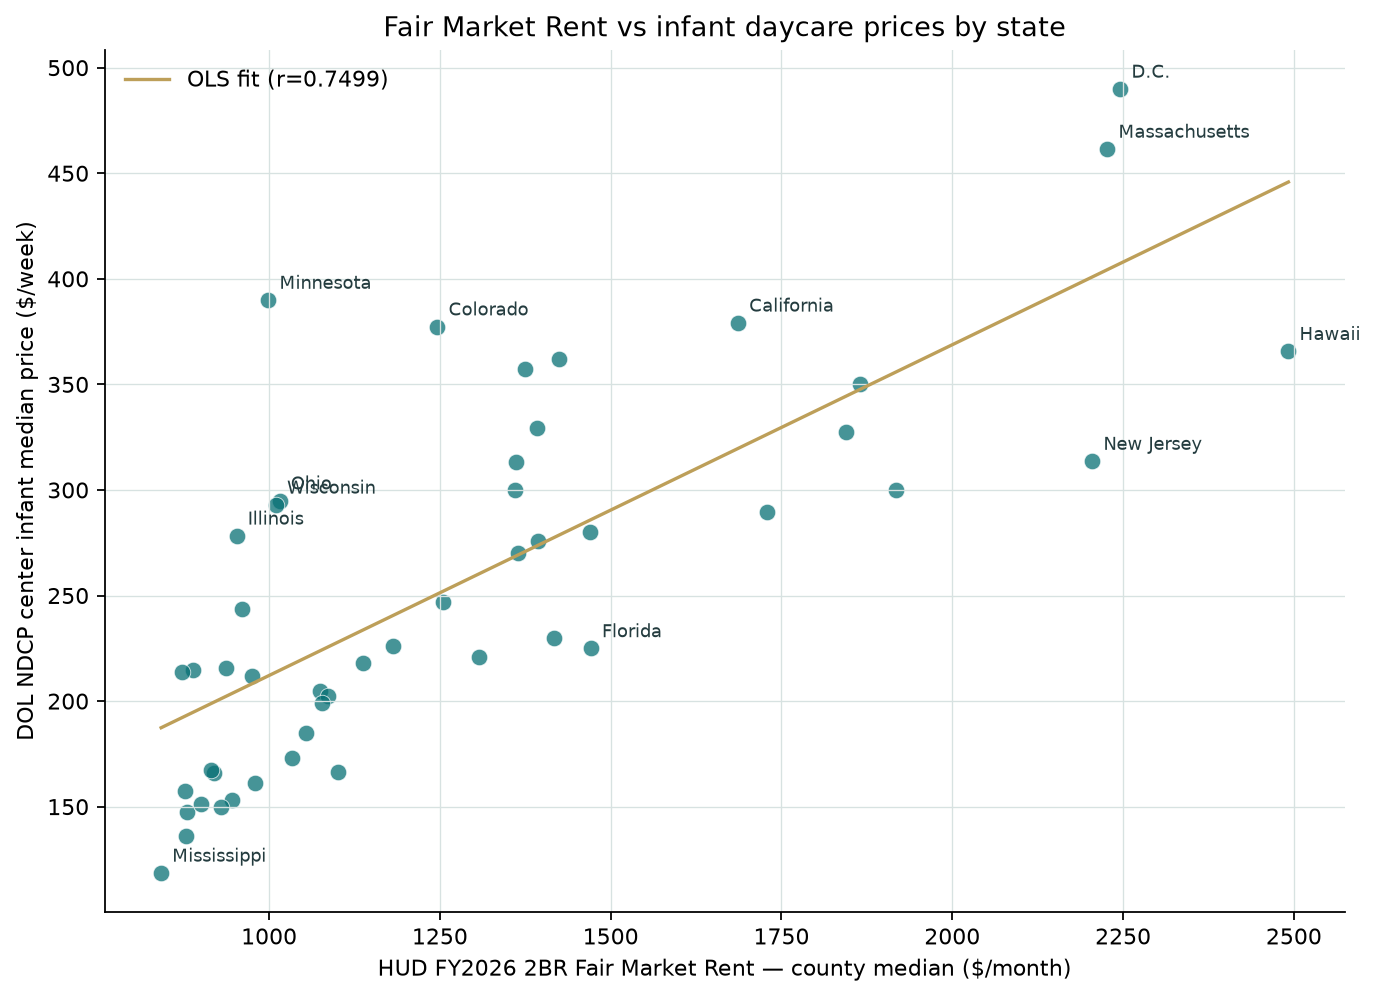
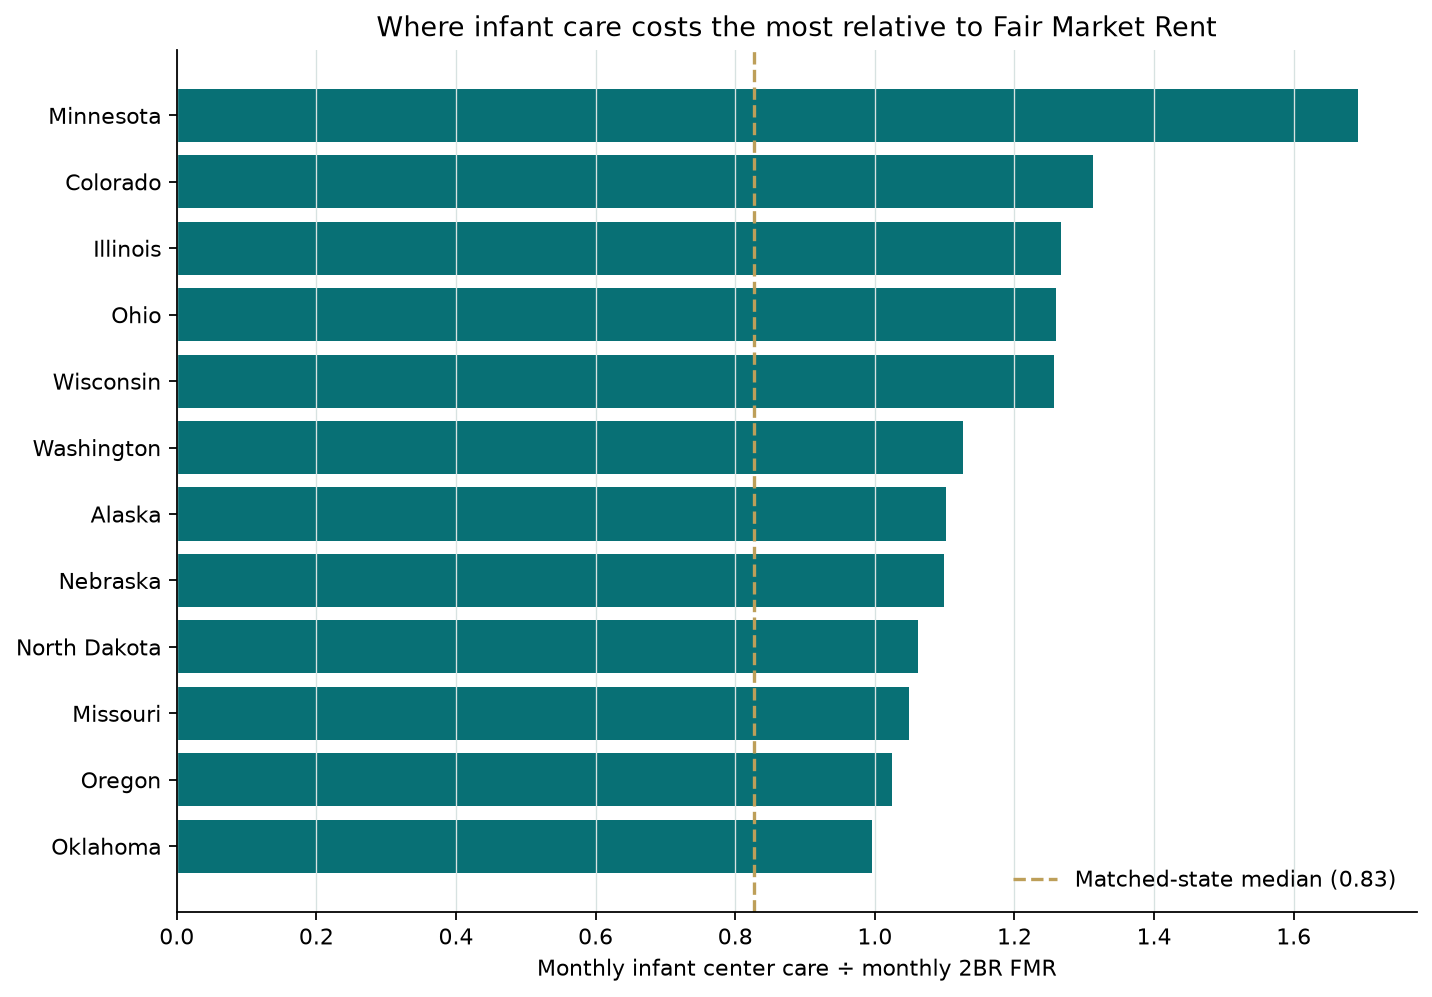
This page compares HUD Fair Market Rent (FMR) to center-based daycare / childcare prices by state — not service wages or apartment affordability for cleaners. Expensive housing and expensive childcare often travel together, but not one-for-one. Across 49 states and D.C. with both figures, county-median 2-bedroom Fair Market Rent and center-based infant weekly prices correlate at Pearson 0.7499 (Spearman 0.7727). Typical monthly infant center care equals about 83% of the state’s county-median 2BR FMR. Minnesota, Colorado, Illinois, Ohio, and Wisconsin stand out where care is high relative to rent.
Related: HUD income limits vs daycare costs.
We pair HUD User Fair Market Rents with the same DOL NDCP parent-price series used on our childcare prices by state page. This study is about housing cost vs care prices — distinct from our daycare wages vs parent prices comparison (caregiver pay vs tuition). For metro-level housing pressure on service pay (top 50 MSAs), see metro service pay vs Fair Market Rent.
Primary sources: HUD Fair Market Rents via the HUD User FMR API; DOL Women’s Bureau NDCP state-level estimates workbook. Year mismatch is labeled in the table.
What the rent–care gap shows
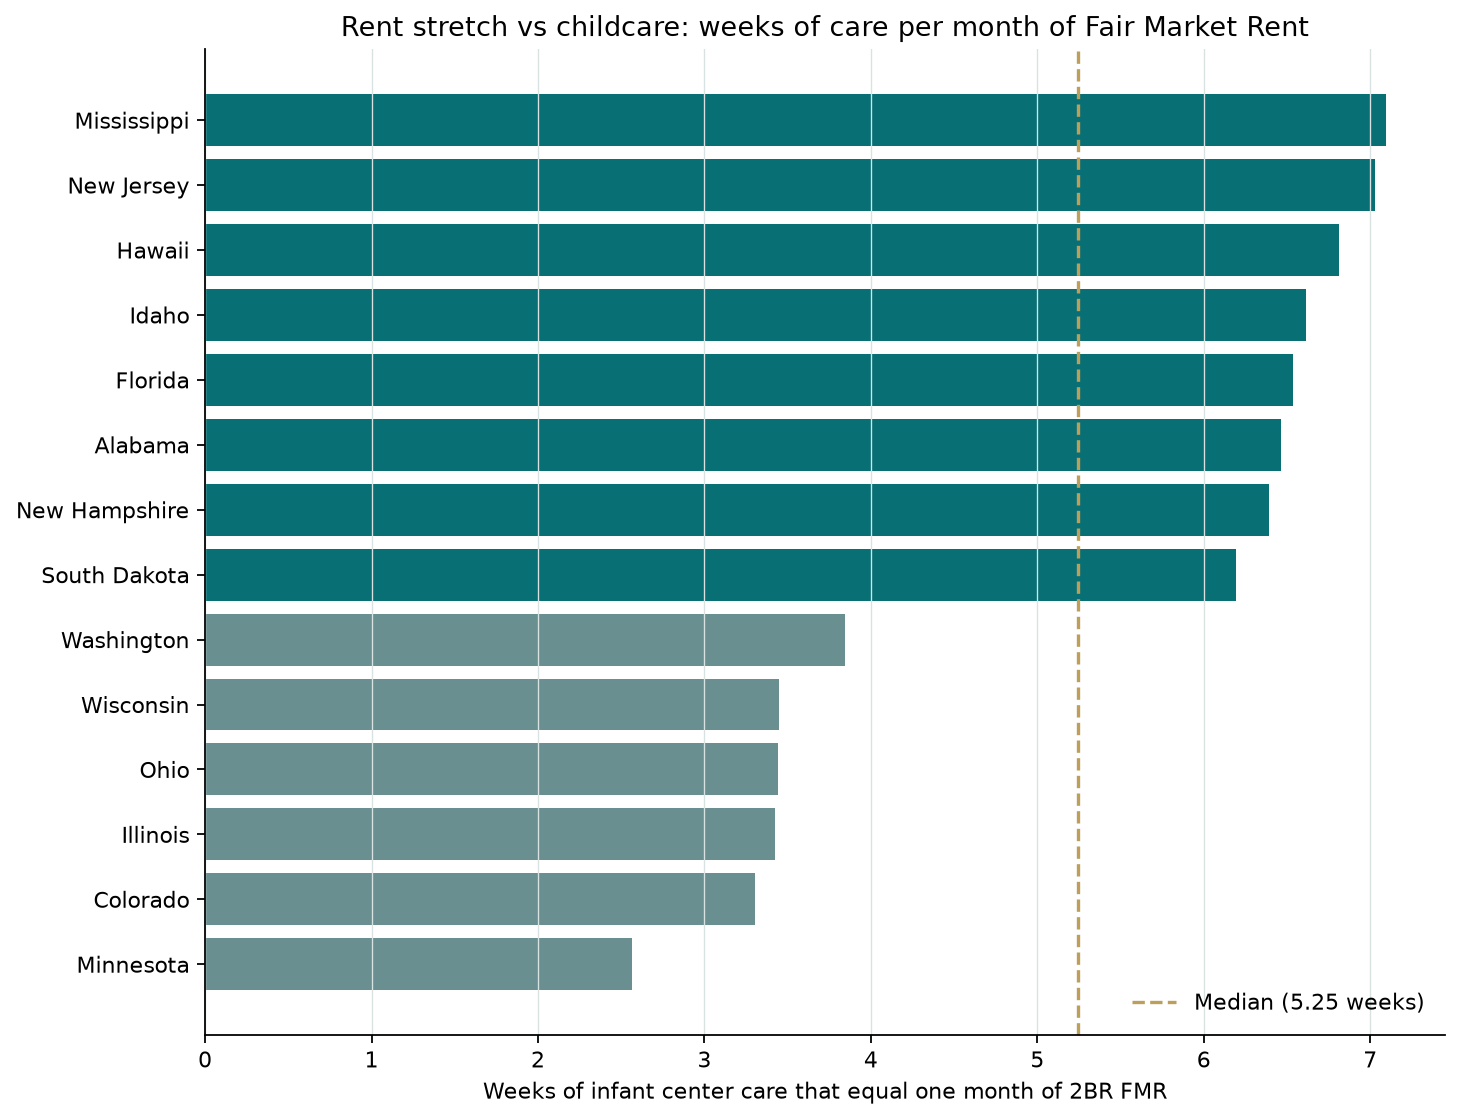
Among matched states, the median county 2BR FMR is $1,100 per month and the median center infant weekly price is $230.00. The median monthly infant care ÷ 2BR FMR ratio is 0.826. One month of FMR buys about 5.2 weeks of infant center care at the state median.
- Strong but imperfect correlation: Pearson 0.7499, Spearman 0.7727 — high-rent states often have high care prices, with clear exceptions.
- Highest care shares of rent: Minnesota leads at 1.692 — monthly infant center care is about 169% of the county-median 2BR FMR.
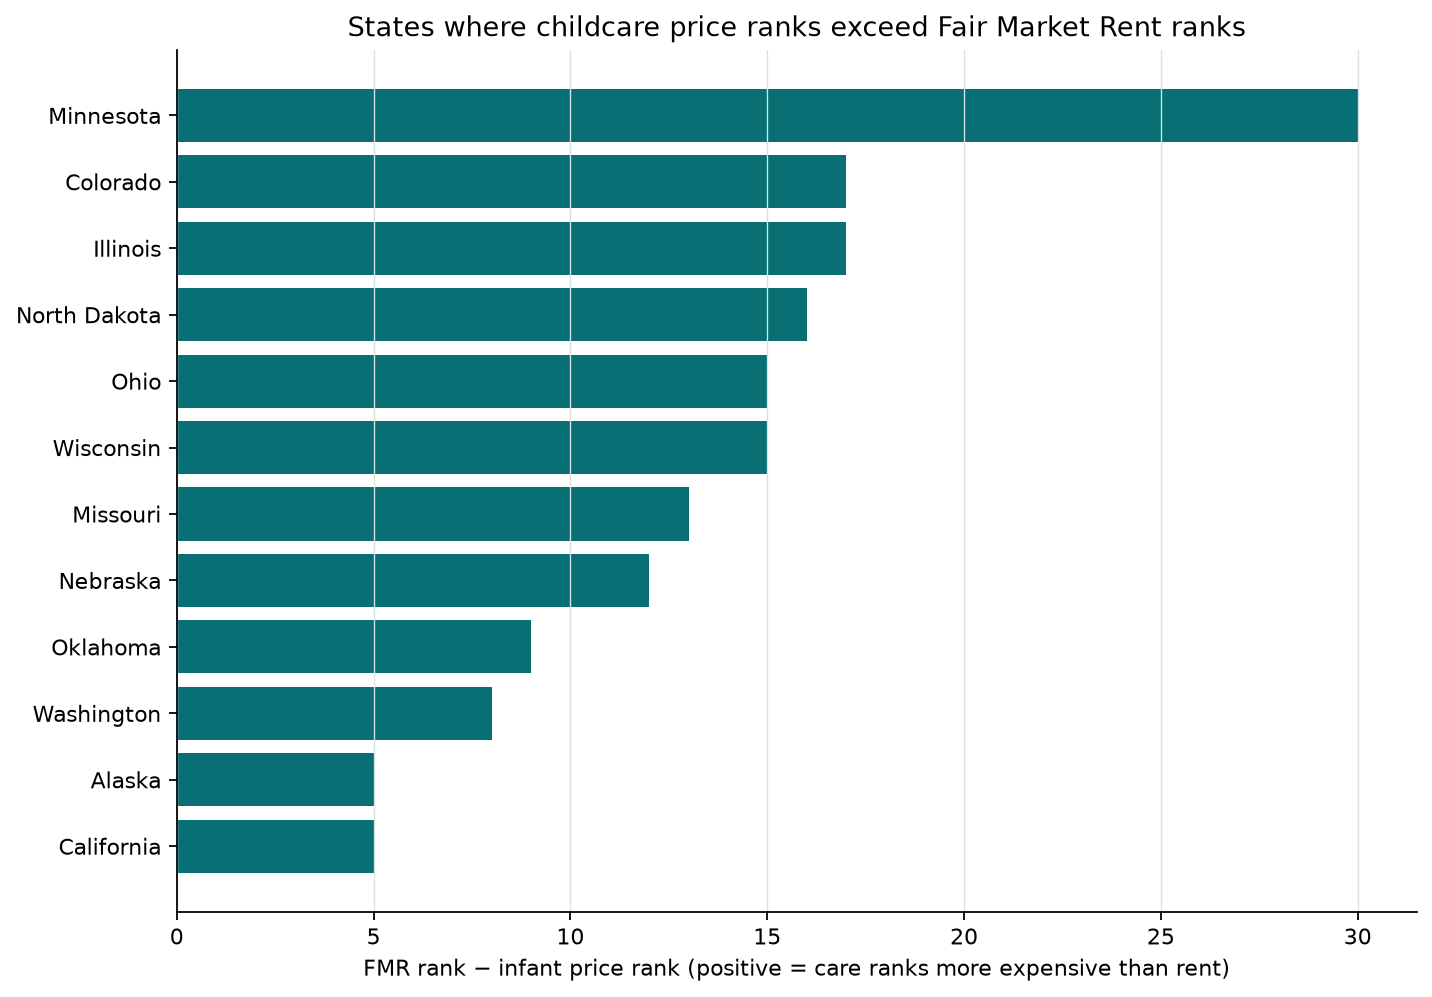
- Rank divergence: Minnesota is 3rd-highest in infant prices but only 33rd in FMR. Colorado, Illinois, Ohio, and Wisconsin also rank much higher on parent prices than on Fair Market Rent.
- Rent-heavy relative to care: Mississippi, New Jersey, Hawaii, Idaho, Florida show lower care-to-FMR shares (often because FMR itself is high).
- Missing prices: Indiana and New Mexico have no usable NDCP center infant median in the state workbook; FMR still appears in the table.
Highest infant monthly care ÷ 2BR FMR:
- Minnesota: care share 1.692 ($390.00/week infant vs $999/mo 2BR FMR, NDCP 2022).
- Colorado: care share 1.312 ($377.40/week infant vs $1,246/mo 2BR FMR, NDCP 2022).
- Illinois: care share 1.266 ($278.33/week infant vs $952/mo 2BR FMR, NDCP 2022).
- Ohio: care share 1.259 ($295.00/week infant vs $1,016/mo 2BR FMR, NDCP 2022).
- Wisconsin: care share 1.257 ($293.00/week infant vs $1,010/mo 2BR FMR, NDCP 2022).
Largest care-over-rent rank gaps (FMR rank − price rank; positive means more expensive-ranked for care than for rent):
- Minnesota: price rank #3 vs FMR rank #33 (care-over-rent gap +30).
- Colorado: price rank #5 vs FMR rank #22 (care-over-rent gap +17).
- Illinois: price rank #20 vs FMR rank #37 (care-over-rent gap +17).
- North Dakota: price rank #32 vs FMR rank #48 (care-over-rent gap +16).
- Ohio: price rank #16 vs FMR rank #31 (care-over-rent gap +15).
Read FMR carefully. Fair Market Rent is HUD’s program rent estimate (typically around the 40th percentile of recent-mover gross rents) — not Zillow asking rent, not a mortgage payment, and not what a daycare pays for commercial space. The statewide figure is an unweighted median of county 2BR FMRs; large metros can differ sharply from that median.
Charts
State-by-state table
Sort and filter the matched comparison. State names link to our daycare startup guides. Ranks use only the 49 states/DC with both FMR and infant price figures.
Showing 51 rows (51 states/DC; Indiana and New Mexico lack NDCP infant center prices).
| State | FMR FY | 2BR FMR, $/mo (county median) | Price year (NDCP) | Center infant, $/week | Monthly care ÷ FMR | Weeks care per mo. rent | FMR rank | Price rank | Care-over-rent gap |
|---|---|---|---|---|---|---|---|---|---|
| Minnesota | 2026 | $999 | 2022 | $390.00 | 169.2% | 2.56 | 33 | 3 | 30 |
| Colorado | 2026 | $1,246 | 2022 | $377.40 | 131.2% | 3.30 | 22 | 5 | 17 |
| Illinois | 2026 | $952 | 2022 | $278.33 | 126.6% | 3.42 | 37 | 20 | 17 |
| Ohio | 2026 | $1,016 | 2022 | $295.00 | 125.9% | 3.44 | 31 | 16 | 15 |
| Wisconsin | 2026 | $1,010 | 2022 | $293.00 | 125.7% | 3.45 | 32 | 17 | 15 |
| Washington | 2026 | $1,374 | 2022 | $357.31 | 112.7% | 3.85 | 16 | 8 | 8 |
| Alaska | 2026 | $1,424 | 2022 | $361.90 | 110.1% | 3.94 | 12 | 7 | 5 |
| Nebraska | 2026 | $961 | 2022 | $243.75 | 109.9% | 3.94 | 36 | 24 | 12 |
| North Dakota | 2026 | $873 | 2022 | $213.81 | 106.1% | 4.08 | 48 | 32 | 16 |
| Missouri | 2026 | $888 | 2020 | $214.94 | 104.9% | 4.13 | 44 | 31 | 13 |
| Oregon | 2026 | $1,392 | 2022 | $329.44 | 102.5% | 4.23 | 15 | 10 | 5 |
| Oklahoma | 2026 | $937 | 2022 | $215.46 | 99.6% | 4.35 | 39 | 30 | 9 |
| Vermont | 2026 | $1,362 | 2021 | $313.12 | 99.6% | 4.35 | 18 | 13 | 5 |
| California | 2026 | $1,686 | 2022 | $379.21 | 97.4% | 4.45 | 9 | 4 | 5 |
| New York | 2026 | $1,360 | 2022 | $300.00 | 95.5% | 4.54 | 19 | 15 | 4 |
| District of Columbia | 2026 | $2,246 | 2022 | $490.00 | 94.5% | 4.58 | 2 | 1 | 1 |
| Tennessee | 2026 | $975 | 2022 | $211.67 | 94.1% | 4.61 | 35 | 33 | 2 |
| Massachusetts | 2026 | $2,227 | 2022 | $461.55 | 89.8% | 4.83 | 3 | 2 | 1 |
| Nevada | 2026 | $1,393 | 2022 | $275.63 | 85.7% | 5.05 | 14 | 21 | -7 |
| Arizona | 2026 | $1,365 | 2022 | $270.00 | 85.7% | 5.06 | 17 | 22 | -5 |
| Virginia | 2026 | $1,254 | 2022 | $246.72 | 85.3% | 5.08 | 21 | 23 | -2 |
| Utah | 2026 | $1,181 | 2022 | $226.27 | 83.0% | 5.22 | 23 | 26 | -3 |
| Pennsylvania | 2026 | $1,138 | 2020 | $217.90 | 83.0% | 5.22 | 24 | 29 | -5 |
| Georgia | 2026 | $1,074 | 2022 | $205.00 | 82.7% | 5.24 | 28 | 34 | -6 |
| Delaware | 2026 | $1,470 | 2022 | $280.28 | 82.6% | 5.25 | 11 | 19 | -8 |
| Connecticut | 2026 | $1,865 | 2022 | $350.00 | 81.3% | 5.33 | 6 | 9 | -3 |
| North Carolina | 2026 | $1,086 | 2022 | $202.52 | 80.8% | 5.36 | 26 | 35 | -9 |
| South Carolina | 2026 | $1,077 | 2022 | $198.93 | 80.0% | 5.41 | 27 | 36 | -9 |
| West Virginia | 2026 | $915 | 2022 | $167.49 | 79.3% | 5.46 | 42 | 39 | 3 |
| Iowa | 2026 | $919 | 2022 | $165.98 | 78.3% | 5.54 | 41 | 41 | 0 |
| Kansas | 2026 | $877 | 2022 | $157.33 | 77.7% | 5.57 | 47 | 43 | 4 |
| Maryland | 2026 | $1,845 | 2022 | $327.39 | 76.9% | 5.63 | 7 | 11 | -4 |
| Texas | 2026 | $1,054 | 2022 | $185.00 | 76.1% | 5.70 | 29 | 37 | -8 |
| Montana | 2026 | $1,307 | 2022 | $220.81 | 73.2% | 5.92 | 20 | 28 | -8 |
| Kentucky | 2026 | $900 | 2022 | $151.30 | 72.9% | 5.95 | 43 | 45 | -2 |
| Michigan | 2026 | $1,033 | 2022 | $173.20 | 72.7% | 5.96 | 30 | 38 | -8 |
| Arkansas | 2026 | $880 | 2021 | $147.50 | 72.6% | 5.97 | 45 | 47 | -2 |
| Rhode Island | 2026 | $1,729 | 2022 | $289.59 | 72.6% | 5.97 | 8 | 18 | -10 |
| Wyoming | 2026 | $980 | 2022 | $161.17 | 71.3% | 6.08 | 34 | 42 | -8 |
| Maine | 2026 | $1,418 | 2022 | $230.00 | 70.3% | 6.16 | 13 | 25 | -12 |
| Louisiana | 2026 | $946 | 2022 | $153.33 | 70.3% | 6.17 | 38 | 44 | -6 |
| South Dakota | 2026 | $929 | 2022 | $150.00 | 70.0% | 6.19 | 40 | 46 | -6 |
| New Hampshire | 2026 | $1,918 | 2022 | $300.05 | 67.8% | 6.39 | 5 | 14 | -9 |
| Alabama | 2026 | $879 | 2022 | $136.01 | 67.0% | 6.46 | 46 | 48 | -2 |
| Florida | 2026 | $1,471 | 2022 | $225.00 | 66.3% | 6.54 | 10 | 27 | -17 |
| Idaho | 2026 | $1,100 | 2022 | $166.41 | 65.5% | 6.61 | 25 | 40 | -15 |
| Hawaii | 2026 | $2,492 | 2022 | $365.77 | 63.6% | 6.81 | 1 | 6 | -5 |
| New Jersey | 2026 | $2,205 | 2022 | $313.73 | 61.7% | 7.03 | 4 | 12 | -8 |
| Mississippi | 2026 | $842 | 2022 | $118.68 | 61.1% | 7.09 | 49 | 49 | 0 |
| Indiana | 2026 | $1,008 | — | — | — | — | — | — | — |
| New Mexico | 2026 | $1,040 | — | — | — | — | — | — | — |
— means unavailable (NDCP missing or not ranked). Monthly care uses weekly × 52 ÷ 12. Care-over-rent gap = FMR rank − price rank (positive = care ranks more expensive than rent). FMR is not asking rent or commercial lease cost.
Use this for daycare planning — without treating FMR as your rent quote
Prospective owners can use the share and ranks as market context: where parent tuition sits next to a standardized housing-cost benchmark. Local commercial leases, occupancy, wages, and insurance still dominate a real business plan.
- Compare absolute parent price levels on our childcare prices by state study and supply context on childcare availability by state.
- For ACS owner-occupied housing stock and young-child household demand context (not HUD rents), see home-services demand by state.
- For caregiver pay vs tuition (a different pairing), see daycare wages vs parent prices by state.
- For labor wages vs housing (same FMR rollup, different pairing), see service wages vs Fair Market Rent.
- Start from the national how to start a daycare hub — each state name in the table links to that state’s guide.
- Facility and liability risk is separate from this rent/price comparison — see daycare business insurance.
Download, methods, and limitations
Download the state table (CSV) ·
Scatter chart (PNG) ·
Care-share chart (PNG) ·
Rank-gap chart (PNG) ·
Weeks-per-rent chart (PNG)
Sources. Housing: HUD User FMR API fmr/statedata/{ST}?year=2026, Two-Bedroom field, fiscal year 2026. Parent prices: DOL Women’s Bureau National Database of Childcare Prices: State-Level Estimates and Affordability Rankings 2022 (XLSX), center MEDIAN_INFANT_PRICE / MEDIAN_PRESCHOOL_PRICE. We use each state’s latest year with a published center infant median (45 jurisdictions in 2022; Arkansas and Vermont 2021; Missouri and Pennsylvania 2020) — the same series as our childcare-prices and wage-vs-price pages.
State FMR rollup. Primary metric = unweighted median of county 2BR FMRs. Town-level New England rows are collapsed to a county median first, then the median across counties. CSV also includes county mean, IQR, and metro-area median. Not population-weighted in this edition.
Constructed metrics. Monthly infant care = weekly × 52 ÷ 12. Care share of FMR = monthly care ÷ 2BR FMR. Weeks of care per month of rent = FMR ÷ weekly price. Rank gap (care over rent) = FMR rank − infant price rank among the 49 matched states (1 = highest).
Limitations. FMR ≠ asking rent, owner costs, or commercial daycare rent. Statewide county median ≠ every metro. FY2026 FMR and mostly-2022 NDCP prices are different periods; dollars are nominal (no inflation adjustment). Prices are not operator revenue. Missing NDCP cells are unavailable, not zero. Indiana and New Mexico lack usable center infant medians. This is not a best-state score and is not a substitute for local market rent comps.
Primary links: HUD FMR datasets; FMR API docs; NDCP 2022 state-level XLSX; NDCP program page. Official state JSON pulls and the NDCP workbook are archived with this study. Source files checked September 16, 2026. Analysis by StartBusinessByState.com.
Cite this study: StartBusinessByState.com, “Does Expensive Housing Track Expensive Childcare? Fair Market Rent vs Daycare Prices by State,” September 16, 2026. Analysis of HUD FY2026 2BR Fair Market Rents and DOL NDCP state median childcare prices. When quoting a ratio or rank gap, retain both source years and link to this page.
FAQ
Is Fair Market Rent what daycare operators pay for space?
No. FMR is a residential voucher-program rent estimate. Commercial leases for childcare facilities follow a different market. We use FMR as a comparable statewide housing-cost benchmark next to parent tuition — not as a facility P&L input.
Why mix FY2026 rents with mostly-2022 prices?
Those are the latest aligned federal editions available for this pairing. We label both years rather than silently inflation-adjusting NDCP dollars or mixing incompatible vintages.
Is this a ranking of the best states to open a daycare?
No. It measures how parent price medians sit next to HUD Fair Market Rent. Licensing, demand, real estate, wages, and insurance differ by market; start from the state daycare guide linked in the table.
How is this different from the wage vs price study?
Wages vs prices compares caregiver pay to parent tuition. This page compares housing cost (FMR) to parent tuition.
Which state has the most expensive daycare?
On this page’s matched table (DOL NDCP center infant weekly medians, mostly 2022), the District of Columbia is highest at $490.00/week, followed by Massachusetts ($461.55) and Minnesota ($390.00). Indiana and New Mexico lack NDCP infant prices in this edition. Prices are not FY2026 rents — vintages differ; see Methods.
What state has the highest daycare costs?
Same ranking: D.C. leads center infant weekly medians at $490 (mostly 2022 NDCP), then Massachusetts and Minnesota. “Highest costs” here means parent tuition medians, not commercial facility rent.
Which state has the most affordable daycare?
Among matched states, Mississippi has the lowest center infant weekly median at $118.68 (mostly 2022), then Alabama ($136.01) and Arkansas ($147.50). Affordable in this table ≠ easiest licensing or strongest demand.
Does Section 8 pay FMR?
This page does not advise on Section 8 or voucher payments. HUD Fair Market Rent is a residential voucher-program rent estimate we use as a statewide housing benchmark next to parent tuition — not a promise of what any household receives. For program rules, use HUD / your local housing authority.