Fixed edition analyzed September 16, 2026. Geography: the 50 largest Metropolitan Statistical Areas by Census 2024 population. Rent: HUD Fair Market Rent FY2026 two-bedroom (metro or median of HUD Metro FMR Area components). Pay: BLS QCEW 2024 annual average weekly wage, private ownership, for janitorial (561720), landscaping (561730), child day care (624410), and plumbing/HVAC contractors (23822). Hours = monthly 2BR FMR ÷ (weekly wage ÷ 40). Not OEWS occupation medians — see differentiation below.
Short answer: Among large metros with published janitorial QCEW pay, the median worker needs about 119 hours of average weekly pay to cover one month of metro 2BR Fair Market Rent — roughly 69% of a conventional 173-hour full-time month. That is much harder than the statewide maid/housekeeper median of ~69 hours on our state service wages vs Fair Market Rent page, because this study uses metro rents and industry average pay.
This page is metro/MSA grain. It is not another state rollup. Sibling state pages: OEWS occupation wages vs state FMR and state FMR vs NDCP daycare prices. Daycare prices stay state-only here (NDCP lacks a clean metro series we trust) — linked for context, not fabricated at MSA grain.
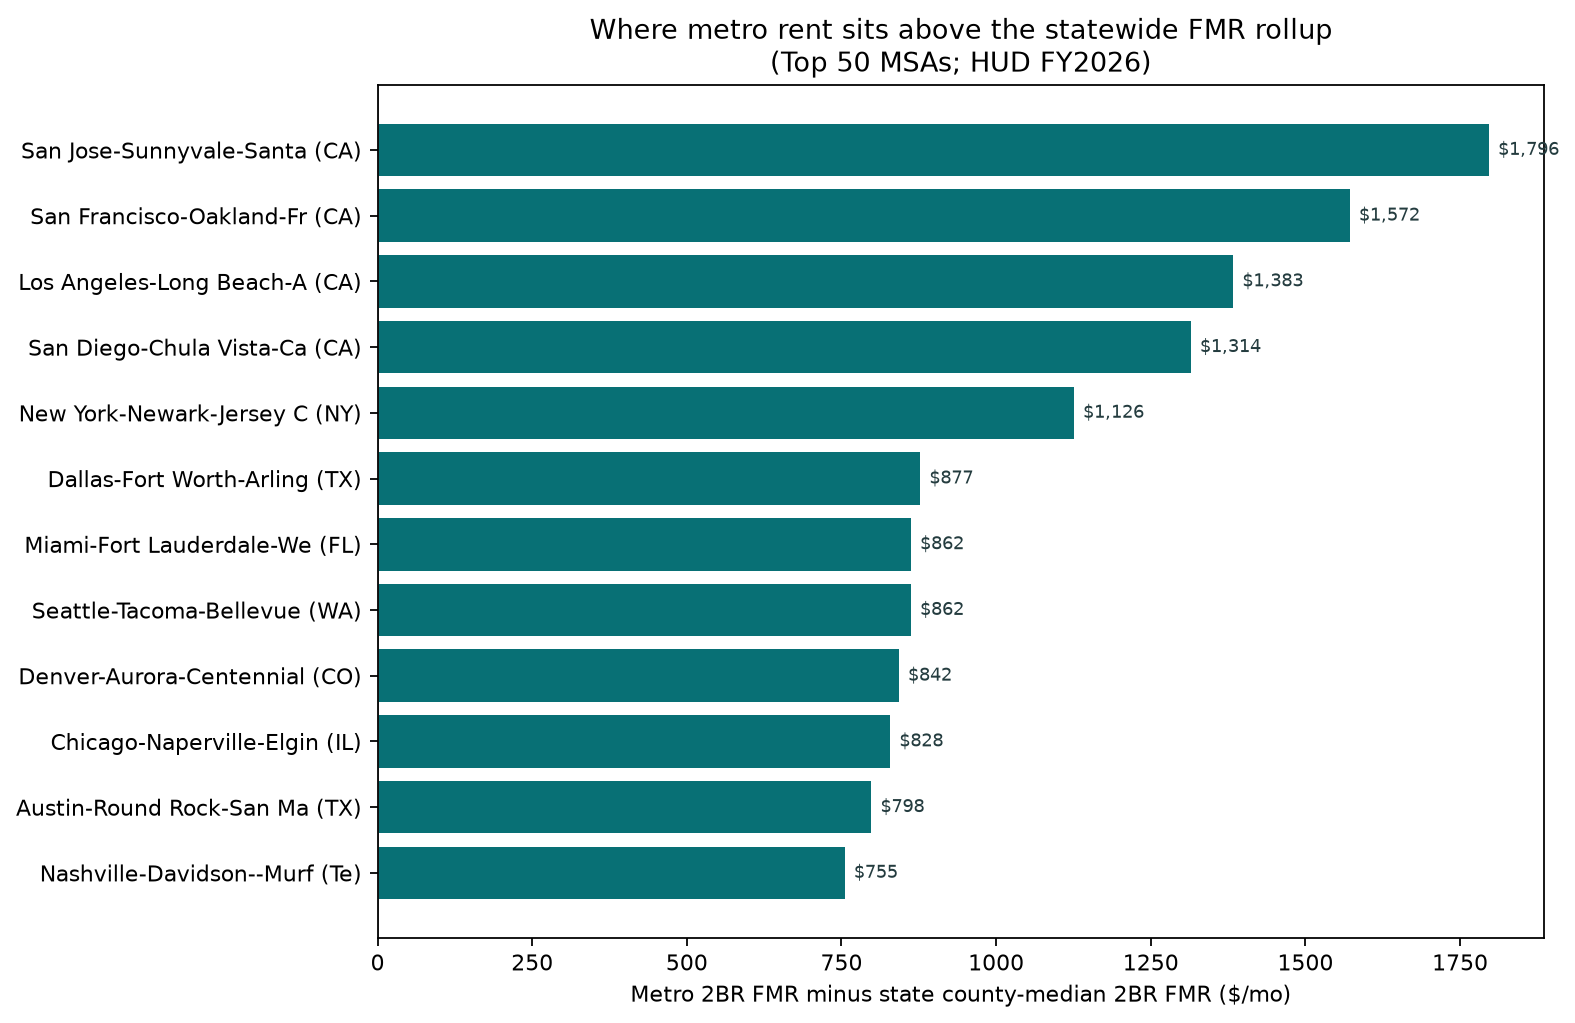
Why metro rankings flip vs state averages
Statewide FMR is an unweighted median of county rents. Large metros inside “cheaper” states often sit far above that rollup — so a state that looks affordable on the sibling page can still be a tough housing market for service employers in its biggest cities.
- San Jose-Sunnyvale-Santa Clara (California): metro FMR $3,483 vs state median $1,686 (+1,796/mo)
- San Francisco-Oakland-Fremont (California): metro FMR $3,258 vs state median $1,686 (+1,572/mo)
- Los Angeles-Long Beach-Anaheim (California): metro FMR $3,070 vs state median $1,686 (+1,383/mo)
- San Diego-Chula Vista-Carlsbad (California): metro FMR $3,001 vs state median $1,686 (+1,314/mo)
- New York-Newark-Jersey City (New York): metro FMR $2,486 vs state median $1,360 (+1,126/mo)
- Dallas-Fort Worth-Arlington (Texas): metro FMR $1,931 vs state median $1,054 (+877/mo)
Example: Dallas–Fort Worth 2BR FMR is $1,931 vs Texas’s county-median FMR of $1,054 (+877/mo). Janitorial hours-to-rent in Dallas: 118.8. Miami sits $862 above Florida’s state median FMR and needs about 152.3 janitorial hours.
Hardest metros for janitorial pay vs rent
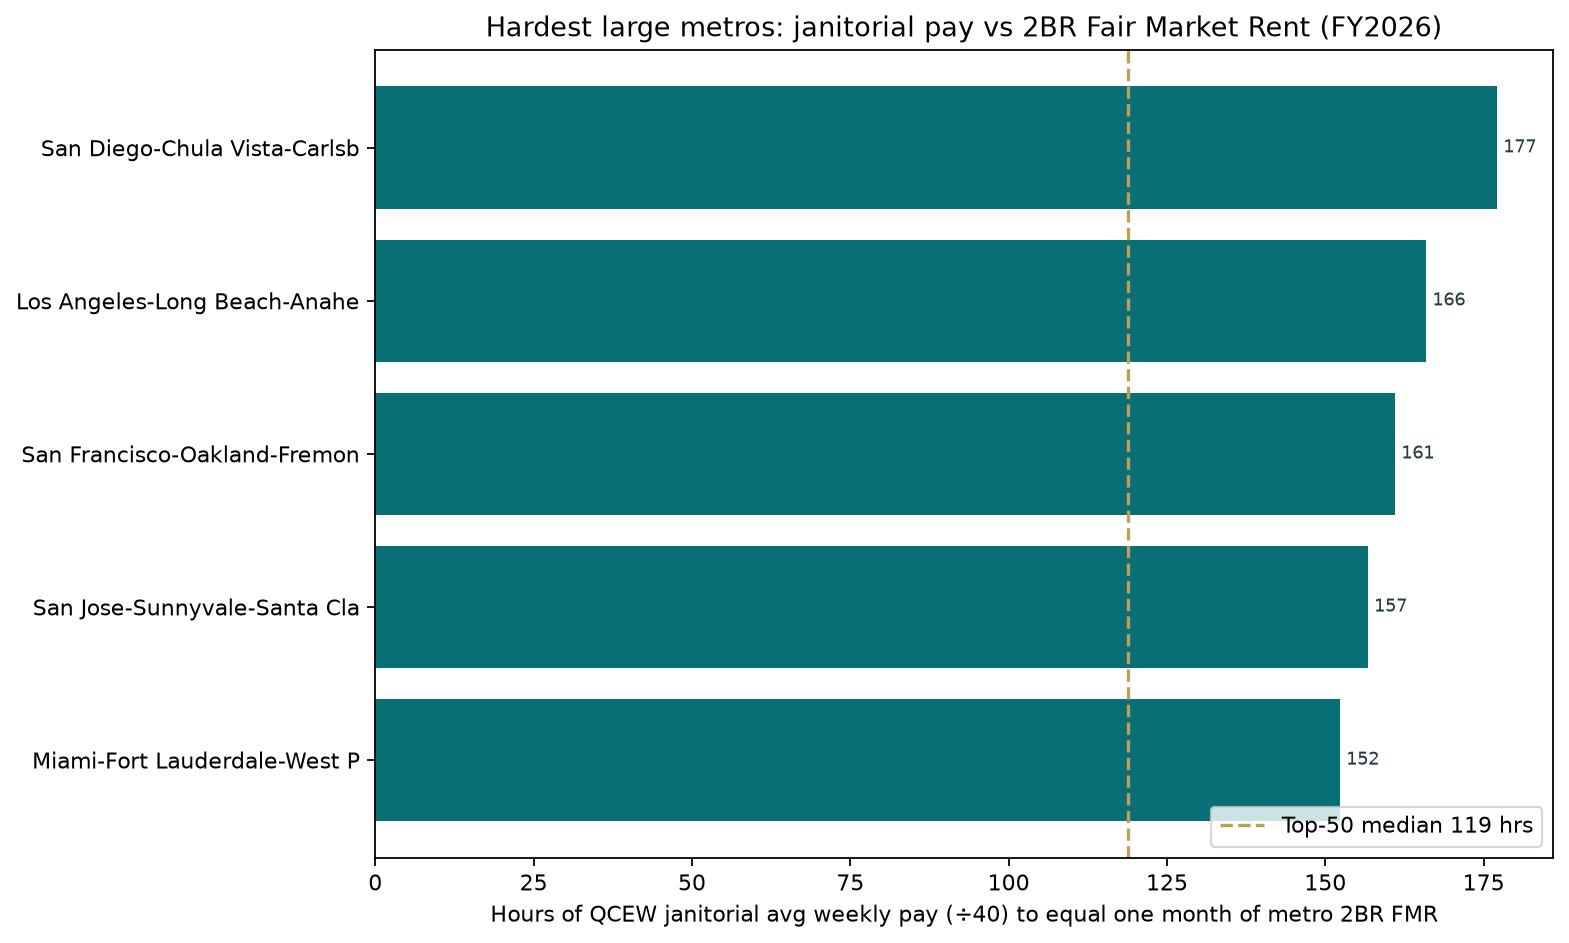
Where QCEW publishes private janitorial (NAICS 561720) average weekly wages for the MSA, California coastal metros dominate the hardest hours-to-rent list — high FMR, not the lowest pay:
- San Diego-Chula Vista-Carlsbad — 177 hours (2BR FMR $3,001, janitorial weekly $678)
- Los Angeles-Long Beach-Anaheim — 166 hours (2BR FMR $3,070, janitorial weekly $740)
- San Francisco-Oakland-Fremont — 161 hours (2BR FMR $3,258, janitorial weekly $809)
- San Jose-Sunnyvale-Santa Clara — 157 hours (2BR FMR $3,483, janitorial weekly $889)
- Miami-Fort Lauderdale-West Palm Beach — 152 hours (2BR FMR $2,333, janitorial weekly $613)
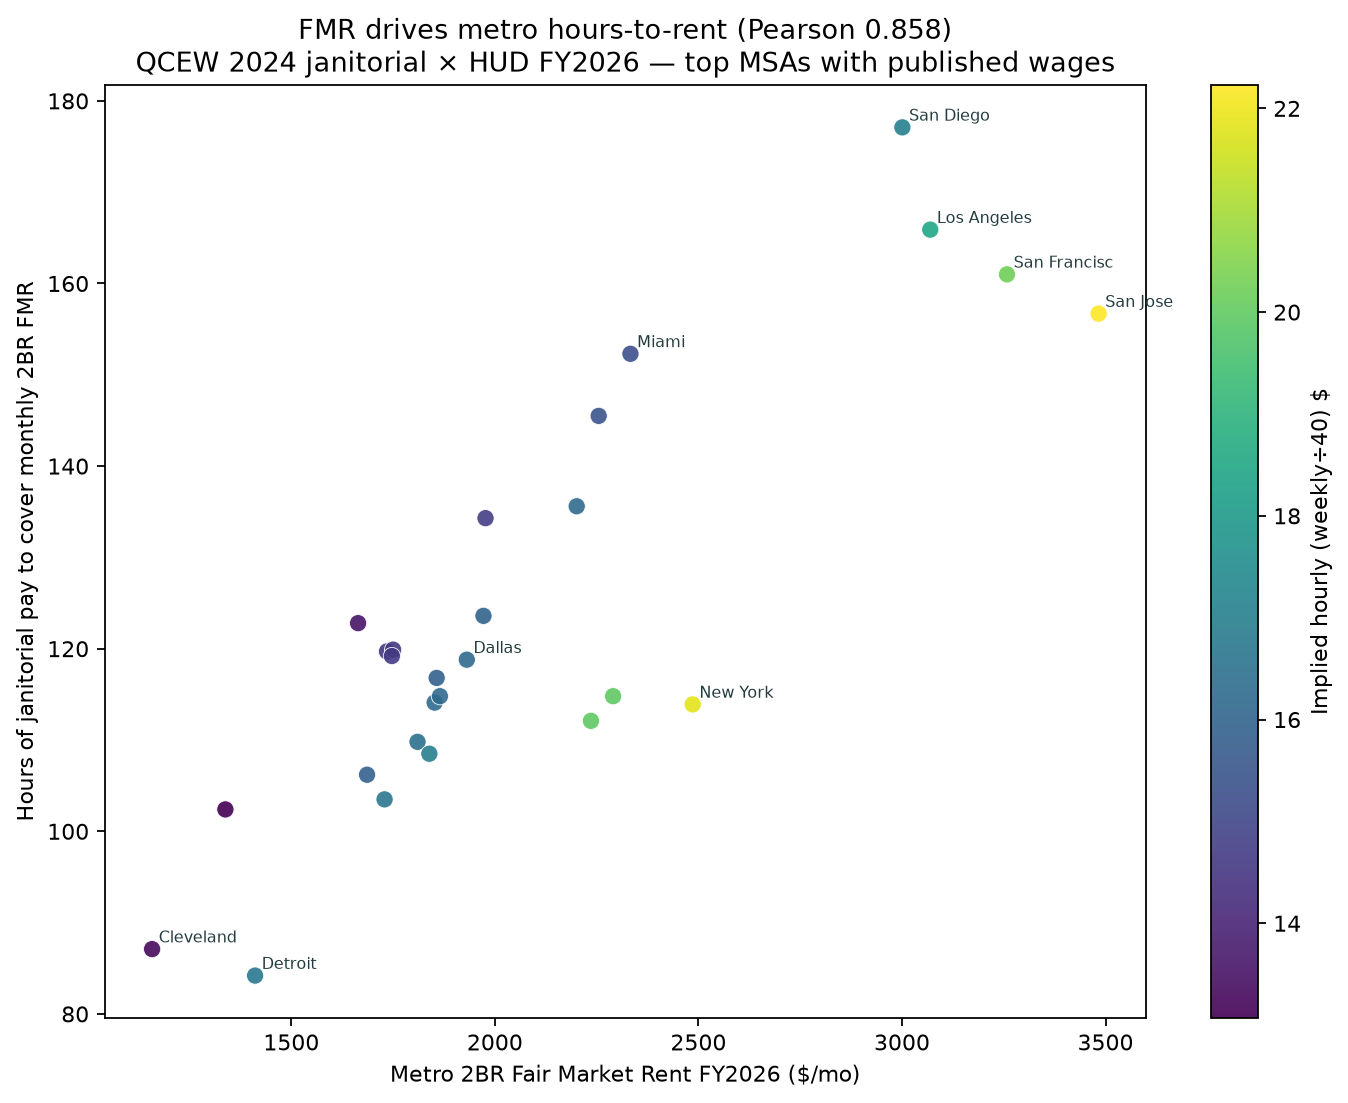
Among published metros, the easiest end includes Detroit (~84 hours) and Cleveland (~87 hours). Median across published top-50 metros: 118.8 hours. Pearson correlation of FMR vs cleaning hours: 0.858; wage vs hours only 0.314 — same pattern as the state study: rent level drives the hours metric.
Other service industries
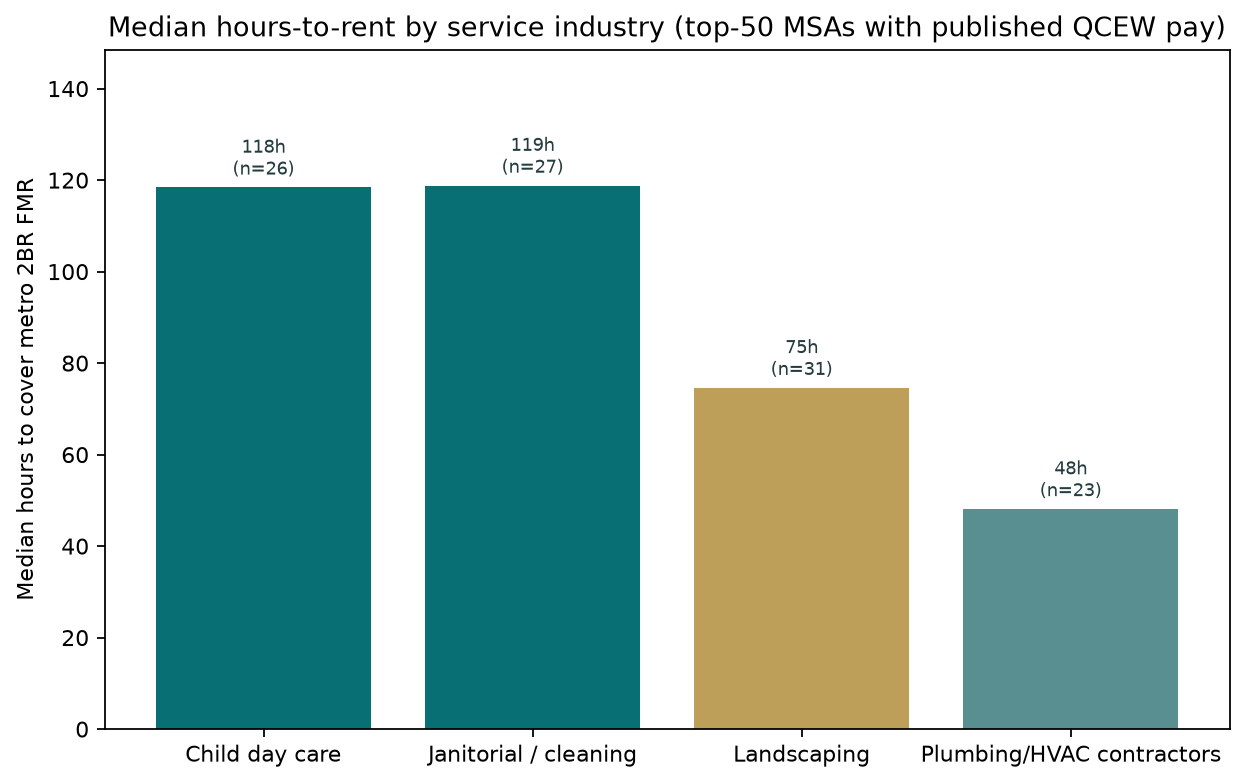
Median hours-to-rent among top-50 MSAs with published QCEW pay:
- Child day care (624410): 118.4 hours (n=26)
- Janitorial / cleaning (561720): 118.8 hours (n=27)
- Landscaping (561730): 74.6 hours (n=31)
- Plumbing & HVAC contractors (23822): 48.1 hours (n=23)
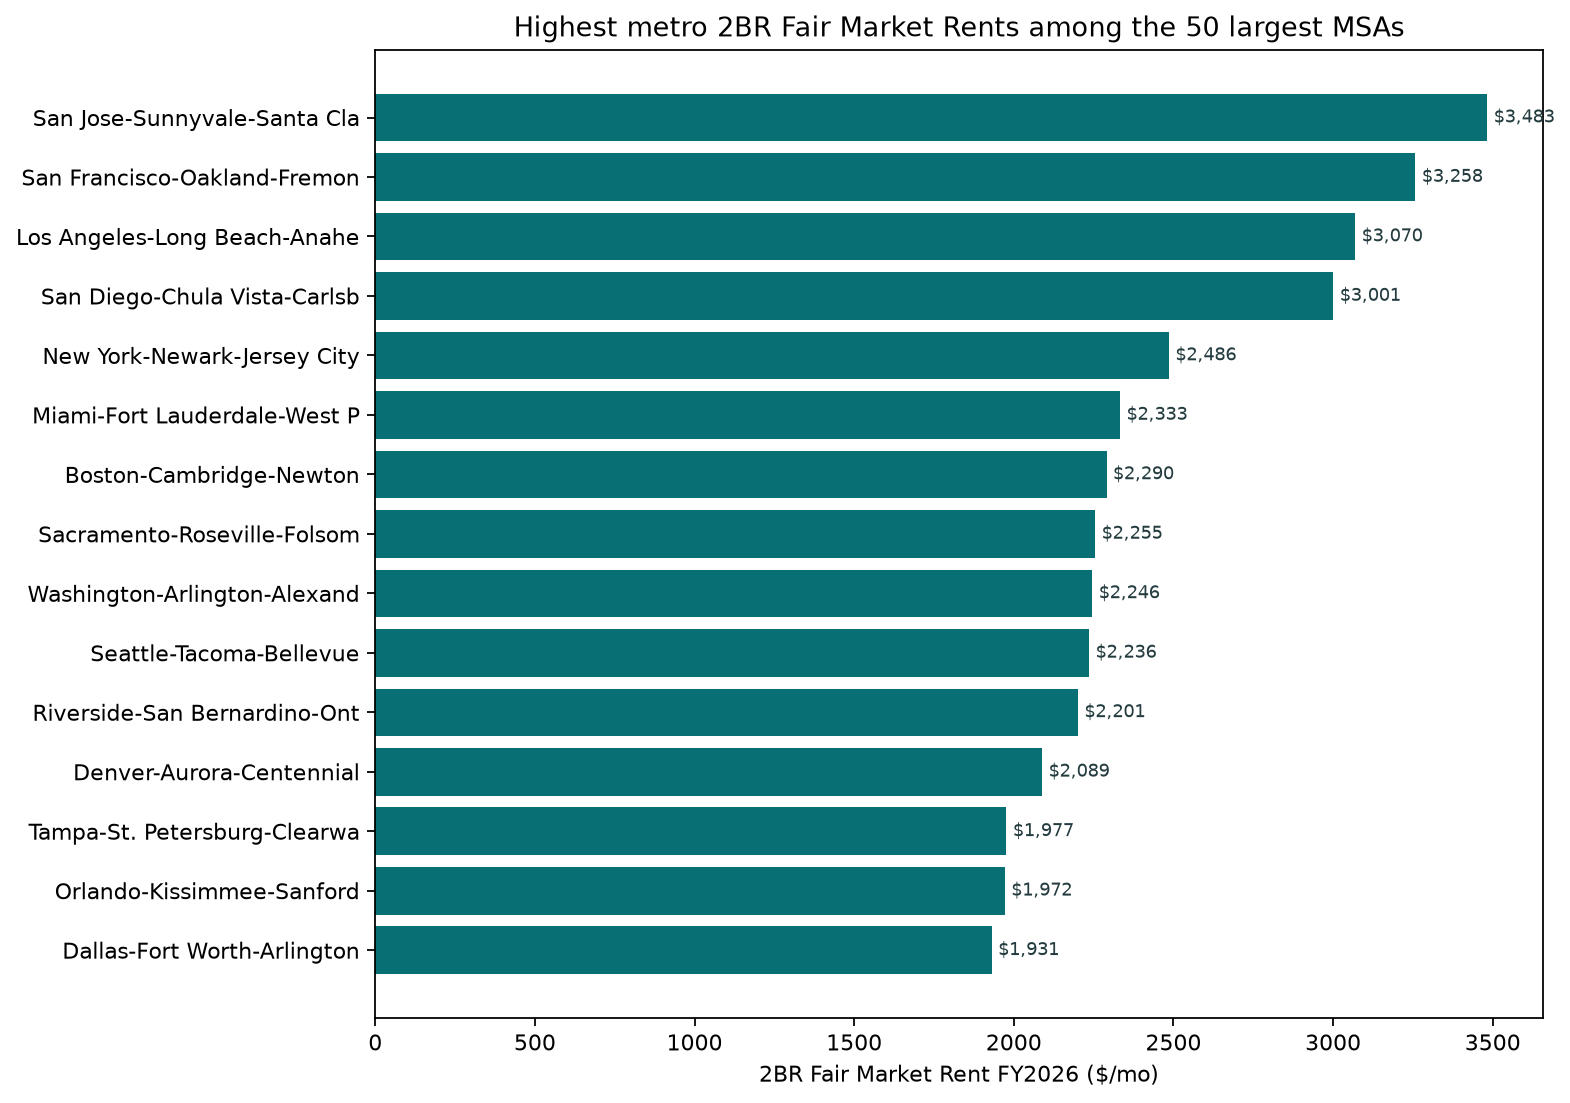
Highest metro 2BR Fair Market Rents
Among the 50 largest MSAs, median 2BR FMR is $1,741/mo. San Jose ($3,483), San Francisco Bay components, Los Angeles, and San Diego lead. Download the CSV for every MSA in the set.
Metro table (50 largest MSAs)
Sortable table: population, metro 2BR FMR, statewide county-median FMR, metro premium, and hours-to-rent by industry where QCEW published a wage (em dash = suppressed / not disclosed — never imputed). State names link to state hubs.
| Metro (Census) | Primary state | Pop 2024 | Metro 2BR FMR | State FMR median | Metro − state | Janitorial hrs | Landscaping hrs | Childcare hrs | Plumbing/HVAC hrs |
|---|---|---|---|---|---|---|---|---|---|
| San Diego-Chula Vista-Carlsbad, CA | California | 3,298,799 | $3,001 | $1,686 | $+1,314 | 177.1 | 122.7 | 156.1 | 74.1 |
| Los Angeles-Long Beach-Anaheim, CA | California | 12,927,614 | $3,070 | $1,686 | $+1,383 | 165.9 | 122.7 | 161.4 | 75.5 |
| San Francisco-Oakland-Fremont, CA | California | 4,648,486 | $3,258 | $1,686 | $+1,572 | 161.0 | 109.8 | 136.0 | 61.7 |
| San Jose-Sunnyvale-Santa Clara, CA | California | 1,995,484 | $3,483 | $1,686 | $+1,796 | 156.7 | 122.0 | 142.5 | — |
| Miami-Fort Lauderdale-West Palm Beach, FL | Florida | 6,457,988 | $2,333 | $1,471 | $+862 | 152.3 | 111.7 | 140.5 | 74.2 |
| Sacramento-Roseville-Folsom, CA | California | 2,463,127 | $2,255 | $1,686 | $+568 | 145.5 | 78.5 | 127.8 | 55.3 |
| Riverside-San Bernardino-Ontario, CA | California | 4,744,214 | $2,201 | $1,686 | $+514 | 135.6 | 91.4 | 133.4 | 62.0 |
| Tampa-St. Petersburg-Clearwater, FL | Florida | 3,424,560 | $1,977 | $1,471 | $+506 | 134.3 | 92.0 | 126.1 | 63.8 |
| Orlando-Kissimmee-Sanford, FL | Florida | 2,940,513 | $1,972 | $1,471 | $+501 | 123.6 | 83.8 | 133.7 | 60.1 |
| Fresno, CA | California | 1,189,557 | $1,664 | $1,686 | $-22 | 122.8 | 57.6 | 95.1 | 48.3 |
| Raleigh-Cary, NC | North Carolina | 1,562,009 | $1,750 | $1,086 | $+664 | 119.9 | 72.6 | — | 48.1 |
| Las Vegas-Henderson-North Las Vegas, NV | Nevada | 2,398,871 | $1,735 | $1,393 | $+342 | 119.7 | 78.2 | 118.8 | 45.8 |
| Salt Lake City-Murray, UT | Utah | 1,300,762 | $1,747 | $1,181 | $+566 | 119.2 | 72.9 | 122.9 | 47.2 |
| Dallas-Fort Worth-Arlington, TX | Texas | 8,344,032 | $1,931 | $1,054 | $+877 | 118.8 | 76.1 | — | 50.2 |
| Baltimore-Columbia-Towson, MD | Maryland | 2,859,024 | $1,857 | $1,845 | $+12 | 116.8 | 72.3 | 113.9 | — |
| Boston-Cambridge-Newton, MA-NH | Massachusetts | 5,025,517 | $2,290 | $2,227 | $+64 | 114.8 | 74.8 | 116.7 | — |
| Hartford-West Hartford-East Hartford, CT | Connecticut | 1,169,048 | $1,865 | $1,865 | $+0 | 114.8 | 73.5 | 125.8 | 43.4 |
| Austin-Round Rock-San Marcos, TX | Texas | 2,550,637 | $1,852 | $1,054 | $+798 | 114.1 | 67.1 | 110.6 | 44.5 |
| New York-Newark-Jersey City, NY-NJ | New York | 19,940,274 | $2,486 | $1,360 | $+1,126 | 113.9 | 93.4 | 134.0 | 59.6 |
| Seattle-Tacoma-Bellevue, WA | Washington | 4,145,494 | $2,236 | $1,374 | $+862 | 112.1 | 83.5 | 118.1 | 44.9 |
| Philadelphia-Camden-Wilmington, PA-NJ-DE-MD | Pennsylvania | 6,330,422 | $1,810 | $1,138 | $+672 | 109.8 | 72.5 | 113.5 | 40.7 |
| Phoenix-Mesa-Chandler, AZ | Arizona | 5,186,958 | $1,839 | $1,365 | $+474 | 108.5 | 75.4 | 117.3 | — |
| Charlotte-Concord-Gastonia, NC-SC | North Carolina | 2,883,370 | $1,686 | $1,086 | $+600 | 106.2 | — | — | — |
| Providence-Warwick, RI-MA | Rhode Island | 1,700,901 | $1,729 | $1,729 | $+0 | 103.5 | 65.2 | — | 44.6 |
| Milwaukee-Waukesha, WI | Wisconsin | 1,574,452 | $1,338 | $1,010 | $+328 | 102.4 | 56.2 | 90.4 | 30.4 |
| Cleveland, OH | Ohio | 2,171,877 | $1,158 | $1,016 | $+142 | 87.1 | 51.7 | — | 31.9 |
| Detroit-Warren-Dearborn, MI | Michigan | 4,400,578 | $1,411 | $1,033 | $+378 | 84.2 | 54.2 | 95.3 | 33.3 |
| Washington-Arlington-Alexandria, DC-VA-MD-WV | District of Columbia | 6,436,489 | $2,246 | $2,246 | $+0 | — | — | — | — |
| Denver-Aurora-Centennial, CO | Colorado | 3,052,498 | $2,089 | $1,246 | $+842 | — | — | — | — |
| Portland-Vancouver-Hillsboro, OR-WA | Oregon | 2,537,904 | $1,922 | $1,392 | $+530 | — | — | — | — |
| Atlanta-Sandy Springs-Roswell, GA | Georgia | 6,411,149 | $1,820 | $1,074 | $+746 | — | — | — | — |
| Chicago-Naperville-Elgin, IL-IN | Illinois | 9,408,576 | $1,781 | $952 | $+828 | — | — | — | — |
| Nashville-Davidson–Murfreesboro–Franklin, TN | Tennessee | 2,150,553 | $1,730 | $975 | $+755 | — | — | — | — |
| Virginia Beach-Chesapeake-Norfolk, VA-NC | Virginia | 1,794,278 | $1,713 | $1,254 | $+459 | — | — | — | — |
| Minneapolis-St. Paul-Bloomington, MN-WI | Minnesota | 3,757,952 | $1,709 | $999 | $+710 | — | — | — | — |
| Jacksonville, FL | Florida | 1,760,548 | $1,658 | $1,471 | $+187 | — | 74.6 | 110.8 | — |
| Richmond, VA | Virginia | 1,370,165 | $1,655 | $1,254 | $+401 | — | — | — | — |
| Houston-Pasadena-The Woodlands, TX | Texas | 7,796,182 | $1,573 | $1,054 | $+519 | — | — | 111.4 | — |
| Grand Rapids-Wyoming-Kentwood, MI | Michigan | 1,178,826 | $1,531 | $1,033 | $+498 | — | 63.0 | — | 39.8 |
| Indianapolis-Carmel-Greenwood, IN | Indiana | 2,174,833 | $1,473 | $1,008 | $+464 | — | 62.1 | — | — |
| Columbus, OH | Ohio | 2,225,377 | $1,430 | $1,016 | $+414 | — | — | — | — |
| San Antonio-New Braunfels, TX | Texas | 2,763,006 | $1,426 | $1,054 | $+372 | — | — | — | — |
| Kansas City, MO-KS | Missouri | 2,253,579 | $1,358 | $888 | $+470 | — | — | — | — |
| Cincinnati, OH-KY-IN | Ohio | 2,302,815 | $1,353 | $1,016 | $+338 | — | — | — | — |
| Pittsburgh, PA | Pennsylvania | 2,429,917 | $1,299 | $1,138 | $+161 | — | — | 88.2 | — |
| Memphis, TN-MS-AR | Tennessee | 1,339,345 | $1,274 | $975 | $+299 | — | — | — | — |
| Louisville/Jefferson County, KY-IN | Kentucky | 1,394,234 | $1,272 | $900 | $+372 | — | — | — | — |
| Birmingham, AL | Alabama | 1,192,583 | $1,266 | $879 | $+387 | — | 51.3 | — | — |
| Oklahoma City, OK | Oklahoma | 1,497,821 | $1,244 | $937 | $+307 | — | 56.3 | 103.4 | — |
| St. Louis, MO-IL | Missouri | 2,811,927 | $1,218 | $888 | $+330 | — | — | — | — |
How this differs from our state affordability pages
- Service wages vs Fair Market Rent — state OEWS May 2025 occupation medians ÷ statewide county-median FMR.
- Fair Market Rent vs daycare prices — state FMR vs NDCP center-based infant care prices.
- This page — metro/MSA HUD FMR × QCEW industry average weekly wages for the 50 largest MSAs, plus metro-vs-state FMR premiums.
OEWS May 2025 metropolitan files were not retrievable on 2026-09-16 (BLS returned HTTP 403 to automated and browser-assisted downloads). We pivoted to QCEW metro industry wages rather than invent OEWS cells. Same SOCs as the state wage hub remain on wages by state.
Planning next steps
- How to start a cleaning business · cleaning business insurance
- Landscaping business guide · landscaping insurance
- HVAC business guide · HVAC insurance
- How to start a daycare · daycare insurance · FMR vs daycare prices (state)
Methods (brief)
- Metro set: 50 largest MSAs by Census Vintage 2024
POPESTIMATE2024(LSAD = Metropolitan Statistical Area). - FMR: HUD User FY2026
metroareasfrom the same archivedfmr/statedataextracts as our state FMR pages. For a CBSA with multiple HUD Metro FMR Areas, use the median of component 2BR values (documented in CSV asfmr_method). - Wages: QCEW 2024 annual CSV by industry, private ownership (
own_code=5), MSA agglvl (48 for 6-digit NAICS, 47 for 5-digit). Implied hourly = average weekly wage ÷ 40. - Hours: monthly 2BR FMR ÷ implied hourly. Full-time month comparator = 2080÷12 ≈ 173.33 hours (arithmetic only).
- State comparison: statewide unweighted county-median 2BR FMR from the sibling state study, matched on primary state from the Census metro name.
What we do not claim
- FMR ≠ asking rent, owner costs, or commercial shop rent.
- QCEW industry means ≠ OEWS occupation medians; one earner; metro average ≠ every neighborhood.
- Suppressed QCEW cells are shown as unavailable — never zero-filled.
- Not a “best metro to start a business” score.
Sources
- HUD User Fair Market Rents FY2026 — huduser.gov/portal/datasets/fmr.html
- BLS Quarterly Census of Employment and Wages 2024 annual industry files — bls.gov/cew / data.bls.gov/cew
- Census Bureau CBSA population estimates 2024 — census.gov/programs-surveys/popest
- Sibling methods: state wages vs FMR, OEWS wages by state