Research edition: September 16, 2026 · HUD Income Limits FY2026 (state statedata, 4-person 50%/80%) · HUD FMR FY2026 (2BR county median) · Childcare prices: DOL NDCP (mostly 2022)
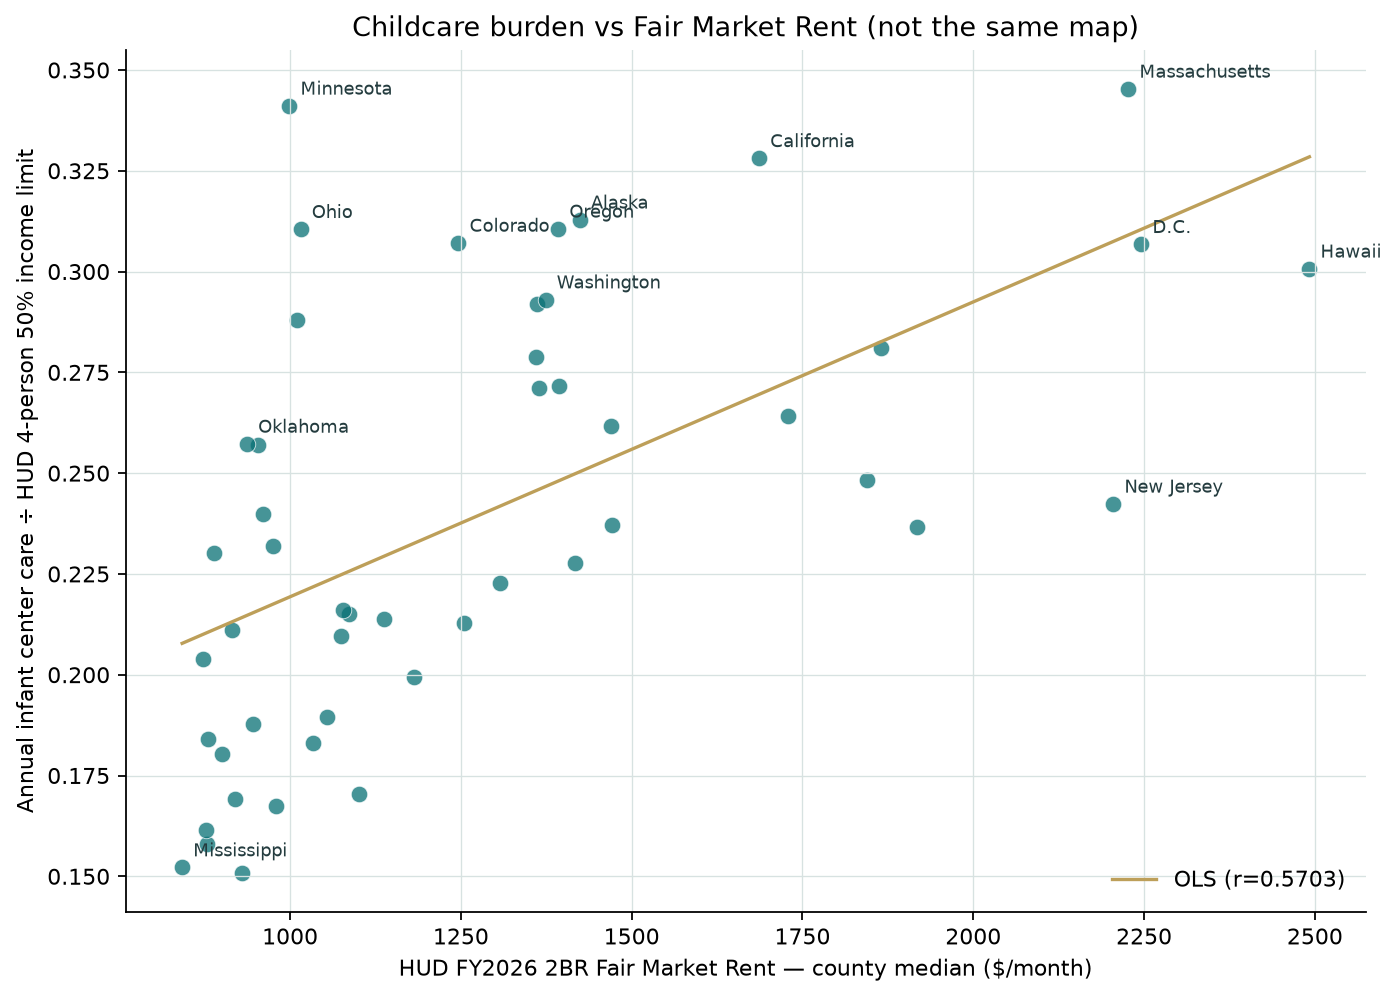
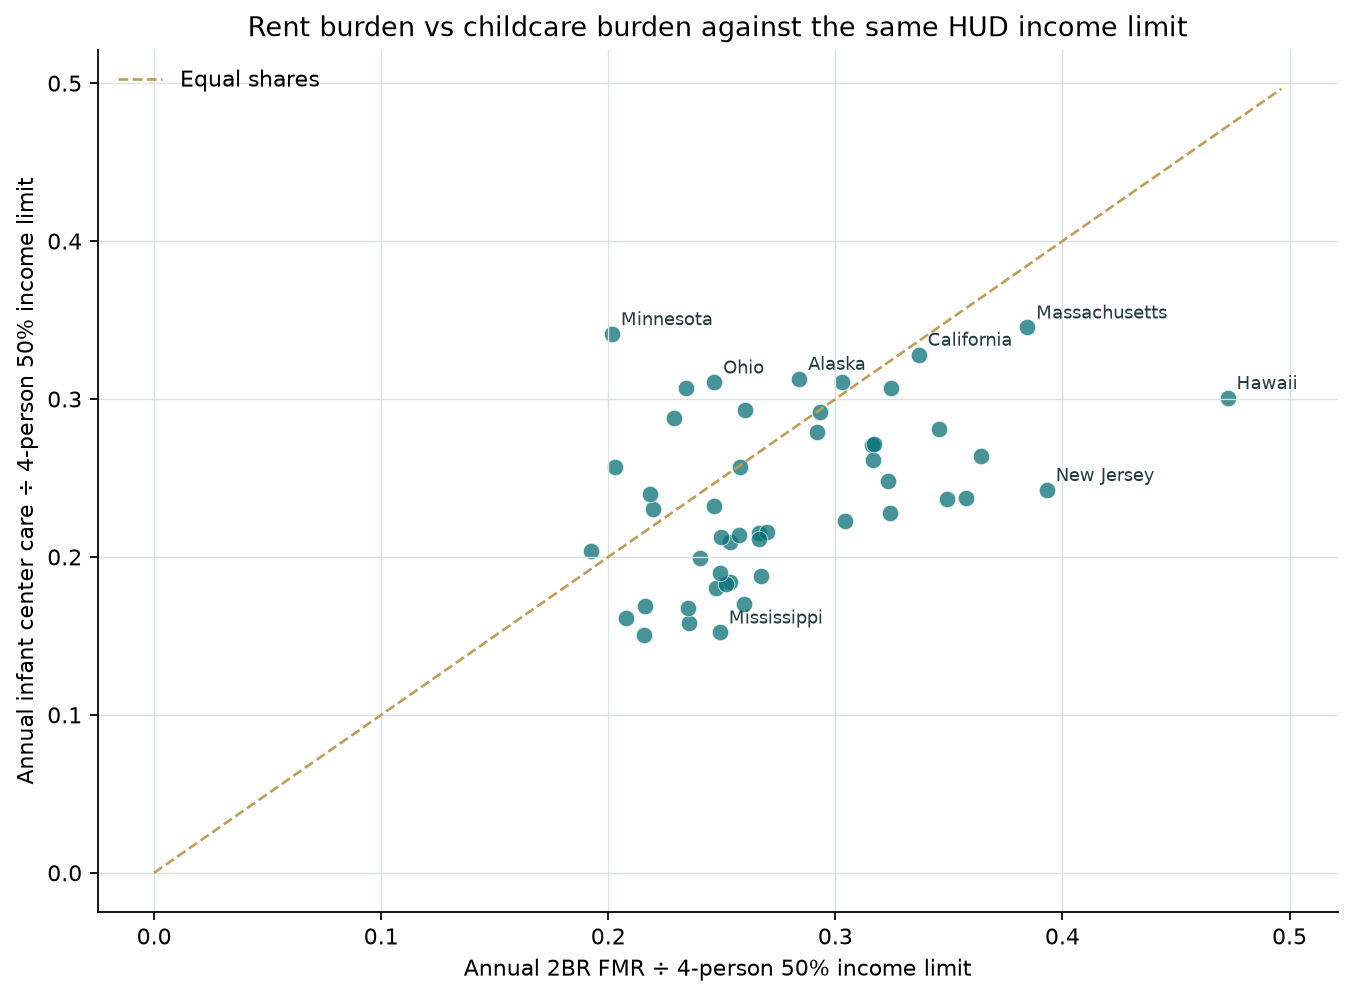
This page pairs HUD income limits (FY2026 statedata Very Low / Low Income for a 4-person household) with daycare / childcare costs — an AMI-style cost-burden view, not a Section 8 or free-childcare eligibility calculator. States where infant care takes a large share of HUD income limits are not the same as the highest Fair Market Rent states. Across 49 states and D.C. with both NDCP infant prices and FY2026 income limits, annual center infant care equals about 24% of the HUD statedata 4-person Very Low Income (50%) limit — roughly 2.8 months of that limit for one year of care. Care-share-of-limit correlates only moderately with FMR but strongly with absolute infant prices.
Companion studies: Fair Market Rent vs daycare prices (housing rents vs tuition), service wages vs Fair Market Rent, and metro wages vs FMR. Absolute parent prices live on childcare prices by state.
Primary sources: HUD Income Limits via the HUD User FMR & Income Limits API; HUD Fair Market Rents; DOL Women’s Bureau NDCP. Year mismatch is labeled in the table.
What income limits vs childcare show
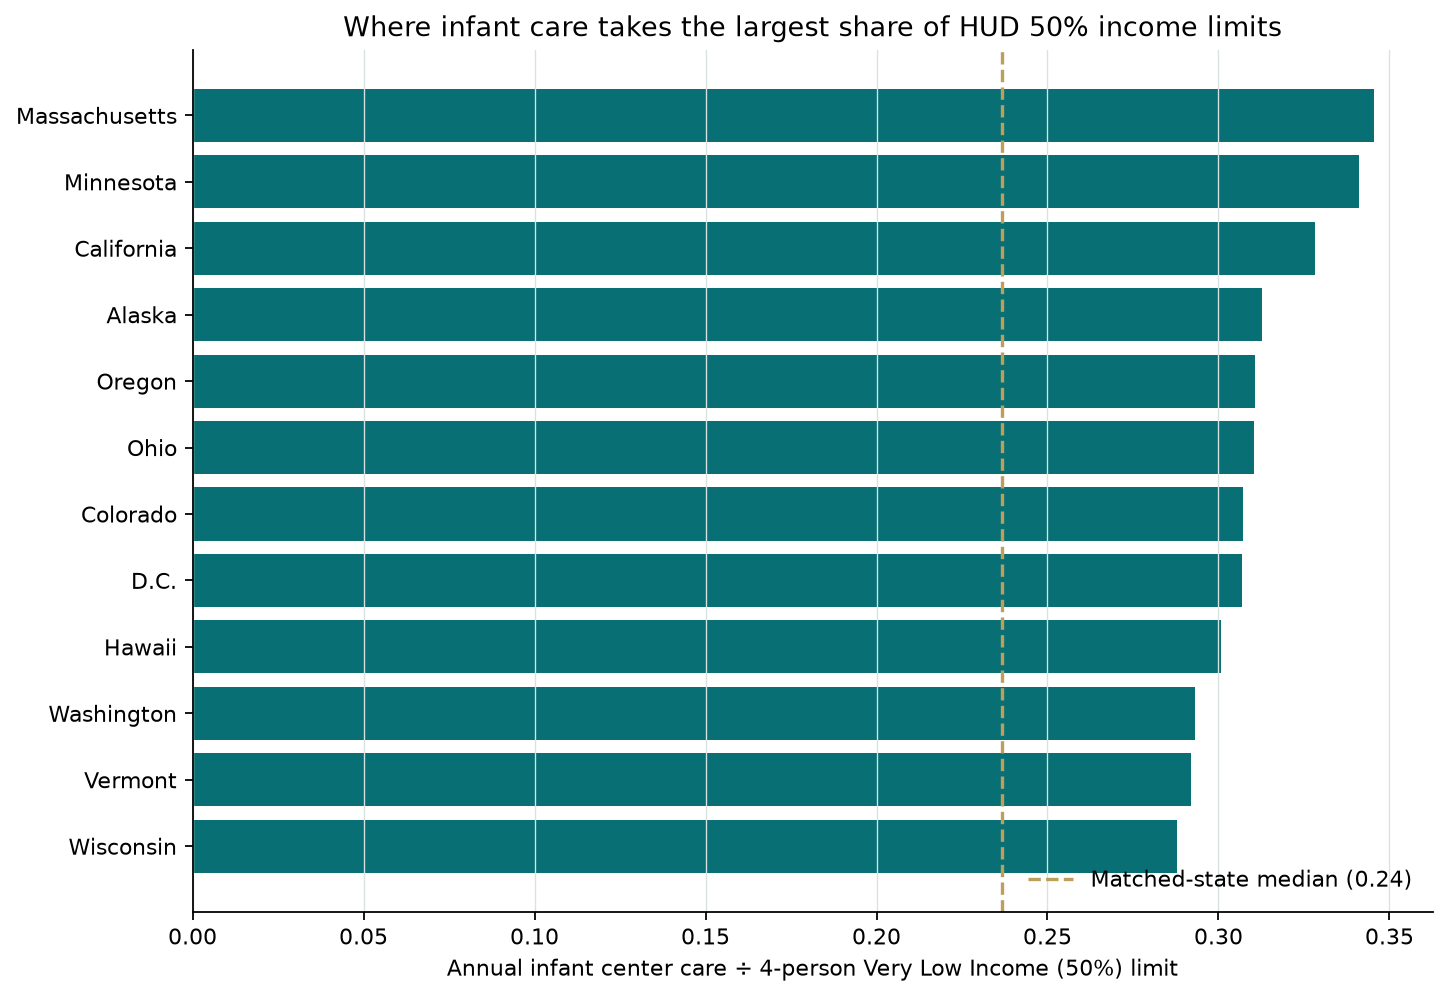
Among matched states, the median HUD statedata 4-person 50% limit is $52,750 and the median 80% limit is $84,400. Median center infant weekly price is $230.00. Median annual infant care ÷ 50% limit is 0.237; ÷ 80% limit is 0.148. Median annual 2BR FMR ÷ 50% limit is 0.260.
- Hypothesis holds: Only 4 of the top-10 care-burden states (infant care ÷ 50% limit) also sit in the top-10 FMR list (California, District of Columbia, Hawaii, Massachusetts). Six top-10 care-burden states are outside top-10 FMR: Alaska, Colorado, Minnesota, Ohio, Oregon, Washington.
- Prices drive the care-share ranking more than rents: Pearson 0.9202 with NDCP infant weekly prices vs 0.5703 with county-median 2BR FMR.
- Highest care shares of the 50% limit: Massachusetts leads at 0.345, with Minnesota close behind despite a mid-pack FMR rank.
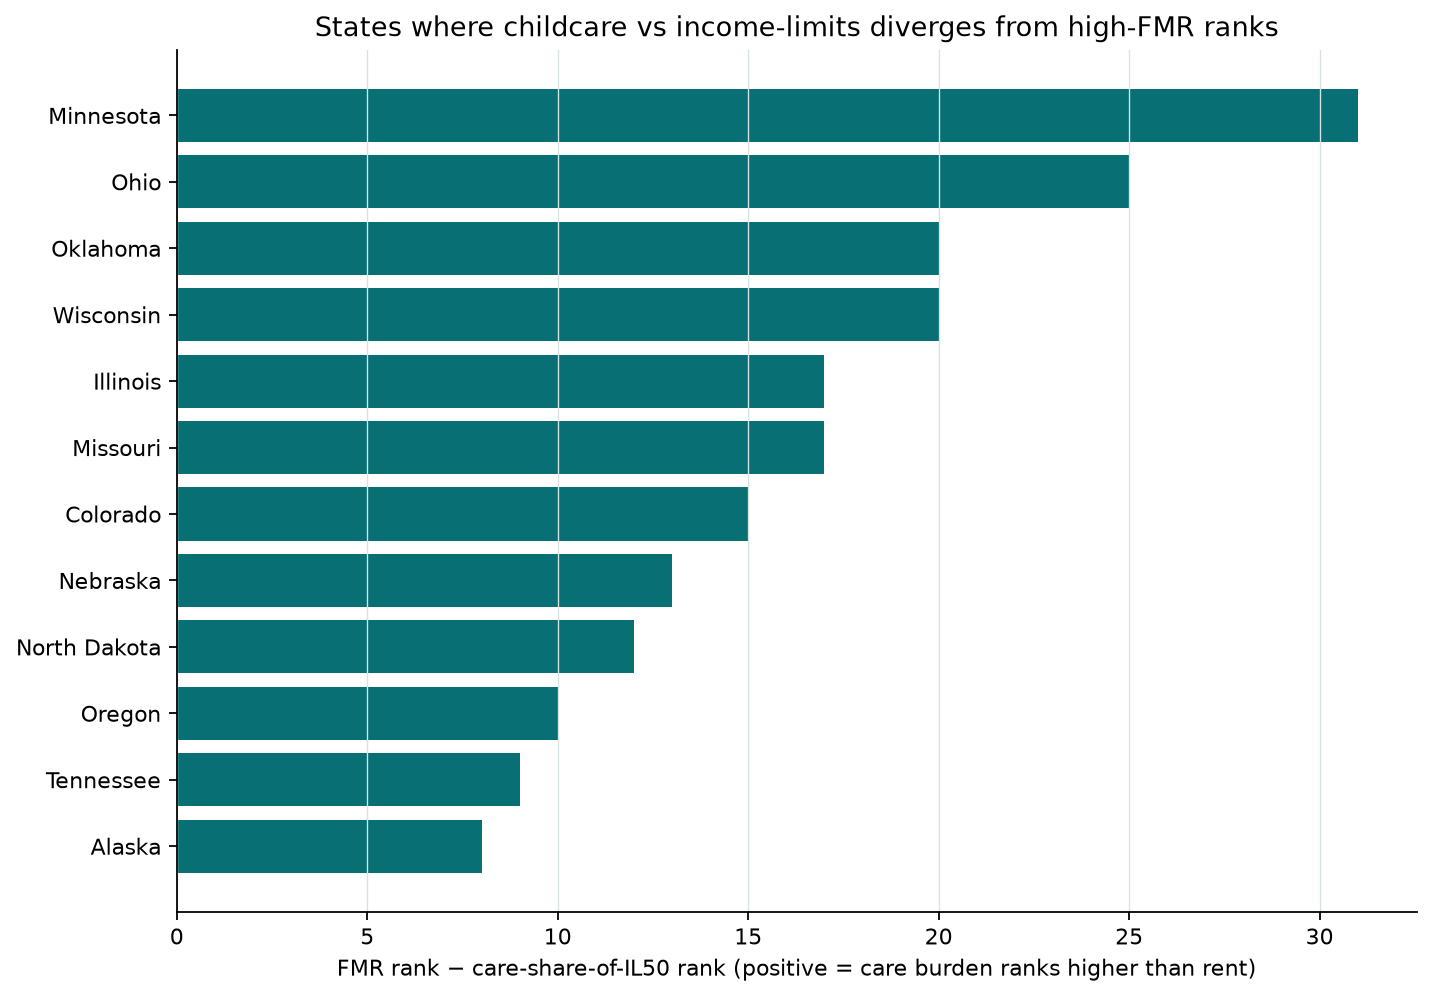
- Rank divergence vs FMR: Minnesota’s care-share rank is #2 while its FMR rank is #33 (gap +31). Ohio, Oklahoma, Wisconsin, and Illinois also show large positive gaps.
- Lower care shares of limits: South Dakota, Mississippi, Alabama, Kansas, Wyoming — often lower absolute infant prices relative to statedata limits, not a claim about voucher access.
- Missing prices: Indiana and New Mexico have no usable NDCP center infant median; income limits and FMR still appear.
Highest annual infant care ÷ 4-person 50% income limit:
- Massachusetts: infant care is 34.5% of the 4-person 50% limit ($461.55/week NDCP 2022 vs $69,500 VLI).
- Minnesota: infant care is 34.1% of the 4-person 50% limit ($390.00/week NDCP 2022 vs $59,450 VLI).
- California: infant care is 32.8% of the 4-person 50% limit ($379.21/week NDCP 2022 vs $60,100 VLI).
- Alaska: infant care is 31.3% of the 4-person 50% limit ($361.90/week NDCP 2022 vs $60,150 VLI).
- Oregon: infant care is 31.1% of the 4-person 50% limit ($329.44/week NDCP 2022 vs $55,150 VLI).
Largest care-vs-FMR rank gaps (FMR rank − care-share rank; positive = burden ranks higher than rent):
- Minnesota: care-share rank #2 vs FMR rank #33 (gap +31).
- Ohio: care-share rank #6 vs FMR rank #31 (gap +25).
- Oklahoma: care-share rank #19 vs FMR rank #39 (gap +20).
- Wisconsin: care-share rank #12 vs FMR rank #32 (gap +20).
- Illinois: care-share rank #20 vs FMR rank #37 (gap +17).
Read this as context, not eligibility advice. HUD income limits vary by household size and by local metro/county area. We use HUD’s official il/statedata 4-person fields as a comparable state endpoint — not a homemade statewide AMI, and not every PHA’s local schedule. A household’s actual limit depends on family size and the HUD area covering their address. This page does not determine Section 8 eligibility.
Charts
State-by-state table
Sort and filter the comparison. State names link to our daycare startup guides. Ranks use only the 49 states/DC with both income limits and infant prices.
| State | IL FY | Statedata AMI | 4p 50% (VLI) | 4p 80% (LI) | 2BR FMR (co. med.) | Price yr | Infant $/wk | Care÷50% | Care÷80% | FMR÷50% | Care rank | FMR rank | Gap |
|---|---|---|---|---|---|---|---|---|---|---|---|---|---|
| Massachusetts | 2026 | $139,000 | $69,500 | $106,800 | $2,227 | 2022 | $461.55 | 34.5% | 22.5% | 38.5% | 1 | 3 | 2 |
| Minnesota | 2026 | $118,900 | $59,450 | $95,100 | $999 | 2022 | $390.00 | 34.1% | 21.3% | 20.2% | 2 | 33 | 31 |
| California | 2026 | $120,200 | $60,100 | $96,150 | $1,686 | 2022 | $379.21 | 32.8% | 20.5% | 33.7% | 3 | 9 | 6 |
| Alaska | 2026 | $120,300 | $60,150 | $96,250 | $1,424 | 2022 | $361.90 | 31.3% | 19.6% | 28.4% | 4 | 12 | 8 |
| Oregon | 2026 | $110,300 | $55,150 | $88,250 | $1,392 | 2022 | $329.44 | 31.1% | 19.4% | 30.3% | 5 | 15 | 10 |
| Ohio | 2026 | $98,800 | $49,400 | $79,050 | $1,016 | 2022 | $295.00 | 31.1% | 19.4% | 24.7% | 6 | 31 | 25 |
| Colorado | 2026 | $127,800 | $63,900 | $102,250 | $1,246 | 2022 | $377.40 | 30.7% | 19.2% | 23.4% | 7 | 22 | 15 |
| District of Columbia | 2026 | $166,100 | $83,050 | $106,800 | $2,246 | 2022 | $490.00 | 30.7% | 23.9% | 32.5% | 8 | 2 | -6 |
| Hawaii | 2026 | $126,500 | $63,250 | $101,200 | $2,492 | 2022 | $365.77 | 30.1% | 18.8% | 47.3% | 9 | 1 | -8 |
| Washington | 2026 | $126,800 | $63,400 | $101,450 | $1,374 | 2022 | $357.31 | 29.3% | 18.3% | 26.0% | 10 | 16 | 6 |
| Vermont | 2026 | $111,500 | $55,750 | $89,200 | $1,362 | 2021 | $313.12 | 29.2% | 18.3% | 29.3% | 11 | 18 | 7 |
| Wisconsin | 2026 | $105,800 | $52,900 | $84,650 | $1,010 | 2022 | $293.00 | 28.8% | 18.0% | 22.9% | 12 | 32 | 20 |
| Connecticut | 2026 | $129,500 | $64,750 | $103,600 | $1,865 | 2022 | $350.00 | 28.1% | 17.6% | 34.6% | 13 | 6 | -7 |
| New York | 2026 | $111,900 | $55,950 | $89,500 | $1,360 | 2022 | $300.00 | 27.9% | 17.4% | 29.2% | 14 | 19 | 5 |
| Nevada | 2026 | $101,600 | $52,750 | $84,400 | $1,393 | 2022 | $275.63 | 27.2% | 17.0% | 31.7% | 15 | 14 | -1 |
| Arizona | 2026 | $103,600 | $51,800 | $82,900 | $1,365 | 2022 | $270.00 | 27.1% | 16.9% | 31.6% | 16 | 17 | 1 |
| Rhode Island | 2026 | $114,000 | $57,000 | $91,200 | $1,729 | 2022 | $289.59 | 26.4% | 16.5% | 36.4% | 17 | 8 | -9 |
| Delaware | 2026 | $111,400 | $55,700 | $89,100 | $1,470 | 2022 | $280.28 | 26.2% | 16.4% | 31.7% | 18 | 11 | -7 |
| Oklahoma | 2026 | $87,100 | $43,550 | $69,700 | $937 | 2022 | $215.46 | 25.7% | 16.1% | 25.8% | 19 | 39 | 20 |
| Illinois | 2026 | $112,600 | $56,300 | $90,100 | $952 | 2022 | $278.33 | 25.7% | 16.1% | 20.3% | 20 | 37 | 17 |
| Maryland | 2026 | $137,100 | $68,550 | $106,800 | $1,845 | 2022 | $327.39 | 24.8% | 15.9% | 32.3% | 21 | 7 | -14 |
| New Jersey | 2026 | $134,600 | $67,300 | $106,800 | $2,205 | 2022 | $313.73 | 24.2% | 15.3% | 39.3% | 22 | 4 | -18 |
| Nebraska | 2026 | $105,700 | $52,850 | $84,550 | $961 | 2022 | $243.75 | 24.0% | 15.0% | 21.8% | 23 | 36 | 13 |
| Florida | 2026 | $98,700 | $49,350 | $78,950 | $1,471 | 2022 | $225.00 | 23.7% | 14.8% | 35.8% | 24 | 10 | -14 |
| New Hampshire | 2026 | $131,800 | $65,900 | $105,450 | $1,918 | 2022 | $300.05 | 23.7% | 14.8% | 34.9% | 25 | 5 | -20 |
| Tennessee | 2026 | $94,900 | $47,450 | $75,900 | $975 | 2022 | $211.67 | 23.2% | 14.5% | 24.7% | 26 | 35 | 9 |
| Missouri | 2026 | $97,100 | $48,550 | $77,700 | $888 | 2020 | $214.94 | 23.0% | 14.4% | 21.9% | 27 | 44 | 17 |
| Maine | 2026 | $105,000 | $52,500 | $84,000 | $1,418 | 2022 | $230.00 | 22.8% | 14.2% | 32.4% | 28 | 13 | -15 |
| Montana | 2026 | $103,100 | $51,550 | $82,500 | $1,307 | 2022 | $220.81 | 22.3% | 13.9% | 30.4% | 29 | 20 | -9 |
| South Carolina | 2026 | $95,800 | $47,900 | $76,650 | $1,077 | 2022 | $198.93 | 21.6% | 13.5% | 27.0% | 30 | 27 | -3 |
| North Carolina | 2026 | $97,900 | $48,950 | $78,300 | $1,086 | 2022 | $202.52 | 21.5% | 13.4% | 26.6% | 31 | 26 | -5 |
| Pennsylvania | 2026 | $106,000 | $53,000 | $84,800 | $1,138 | 2020 | $217.90 | 21.4% | 13.4% | 25.8% | 32 | 24 | -8 |
| Virginia | 2026 | $120,500 | $60,250 | $96,400 | $1,254 | 2022 | $246.72 | 21.3% | 13.3% | 25.0% | 33 | 21 | -12 |
| West Virginia | 2026 | $82,500 | $41,250 | $66,000 | $915 | 2022 | $167.49 | 21.1% | 13.2% | 26.6% | 34 | 42 | 8 |
| Georgia | 2026 | $101,700 | $50,850 | $81,350 | $1,074 | 2022 | $205.00 | 21.0% | 13.1% | 25.3% | 35 | 28 | -7 |
| North Dakota | 2026 | $109,000 | $54,500 | $87,200 | $873 | 2022 | $213.81 | 20.4% | 12.8% | 19.2% | 36 | 48 | 12 |
| Utah | 2026 | $118,000 | $59,000 | $94,400 | $1,181 | 2022 | $226.27 | 19.9% | 12.5% | 24.0% | 37 | 23 | -14 |
| Texas | 2026 | $101,500 | $50,750 | $81,200 | $1,054 | 2022 | $185.00 | 19.0% | 11.8% | 24.9% | 38 | 29 | -9 |
| Louisiana | 2026 | $84,900 | $42,450 | $67,900 | $946 | 2022 | $153.33 | 18.8% | 11.7% | 26.7% | 39 | 38 | -1 |
| Arkansas | 2026 | $83,300 | $41,650 | $66,650 | $880 | 2021 | $147.50 | 18.4% | 11.5% | 25.4% | 40 | 45 | 5 |
| Michigan | 2026 | $98,400 | $49,200 | $78,700 | $1,033 | 2022 | $173.20 | 18.3% | 11.4% | 25.2% | 41 | 30 | -11 |
| Kentucky | 2026 | $87,300 | $43,650 | $69,850 | $900 | 2022 | $151.30 | 18.0% | 11.3% | 24.7% | 42 | 43 | 1 |
| Idaho | 2026 | $101,600 | $50,800 | $81,300 | $1,100 | 2022 | $166.41 | 17.0% | 10.6% | 26.0% | 43 | 25 | -18 |
| Iowa | 2026 | $102,100 | $51,050 | $81,700 | $919 | 2022 | $165.98 | 16.9% | 10.6% | 21.6% | 44 | 41 | -3 |
| Wyoming | 2026 | $100,100 | $50,050 | $80,100 | $980 | 2022 | $161.17 | 16.7% | 10.5% | 23.5% | 45 | 34 | -11 |
| Kansas | 2026 | $101,300 | $50,650 | $81,050 | $877 | 2022 | $157.33 | 16.2% | 10.1% | 20.8% | 46 | 47 | 1 |
| Alabama | 2026 | $89,500 | $44,750 | $71,600 | $879 | 2022 | $136.01 | 15.8% | 9.9% | 23.6% | 47 | 46 | -1 |
| Mississippi | 2026 | $81,100 | $40,550 | $64,900 | $842 | 2022 | $118.68 | 15.2% | 9.5% | 24.9% | 48 | 49 | 1 |
| South Dakota | 2026 | $103,400 | $51,700 | $82,700 | $929 | 2022 | $150.00 | 15.1% | 9.4% | 21.6% | 49 | 40 | -9 |
| Indiana | 2026 | $95,300 | $47,650 | $76,250 | $1,008 | — | — | — | — | 25.4% | — | — | — |
| New Mexico | 2026 | $89,000 | $44,500 | $71,200 | $1,040 | — | — | — | — | 28.0% | — | — | — |
Download the CSV (same columns, machine-readable).
Planning notes for daycare operators
Parent tuition that is high relative to local assistance income thresholds can shape who pays privately versus who seeks subsidies — but PHA rules, wait lists, and voucher payment standards are local. For opening or expanding a center, pair this eligibility-context view with:
- Childcare prices by state — absolute NDCP parent prices
- Daycare wages vs parent prices — labor cost vs tuition
- Childcare availability by state — supply context
- Daycare insurance — coverage next step for operators
- State guides linked in the table (e.g., licensing and startup paths under each daycare hub state page)
FAQ
What percentage of income should be spent on childcare?
This page does not set a budgeting rule. Descriptively, among 49 matched states/D.C., annual center infant care is about 23.7% of the HUD 4-person Very Low Income (50%) limit and about 14.8% of the Low Income (80%) limit (NDCP prices mostly 2022; limits FY2026). Shares vary widely by state — Massachusetts ~34.5% of the 50% limit; South Dakota ~15.1%.
Is there an income limit for HUD?
HUD publishes income limits used in assisted-housing programs (here: statedata 4-person Very Low Income / 50% and Low Income / 80%, FY2026). Median matched-state 50% limit is about $52,750 and 80% about $84,400 on this page’s extract. We compare daycare costs to those limits as a burden metric — not legal advice on whether any household qualifies.
What are the income limits for HUD-assisted housing in Oregon in 2026?
On this page’s FY2026 statedata extract, Oregon’s 4-person Very Low Income (50%) limit is $55,150 and Low Income (80%) is in the same state row (see downloadable CSV). Oregon ranks high on infant-care share of the 50% limit (~31.1% / center infant ~$329.44 weekly, mostly 2022). County-level limits and program eligibility can differ — check HUD User / local PHA for official determinations.
Which states have the lowest costs for daycare?
Absolute NDCP center infant weekly medians on the companion wage-price table put Mississippi lowest ($118.68), then Alabama and Arkansas. On this income-limits page, the lowest care ÷ 50% limit shares include South Dakota (~15.1%), Mississippi (~15.2%), Alabama (~15.8%), Kansas, and Wyoming — lower shares relative to limits, not “easy eligibility.”
Methods, sources, and limits
Dataset schema
- Income limits: HUD User API
il/statedata/{ST}?year=2026— fieldsmedian_income,very_low.il50_p4,low.il80_p4. D.C. usedil/data/1100199999after statedata HTTP 400. - FMR: HUD
fmr/statedataFY2026; statewide figure = unweighted median of county 2BR FMRs (town rows collapsed first). - Prices: DOL NDCP state center infant weekly medians (mostly 2022).
- Care÷50%: (weekly × 52) ÷ 4-person Very Low Income limit.
- FMR÷50%: (monthly county-median 2BR × 12) ÷ same 50% limit.
- Gap: FMR rank − care-share rank (positive = care burden ranks ahead of rent).
Why statedata is not “median of counties”
HUD publishes state endpoint income limits separately from county/metro area limits. A sample of county il/data pulls for Arkansas (75 counties) found statedata 4-person 50% at $41,650 versus an unweighted county median of $35,550. California’s sample (40 counties returned) showed statedata $60,100 vs county median $50,950. We use statedata deliberately as HUD’s state fields — we do not invent a statewide AMI by averaging counties.
Limitations
- Not legal advice; not a household eligibility calculator.
- Not a ranking of “best states for Section 8.”
- FY2026 income limits/FMR vs mostly-2022 NDCP prices — years differ; dollars are nominal.
- 4-person limits only; other household sizes differ.
- FMR is a program rent estimate, not asking rent or commercial daycare rent.
- Indiana and New Mexico lack NDCP center infant medians in the state workbook.
Full methods live with the study artifacts under hud-income-limits-daycare-2026-09-16/METHODS.md.