BEA Regional Price Parities, 2024 (latest available) · state minimum wage rates · EIA electricity sales, August 2025 to July 2026 · Last updated October 1, 2026
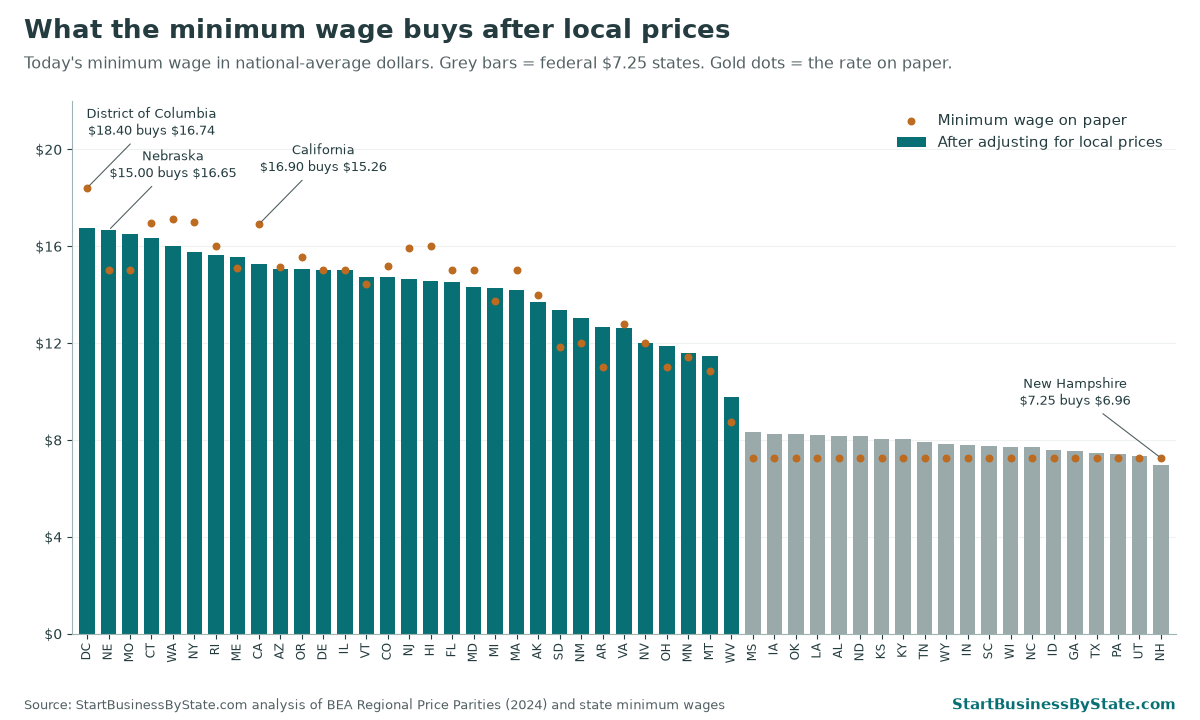
After adjusting for local prices, Nebraska’s $15.00 minimum wage buys more than any other state’s. Only Washington, D.C., a city, is higher. It’s worth $16.65 at national-average prices, because prices in Nebraska are about 10% below average. California’s $16.90 is worth $15.26 after its higher prices. New Hampshire’s $7.25 buys the least: $6.96.
Key findings
- Nebraska ranks first among states today: $15.00 is worth $16.65 at national-average prices. Only Washington, D.C., is higher: its $18.40 is worth $16.74.
- Missouri is close behind: its $15.00 is worth $16.52. Connecticut ($16.35) and Washington ($16.01) come next.
- California drops to ninth, counting D.C. Its $16.90 minimum, among the highest on paper, is worth $15.26 after prices.
- Florida’s new $15.00 is worth $14.50, because Florida prices are about 3% above average.
- In 2027, Nebraska stays first at $16.94, with its official $15.26 rate. Connecticut ($16.87), D.C. ($16.74), Rhode Island ($16.62) and Washington ($16.57) follow.
- New Hampshire’s $7.25 buys the least in the country, $6.96, because prices there are above average. Utah ($7.33) and Pennsylvania ($7.43) are next.
- An average home electric bill takes 25.5 hours of minimum-wage work in Alabama, compared with 7.4 hours in Colorado.
The minimum wage after local prices
The ranking in 2027
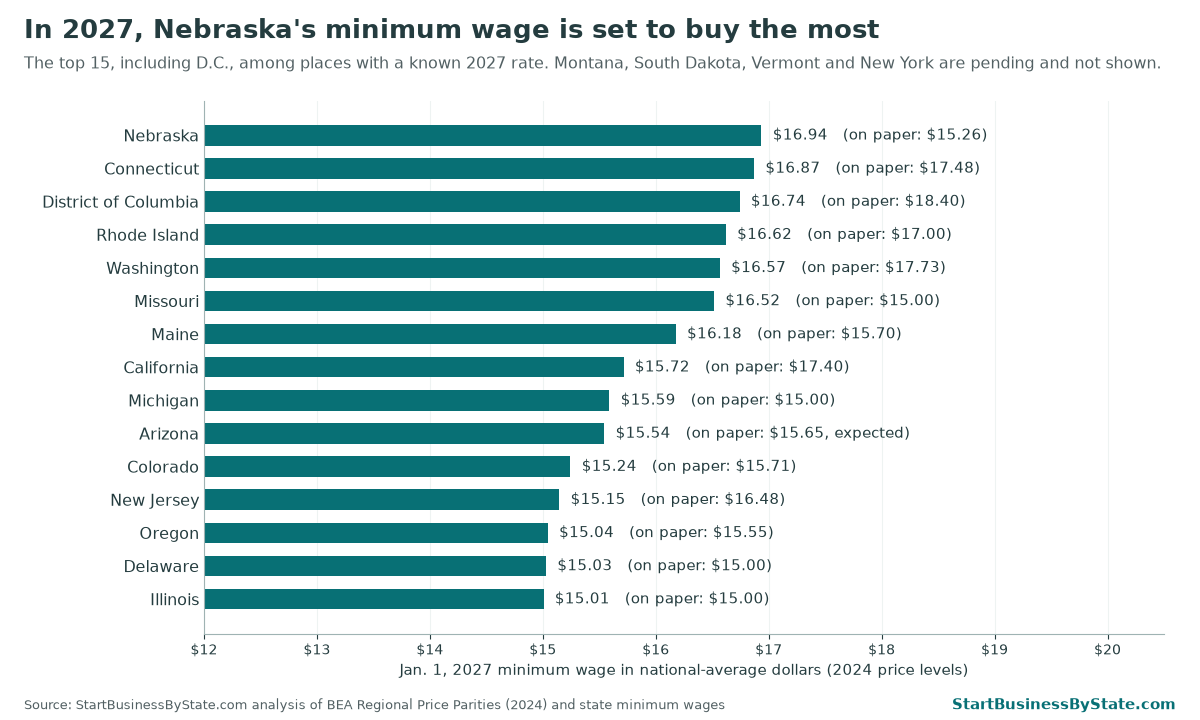
Michigan moves up the most, nine places: its raise to $15.00 lifts it from $14.27 to $15.59 in national-average dollars.
All 50 states and D.C.
Click a column heading to sort. “Price level” is 100 for the national average.
| Rank today | State | Minimum wage today | Price level (2024) | What it buys today | Minimum wage Jan. 1, 2027 | What it buys in 2027 | Rank in 2027 |
|---|---|---|---|---|---|---|---|
| 1 | District of Columbia | $18.40 | 109.9 | $16.74 | $18.40 | $16.74 | 3 |
| 2 | Nebraska | $15.00 | 90.1 | $16.65 | $15.26 | $16.94 | 1 |
| 3 | Missouri | $15.00 | 90.8 | $16.52 | $15.00 | $16.52 | 6 |
| 4 | Connecticut | $16.94 | 103.6 | $16.35 | $17.48 | $16.87 | 2 |
| 5 | Washington | $17.13 | 107.0 | $16.01 | $17.73 | $16.57 | 5 |
| 6 | New York | $17.00 | 107.9 | $15.75 | Pending | — | — |
| 7 | Rhode Island | $16.00 | 102.3 | $15.64 | $17.00 | $16.62 | 4 |
| 8 | Maine | $15.10 | 97.0 | $15.56 | $15.70 | $16.18 | 7 |
| 9 | California | $16.90 | 110.7 | $15.26 | $17.40 | $15.72 | 8 |
| 10 | Arizona | $15.15 | 100.7 | $15.05 | $15.65 expected | $15.54 | 10 |
| 11 | Oregon | $15.55 | 103.4 | $15.04 | $15.55 | $15.04 | 13 |
| 12 | Delaware | $15.00 | 99.8 | $15.03 | $15.00 | $15.03 | 14 |
| 13 | Illinois | $15.00 | 100.0 | $15.01 | $15.00 | $15.01 | 15 |
| 14 | Vermont | $14.42 | 98.0 | $14.72 | Pending | — | — |
| 15 | Colorado | $15.16 | 103.1 | $14.71 | $15.71 | $15.24 | 11 |
| 16 | New Jersey | $15.92 | 108.8 | $14.63 | $16.48 | $15.15 | 12 |
| 17 | Hawaii | $16.00 | 110.0 | $14.55 | $16.00 | $14.55 | 16 |
| 18 | Florida | $15.00 | 103.4 | $14.50 | $15.00 | $14.50 | 17 |
| 19 | Maryland | $15.00 | 105.0 | $14.29 | $15.00 | $14.29 | 18 |
| 20 | Michigan | $13.73 | 96.2 | $14.27 | $15.00 | $15.59 | 9 |
| 21 | Massachusetts | $15.00 | 105.8 | $14.18 | $15.00 | $14.18 | 19 |
| 22 | Alaska | $14.00 | 102.4 | $13.68 | $14.00 | $13.68 | 20 |
| 23 | South Dakota | $11.85 | 88.6 | $13.38 | Pending | — | — |
| 24 | New Mexico | $12.00 | 92.2 | $13.01 | $12.00 | $13.01 | 22 |
| 25 | Arkansas | $11.00 | 86.9 | $12.65 | $11.00 | $12.65 | 23 |
| 26 | Virginia | $12.77 | 101.1 | $12.63 | $13.75 | $13.60 | 21 |
| 27 | Nevada | $12.00 | 100.0 | $12.00 | $12.00 | $12.00 | 26 |
| 28 | Ohio | $11.00 | 92.8 | $11.86 | $11.40 | $12.29 | 24 |
| 29 | Minnesota | $11.41 | 98.6 | $11.57 | $11.87 | $12.04 | 25 |
| 30 | Montana | $10.85 | 94.6 | $11.46 | Pending | — | — |
| 31 | West Virginia | $8.75 | 89.5 | $9.78 | $8.75 | $9.78 | 27 |
| 32 | Mississippi | $7.25 | 87.0 | $8.34 | $7.25 | $8.34 | 28 |
| 33 | Iowa | $7.25 | 87.8 | $8.26 | $7.25 | $8.26 | 29 |
| 34 | Oklahoma | $7.25 | 87.8 | $8.25 | $7.25 | $8.25 | 30 |
| 35 | Louisiana | $7.25 | 88.2 | $8.22 | $7.25 | $8.22 | 31 |
| 36 | Alabama | $7.25 | 88.8 | $8.16 | $7.25 | $8.16 | 32 |
| 37 | North Dakota | $7.25 | 89.0 | $8.15 | $7.25 | $8.15 | 33 |
| 38 | Kansas | $7.25 | 90.1 | $8.05 | $7.25 | $8.05 | 34 |
| 39 | Kentucky | $7.25 | 90.2 | $8.04 | $7.25 | $8.04 | 35 |
| 40 | Tennessee | $7.25 | 91.9 | $7.89 | $7.25 | $7.89 | 36 |
| 41 | Wyoming | $7.25 | 92.7 | $7.82 | $7.25 | $7.82 | 37 |
| 42 | Indiana | $7.25 | 93.3 | $7.77 | $7.25 | $7.77 | 38 |
| 43 | South Carolina | $7.25 | 93.7 | $7.73 | $7.25 | $7.73 | 39 |
| 44 | Wisconsin | $7.25 | 94.1 | $7.70 | $7.25 | $7.70 | 40 |
| 45 | North Carolina | $7.25 | 94.3 | $7.69 | $7.25 | $7.69 | 41 |
| 46 | Idaho | $7.25 | 95.5 | $7.59 | $7.25 | $7.59 | 42 |
| 47 | Georgia | $7.25 | 96.3 | $7.53 | $7.25 | $7.53 | 43 |
| 48 | Texas | $7.25 | 97.1 | $7.47 | $7.25 | $7.47 | 44 |
| 49 | Pennsylvania | $7.25 | 97.6 | $7.43 | $7.25 | $7.43 | 45 |
| 50 | Utah | $7.25 | 98.9 | $7.33 | $7.25 | $7.33 | 46 |
| 51 | New Hampshire | $7.25 | 104.2 | $6.96 | $7.25 | $6.96 | 47 |
2027 ranks cover the 46 states and D.C. with a known rate. Pending rates are explained in the 2027 minimum wage by state.
Hours of work to pay the electric bill
Another way to see it: how many hours at minimum wage it takes to pay an average home electric bill. In Alabama, the average bill was $184.99 a month, or 25.5 hours at $7.25. In Colorado, a $112.27 bill takes 7.4 hours at $15.16.
See all 50 states and D.C.
| State | Average monthly home electric bill | Minimum wage today | Hours of work |
|---|---|---|---|
| Alabama | $184.99 | $7.25 | 25.5 |
| Texas | $176.05 | $7.25 | 24.3 |
| Pennsylvania | $173.84 | $7.25 | 24.0 |
| Mississippi | $171.39 | $7.25 | 23.6 |
| New Hampshire | $171.02 | $7.25 | 23.6 |
| South Carolina | $165.34 | $7.25 | 22.8 |
| Tennessee | $162.48 | $7.25 | 22.4 |
| Georgia | $161.64 | $7.25 | 22.3 |
| Indiana | $158.42 | $7.25 | 21.9 |
| Louisiana | $155.93 | $7.25 | 21.5 |
| Kentucky | $154.20 | $7.25 | 21.3 |
| North Carolina | $152.01 | $7.25 | 21.0 |
| Oklahoma | $144.16 | $7.25 | 19.9 |
| West Virginia | $163.10 | $8.75 | 18.6 |
| North Dakota | $132.43 | $7.25 | 18.3 |
| Kansas | $132.04 | $7.25 | 18.2 |
| Wisconsin | $124.49 | $7.25 | 17.2 |
| Iowa | $120.90 | $7.25 | 16.7 |
| Wyoming | $114.50 | $7.25 | 15.8 |
| Idaho | $114.31 | $7.25 | 15.8 |
| Ohio | $158.14 | $11.00 | 14.4 |
| Utah | $103.56 | $7.25 | 14.3 |
| Hawaii | $223.76 | $16.00 | 14.0 |
| Maryland | $208.64 | $15.00 | 13.9 |
| Virginia | $173.22 | $12.77 | 13.6 |
| Arkansas | $140.72 | $11.00 | 12.8 |
| Massachusetts | $182.31 | $15.00 | 12.2 |
| South Dakota | $140.05 | $11.85 | 11.8 |
| Connecticut | $195.67 | $16.94 | 11.6 |
| Florida | $169.13 | $15.00 | 11.3 |
| Alaska | $157.63 | $14.00 | 11.3 |
| Delaware | $165.17 | $15.00 | 11.0 |
| Arizona | $161.93 | $15.15 | 10.7 |
| Montana | $114.70 | $10.85 | 10.6 |
| Minnesota | $120.28 | $11.41 | 10.5 |
| Maine | $155.97 | $15.10 | 10.3 |
| Rhode Island | $164.01 | $16.00 | 10.3 |
| Nevada | $119.39 | $12.00 | 9.9 |
| New Jersey | $157.96 | $15.92 | 9.9 |
| New York | $166.75 | $17.00 | 9.8 |
| Vermont | $140.59 | $14.42 | 9.7 |
| Missouri | $145.28 | $15.00 | 9.7 |
| Michigan | $132.70 | $13.73 | 9.7 |
| California | $160.84 | $16.90 | 9.5 |
| Illinois | $131.51 | $15.00 | 8.8 |
| Oregon | $131.63 | $15.55 | 8.5 |
| District of Columbia | $152.55 | $18.40 | 8.3 |
| New Mexico | $99.35 | $12.00 | 8.3 |
| Nebraska | $122.67 | $15.00 | 8.2 |
| Washington | $131.56 | $17.13 | 7.7 |
| Colorado | $112.27 | $15.16 | 7.4 |
Average bill = total residential electricity revenue ÷ residential customers ÷ 12, August 2025 to July 2026, from the U.S. Energy Information Administration. It’s a state average, not a typical household’s bill.
What this means for you
- If you’re choosing where to start a business, the minimum wage on paper is only half the story. A lower-cost state with a $15 minimum can be a bigger pay commitment, in real terms, than a high-cost state with a higher number. Compare wages and daycare costs after local prices.
- For hiring, what matters to workers is what the paycheck buys. See service wages vs. rent and typical wages by state.
More from our 2027 minimum wage research
- 2027 minimum wage by state: every state's rate on January 1, 2027
- Minimum wage vs. rent by state: hours of work it takes to rent a one-bedroom
- 2027 minimum wage vs. what workers earn: which jobs the new rates reach
- What the 2027 raises cost a small business: extra payroll for a 10-person team
- Minimum wage gaps between neighboring states: border pairs like Washington and Idaho
- Real minimum wage by state (this page)
Cite or share this data
Reporters and researchers are welcome to use the table and charts. Please credit and link to this page.
Source: StartBusinessByState.com analysis of BEA Regional Price Parities and state minimum wages (October 1, 2026). https://startbusinessbystate.com/real-minimum-wage-by-state/
Methods and caveats
- Prices. U.S. Bureau of Economic Analysis Regional Price Parities for 2024, all items, by state. This is the newest release; 2025 figures are expected around December 2026. We use 2024 price levels for both today’s and 2027 rates.
- Adjusted minimum wage = minimum wage × 100 ÷ price level.
- Minimum wages are statewide rates from our 2027 minimum wage tracker. Nebraska’s 2027 rate is the official $15.26 from the state labor department. Arizona’s is expected, from news reports. Montana, South Dakota, Vermont and New York are pending and left out of the 2027 ranking. Local minimum wages aren’t included.
- Limits. The price index covers everything people buy, at average prices across the state. It isn’t built for low-income households, and prices vary a lot within a state.
- Electric bills. U.S. Energy Information Administration retail sales data, residential sector, August 2025 to July 2026.
FAQ
What is a Regional Price Parity?
It’s a price index from the U.S. Bureau of Economic Analysis that compares the cost of goods, services and housing in each state with the national average, which is set at 100. California’s is 110.7, so prices there are about 11% above average. Nebraska’s is 90.1, about 10% below.
How do you adjust the minimum wage for prices?
We divide the minimum wage by the state’s price level and multiply by 100. So Nebraska’s $15.00 ÷ 90.1 × 100 = $16.65 in national-average dollars.
Does this mean minimum wage workers are better off in Nebraska than in California?
In terms of what an hour’s pay buys at typical prices, yes. But the price index covers everything people buy, not just what low-income households buy, and it doesn’t include local minimum wages, which are higher in many California cities.
Why use 2024 prices?
The 2024 figures are the newest the government has released. The 2025 figures are expected in December 2026, and we’ll update then.
Can I use these numbers?
Yes. Please credit StartBusinessByState.com and link to this page. The full table is free to download as a CSV.