HMDA 2025 loan records (released 2026) compared with 2024 · Updated by StartBusinessByState
Short answer: About 1 in 10 home purchase mortgages goes to someone buying a property they won’t live in, usually to rent out. That share edged up in 2025 and rose in 33 states. These are loan records, so they cover investors who borrow, from people buying their first rental to small landlords. Cash purchases aren’t in this data.
Key facts for reporters
- 327,200 investor purchase loans in 2025, +4.5% from 313,237 in 2024. Total purchase loans rose +1.3%.
- Highest investor share: Hawaii (16.8%), Arkansas (15.2%), Oklahoma (14.5%), New Jersey (13.3%), Missouri (12.5%). Lowest: Alaska (5.2%), New Mexico (6.1%), Minnesota (6.4%), Colorado (6.5%).
- The investor share rose in 33 states and fell in 15. Biggest increase: New Jersey (+1.4 pts). Biggest decrease: Maine (-0.5 pts).
- Average investor loan: $338,014, vs $394,166 for owner-occupied homes. 69.4% of investor loans were flagged by lenders as business-purpose.
- Second homes were another 2.7% of purchase loans.
- Metro with the highest investor share (5,000+ loans): Miami-Miami Beach-Kendall, FL (division), 20.1%.
Investor share by state
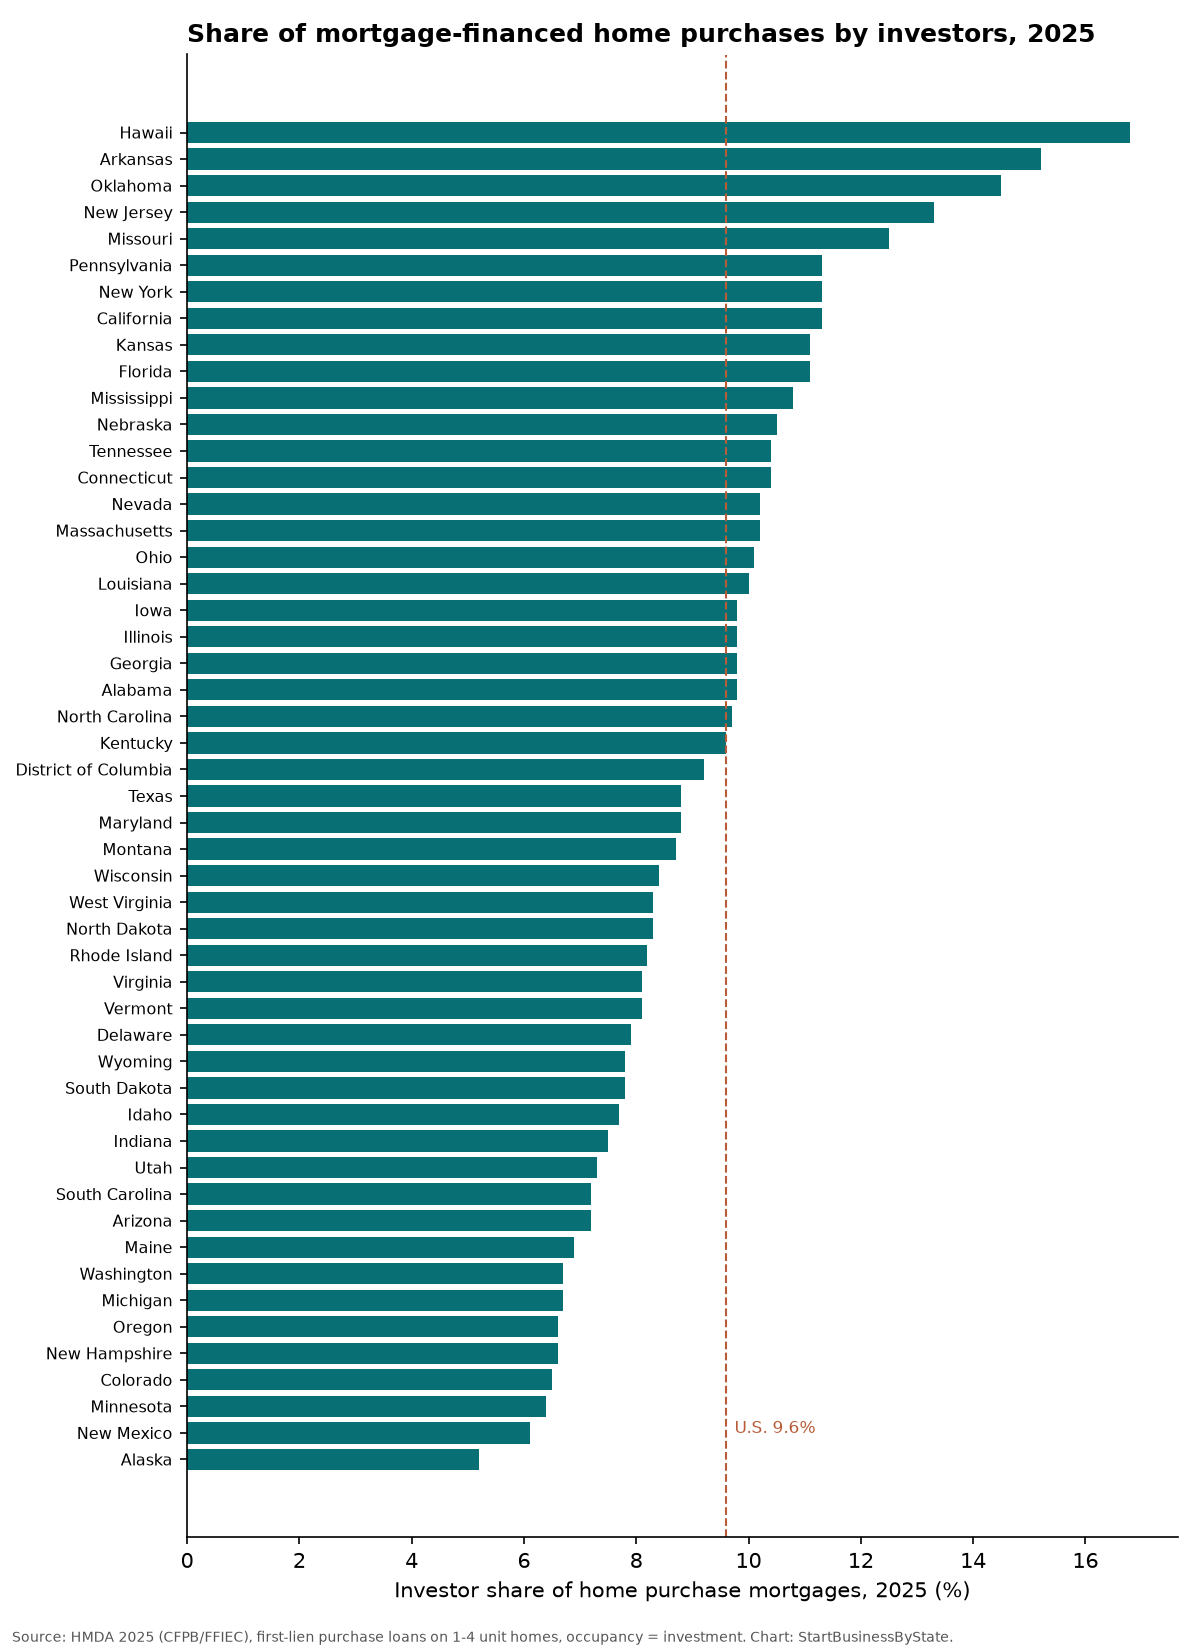
- Hawaii: 16.8% (1,636 investor loans)
- Arkansas: 15.2% (5,550 investor loans)
- Oklahoma: 14.5% (6,647 investor loans)
- New Jersey: 13.3% (10,425 investor loans)
- Missouri: 12.5% (9,471 investor loans)
- California: 11.3% (27,764 investor loans)
- New York: 11.3% (13,202 investor loans)
- Pennsylvania: 11.3% (13,394 investor loans)
- Florida: 11.1% (31,424 investor loans)
- Kansas: 11.1% (3,585 investor loans)
The top of the list mixes very different markets. High-priced Hawaii and New Jersey sit next to lower-priced Arkansas, Oklahoma and Missouri, and across states the investor share shows almost no link to average loan size. Rents, prices, local job markets and borrowing costs can all affect investor demand. This data shows how much mortgage-financed investor buying happened, not why, and not whether it changed prices for other buyers.
Metro areas
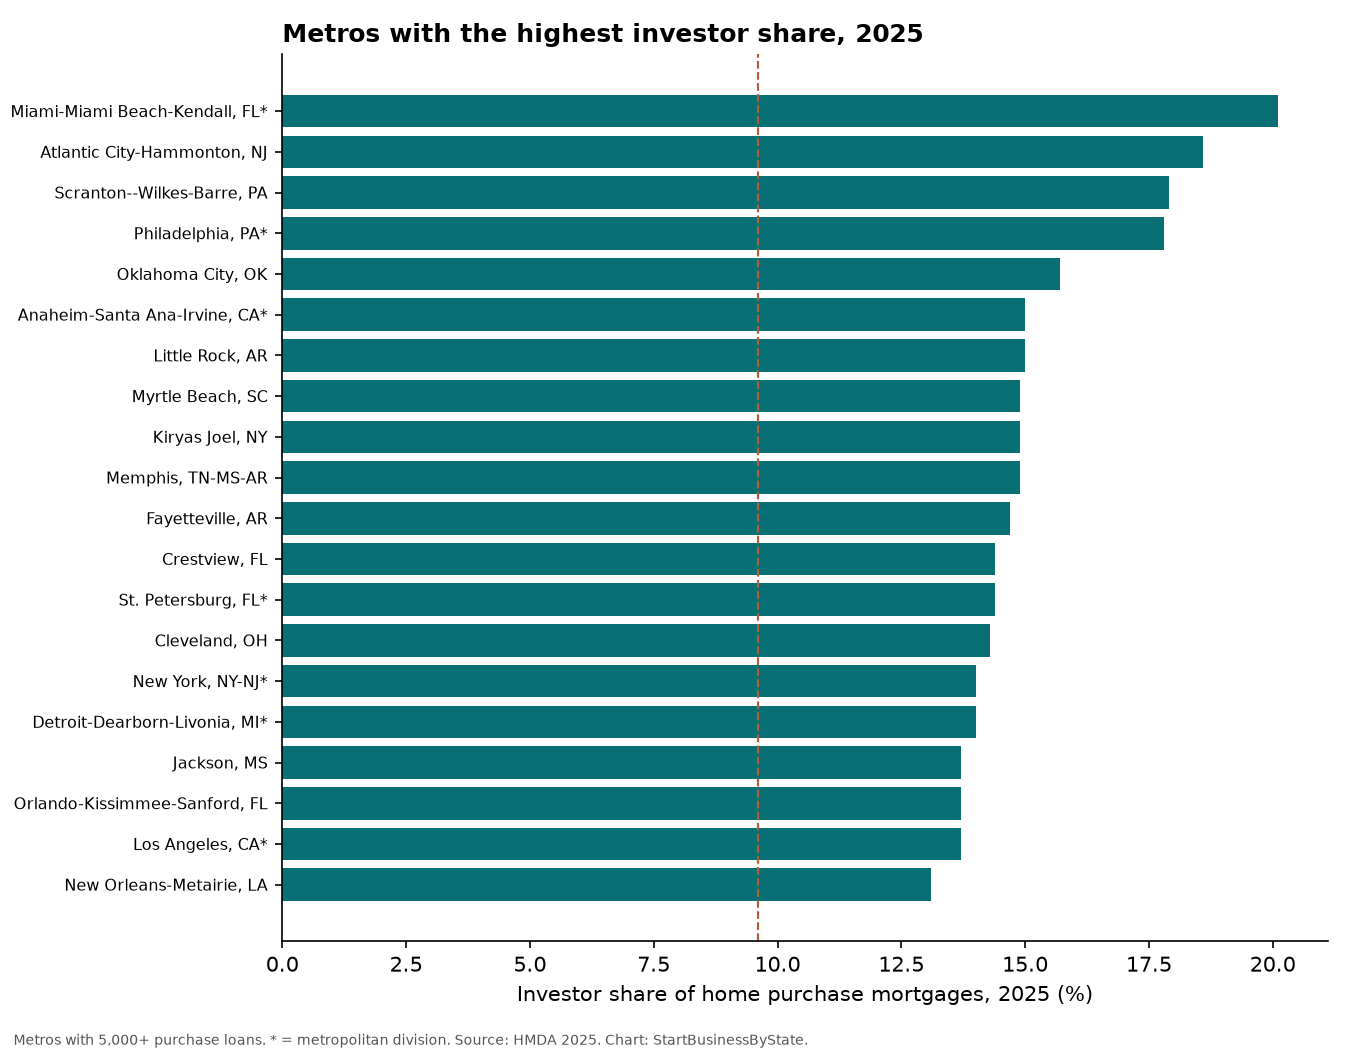
Among 145 metro areas with at least 5,000 purchase loans, the investor share rose in 99 from 2024 to 2025.
| Metro area | Purchase loans, 2025 | Investor loans | Investor share | Change vs 2024 | Investor loans vs 2024 |
|---|---|---|---|---|---|
| Miami-Miami Beach-Kendall, FL (division) | 17,243 | 3,465 | 20.1% | +2.6 pts | +6.5% |
| Atlantic City-Hammonton, NJ | 5,113 | 949 | 18.6% | +2.7 pts | +24.1% |
| Scranton–Wilkes-Barre, PA | 5,061 | 906 | 17.9% | +1.4 pts | +8.1% |
| Philadelphia, PA (division) | 17,623 | 3,132 | 17.8% | +2.6 pts | +17.3% |
| Oklahoma City, OK | 19,355 | 3,043 | 15.7% | -1.2 pts | -5.5% |
| Little Rock-North Little Rock-Conway, AR | 10,149 | 1,523 | 15.0% | -0.6 pts | +5.0% |
| Anaheim-Santa Ana-Irvine, CA (division) | 15,748 | 2,355 | 15.0% | +2.2 pts | +13.9% |
| Memphis, TN-MS-AR | 12,607 | 1,876 | 14.9% | -2.9 pts | -20.3% |
| Kiryas Joel-Poughkeepsie-Newburgh, NY | 5,712 | 849 | 14.9% | +0.5 pts | +2.4% |
| Myrtle Beach-Conway-North Myrtle Beach, SC | 9,918 | 1,477 | 14.9% | +0.6 pts | +4.0% |
| Fayetteville-Springdale-Rogers, AR | 9,682 | 1,423 | 14.7% | +0.9 pts | +8.6% |
| St. Petersburg-Clearwater-Largo, FL (division) | 10,105 | 1,459 | 14.4% | +0.7 pts | +5.9% |
| Crestview-Fort Walton Beach-Destin, FL | 5,987 | 860 | 14.4% | +1.5 pts | +10.4% |
| Cleveland, OH | 23,707 | 3,399 | 14.3% | +1.2 pts | +14.6% |
| Detroit-Dearborn-Livonia, MI (division) | 15,668 | 2,192 | 14.0% | +1.4 pts | +9.9% |
| New York-Jersey City-White Plains, NY-NJ (division) | 50,498 | 7,072 | 14.0% | +2.1 pts | +22.1% |
| Los Angeles-Long Beach-Glendale, CA (division) | 40,043 | 5,488 | 13.7% | +1.6 pts | +10.0% |
| Orlando-Kissimmee-Sanford, FL | 33,998 | 4,664 | 13.7% | +0.0 pts | -4.6% |
| Jackson, MS | 6,109 | 839 | 13.7% | +0.0 pts | +4.9% |
| New Orleans-Metairie, LA | 6,543 | 857 | 13.1% | +0.4 pts | +0.9% |
| Daphne-Fairhope-Foley, AL | 5,245 | 677 | 12.9% | +1.0 pts | +17.7% |
| Fort Lauderdale-Pompano Beach-Sunrise, FL (division) | 16,363 | 2,116 | 12.9% | +1.2 pts | +2.1% |
| Urban Honolulu, HI | 6,623 | 848 | 12.8% | +1.6 pts | +28.9% |
| Allentown-Bethlehem-Easton, PA-NJ | 8,645 | 1,106 | 12.8% | +0.8 pts | +6.1% |
| Lexington-Fayette, KY | 5,641 | 708 | 12.6% | +0.5 pts | +6.6% |
| Stockton-Lodi, CA | 6,983 | 872 | 12.5% | +0.4 pts | -0.7% |
| Wichita, KS | 8,340 | 1,039 | 12.5% | +0.2 pts | +7.2% |
| Toledo, OH | 6,067 | 753 | 12.4% | +1.9 pts | +26.6% |
| Durham-Chapel Hill, NC | 7,024 | 867 | 12.3% | -0.3 pts | +4.0% |
| St. Louis, MO-IL | 33,987 | 4,128 | 12.1% | -0.5 pts | -2.8% |
| Lakewood-New Brunswick, NJ (division) | 22,866 | 2,777 | 12.1% | +1.3 pts | +15.9% |
| Camden, NJ (division) | 13,478 | 1,624 | 12.0% | +1.0 pts | +11.4% |
| Tulsa, OK | 12,388 | 1,490 | 12.0% | +0.3 pts | +6.4% |
| Naples-Marco Island, FL | 5,224 | 617 | 11.8% | -1.4 pts | -15.1% |
| Fresno, CA | 8,880 | 1,027 | 11.6% | +0.3 pts | -0.4% |
| Las Vegas-Henderson-North Las Vegas, NV | 26,867 | 3,111 | 11.6% | -0.6 pts | -13.7% |
| Springfield, MO | 6,761 | 771 | 11.4% | -0.2 pts | +4.0% |
| Newark, NJ (division) | 16,273 | 1,835 | 11.3% | +0.8 pts | +6.6% |
| Wilmington, NC | 9,603 | 1,087 | 11.3% | +0.9 pts | +17.5% |
| Akron, OH | 7,744 | 872 | 11.3% | +1.3 pts | +16.0% |
| West Palm Beach-Boca Raton-Delray Beach, FL (division) | 15,059 | 1,693 | 11.2% | +0.2 pts | +5.5% |
| Bakersfield-Delano, CA | 7,907 | 868 | 11.0% | +0.5 pts | +6.6% |
| North Port-Bradenton-Sarasota, FL | 15,718 | 1,726 | 11.0% | +0.7 pts | +7.7% |
| Chattanooga, TN-GA | 7,242 | 793 | 11.0% | -0.1 pts | -2.5% |
| Lakeland-Winter Haven, FL | 13,208 | 1,444 | 10.9% | +0.9 pts | -1.6% |
| San Diego-Chula Vista-Carlsbad, CA | 20,749 | 2,231 | 10.8% | +0.5 pts | +1.8% |
| McAllen-Edinburg-Mission, TX | 5,220 | 562 | 10.8% | +0.9 pts | +10.6% |
| Harrisburg-Carlisle, PA | 6,126 | 655 | 10.7% | -0.8 pts | -6.6% |
| Cape Coral-Fort Myers, FL | 14,675 | 1,552 | 10.6% | -0.6 pts | -5.3% |
| Boston, MA (division) | 16,235 | 1,716 | 10.6% | +1.0 pts | +15.5% |
| Nassau County-Suffolk County, NY (division) | 21,649 | 2,295 | 10.6% | +1.5 pts | +20.1% |
| Sacramento-Roseville-Folsom, CA | 23,116 | 2,432 | 10.5% | +0.1 pts | +0.9% |
| Raleigh-Cary, NC | 22,428 | 2,355 | 10.5% | -1.7 pts | -15.0% |
| Bridgeport-Stamford-Danbury, CT | 7,691 | 795 | 10.3% | +0.3 pts | +5.9% |
| Riverside-San Bernardino-Ontario, CA | 39,342 | 3,994 | 10.2% | +1.3 pts | +7.3% |
| Kansas City, MO-KS | 28,974 | 2,942 | 10.2% | +0.5 pts | +9.5% |
| Savannah, GA | 6,097 | 616 | 10.1% | -5.4 pts | -34.2% |
| Cambridge-Newton-Framingham, MA (division) | 19,375 | 1,958 | 10.1% | +0.6 pts | +9.7% |
| Albany-Schenectady-Troy, NY | 8,268 | 836 | 10.1% | -0.4 pts | -0.1% |
| Milwaukee-Waukesha, WI | 15,523 | 1,557 | 10.0% | +0.9 pts | +15.3% |
| Lake County-Porter County-Jasper County, IN (division) | 8,629 | 858 | 9.9% | +1.2 pts | +17.9% |
| Baltimore-Columbia-Towson, MD | 29,053 | 2,848 | 9.8% | +0.3 pts | +2.9% |
| Ocala, FL | 7,977 | 774 | 9.7% | +0.1 pts | +0.1% |
| Omaha, NE-IA | 12,859 | 1,250 | 9.7% | -0.1 pts | +4.9% |
| San Francisco-San Mateo-Redwood City, CA (division) | 8,018 | 770 | 9.6% | +1.1 pts | +19.9% |
| San Jose-Sunnyvale-Santa Clara, CA | 10,926 | 1,040 | 9.5% | +1.3 pts | +7.0% |
| Chicago-Naperville-Schaumburg, IL (division) | 63,110 | 5,978 | 9.5% | +1.8 pts | +17.6% |
| Wilmington, DE-MD-NJ (division) | 7,593 | 712 | 9.4% | +0.4 pts | +7.9% |
| Syracuse, NY | 5,588 | 527 | 9.4% | +0.8 pts | +17.4% |
| Fayetteville, NC | 5,315 | 502 | 9.4% | +0.7 pts | +2.0% |
| Dallas-Plano-Irving, TX (division) | 66,888 | 6,213 | 9.3% | -0.1 pts | -6.9% |
| Atlanta-Sandy Springs-Roswell, GA (division) | 54,870 | 5,014 | 9.1% | -0.1 pts | -4.0% |
| Worcester, MA | 8,174 | 740 | 9.1% | +0.7 pts | +10.6% |
| Gulfport-Biloxi, MS | 5,133 | 469 | 9.1% | -0.5 pts | -3.1% |
| Greensboro-High Point, NC | 8,096 | 735 | 9.1% | +0.8 pts | +8.9% |
| Richmond, VA | 16,807 | 1,532 | 9.1% | +1.2 pts | +19.3% |
| Oxnard-Thousand Oaks-Ventura, CA | 5,047 | 456 | 9.0% | +2.3 pts | +39.4% |
| Deltona-Daytona Beach-Ormond Beach, FL | 10,546 | 950 | 9.0% | +0.8 pts | +4.9% |
| Knoxville, TN | 12,778 | 1,149 | 9.0% | +0.8 pts | +16.6% |
| Houston-Pasadena-The Woodlands, TX | 84,883 | 7,639 | 9.0% | +0.3 pts | +3.7% |
| Huntsville, AL | 8,842 | 790 | 8.9% | +0.6 pts | +8.4% |
| Birmingham, AL | 13,687 | 1,188 | 8.7% | -1.5 pts | -14.8% |
| Jacksonville, FL | 24,426 | 2,136 | 8.7% | +0.1 pts | -0.6% |
| Dayton-Kettering-Beavercreek, OH | 10,041 | 872 | 8.7% | -1.1 pts | -9.1% |
| Hartford-West Hartford-East Hartford, CT | 10,405 | 896 | 8.6% | +1.0 pts | +16.4% |
| Rochester, NY | 9,288 | 800 | 8.6% | -0.8 pts | -5.3% |
| Columbus, OH | 25,508 | 2,201 | 8.6% | +0.0 pts | +0.8% |
| Nashville-Davidson–Murfreesboro–Franklin, TN | 29,239 | 2,506 | 8.6% | -0.6 pts | -7.1% |
| Clarksville, TN-KY | 5,404 | 459 | 8.5% | +1.6 pts | +27.5% |
| Baton Rouge, LA | 8,682 | 742 | 8.5% | +0.2 pts | +3.6% |
| Buffalo-Cheektowaga, NY | 9,827 | 839 | 8.5% | +1.0 pts | +17.3% |
| Pittsburgh, PA | 22,982 | 1,958 | 8.5% | +0.4 pts | +10.8% |
| Port St. Lucie, FL | 8,247 | 690 | 8.4% | +0.9 pts | +5.3% |
| Oakland-Fremont-Berkeley, CA (division) | 17,749 | 1,469 | 8.3% | +0.7 pts | +2.6% |
| Providence-Warwick, RI-MA | 14,046 | 1,152 | 8.2% | +0.4 pts | +9.3% |
| Lake County, IL (division) | 6,913 | 562 | 8.1% | -0.5 pts | -6.0% |
| Boise City, ID | 13,310 | 1,065 | 8.0% | +0.9 pts | +26.0% |
| Charlotte-Concord-Gastonia, NC-SC | 39,125 | 3,115 | 8.0% | -1.1 pts | -11.4% |
| Virginia Beach-Chesapeake-Norfolk, VA-NC | 23,359 | 1,873 | 8.0% | +0.5 pts | +9.1% |
| Austin-Round Rock-San Marcos, TX | 31,962 | 2,554 | 8.0% | -1.9 pts | -25.4% |
| Marietta, GA (division) | 17,249 | 1,349 | 7.8% | -0.7 pts | -11.9% |
| Indianapolis-Carmel-Greenwood, IN | 30,716 | 2,385 | 7.8% | +0.2 pts | +4.5% |
| Louisville/Jefferson County, KY-IN | 17,959 | 1,403 | 7.8% | -0.3 pts | +2.2% |
| Montgomery County-Bucks County-Chester County, PA (division) | 18,937 | 1,486 | 7.8% | +0.3 pts | +8.5% |
| Seattle-Bellevue-Kent, WA (division) | 20,424 | 1,597 | 7.8% | +0.2 pts | +0.7% |
| Pensacola-Ferry Pass-Brent, FL | 8,013 | 615 | 7.7% | +0.3 pts | +1.7% |
| Cincinnati, OH-KY-IN | 27,318 | 2,116 | 7.7% | -0.2 pts | +1.8% |
| Fort Worth-Arlington-Grapevine, TX (division) | 29,772 | 2,282 | 7.7% | -0.4 pts | -9.2% |
| Augusta-Richmond County, GA-SC | 7,926 | 605 | 7.6% | +0.6 pts | +14.4% |
| Everett, WA (division) | 8,651 | 650 | 7.5% | -1.2 pts | -18.1% |
| Tampa, FL (division) | 31,911 | 2,362 | 7.4% | +0.0 pts | -4.4% |
| Des Moines-West Des Moines, IA | 10,871 | 808 | 7.4% | -0.5 pts | -0.6% |
| Washington, DC-MD (division) | 15,900 | 1,159 | 7.3% | +0.5 pts | +1.3% |
| Elgin, IL (division) | 8,779 | 643 | 7.3% | +1.4 pts | +22.0% |
| Winston-Salem, NC | 8,485 | 621 | 7.3% | +0.8 pts | +19.4% |
| Palm Bay-Melbourne-Titusville, FL | 9,823 | 705 | 7.2% | +0.4 pts | +5.4% |
| Phoenix-Mesa-Chandler, AZ | 63,774 | 4,503 | 7.1% | +0.8 pts | +12.9% |
| Reno, NV | 6,572 | 457 | 7.0% | +0.5 pts | +16.6% |
| York-Hanover, PA | 5,346 | 374 | 7.0% | -0.4 pts | -6.0% |
| Provo-Orem-Lehi, UT | 10,225 | 716 | 7.0% | +0.6 pts | +16.0% |
| San Antonio-New Braunfels, TX | 35,066 | 2,416 | 6.9% | -0.2 pts | -5.0% |
| Tacoma-Lakewood, WA (division) | 10,299 | 685 | 6.7% | +0.3 pts | +7.7% |
| Portland-South Portland, ME | 6,783 | 447 | 6.6% | -0.8 pts | -5.1% |
| Tucson, AZ | 12,136 | 779 | 6.4% | +0.4 pts | +8.5% |
| Frederick-Gaithersburg-Bethesda, MD (division) | 11,931 | 766 | 6.4% | +0.1 pts | -0.8% |
| Spartanburg, SC | 6,934 | 435 | 6.3% | +0.6 pts | +24.6% |
| Arlington-Alexandria-Reston, VA-WV (division) | 34,059 | 2,152 | 6.3% | +0.4 pts | +6.2% |
| Madison, WI | 7,410 | 458 | 6.2% | +0.0 pts | +4.3% |
| Minneapolis-St. Paul-Bloomington, MN-WI | 44,569 | 2,713 | 6.1% | -0.2 pts | +0.9% |
| Portland-Vancouver-Hillsboro, OR-WA | 25,136 | 1,541 | 6.1% | +1.0 pts | +23.3% |
| Denver-Aurora-Centennial, CO | 38,051 | 2,298 | 6.0% | +0.0 pts | -0.1% |
| Charleston-North Charleston, SC | 14,777 | 880 | 6.0% | +0.7 pts | +16.2% |
| Killeen-Temple, TX | 7,607 | 448 | 5.9% | -0.5 pts | -2.2% |
| Salt Lake City-Murray, UT | 12,547 | 734 | 5.9% | +0.9 pts | +16.0% |
| Warren-Troy-Farmington Hills, MI (division) | 29,060 | 1,676 | 5.8% | +0.3 pts | +7.4% |
| Greenville-Anderson-Greer, SC | 13,269 | 769 | 5.8% | -0.4 pts | +0.3% |
| Albuquerque, NM | 9,920 | 561 | 5.7% | +0.4 pts | +6.2% |
| Spokane-Spokane Valley, WA | 6,454 | 363 | 5.6% | +0.9 pts | +24.7% |
| Columbia, SC | 11,903 | 659 | 5.5% | -0.2 pts | -0.5% |
| El Paso, TX | 8,149 | 438 | 5.4% | +0.7 pts | +16.8% |
| Colorado Springs, CO | 11,488 | 584 | 5.1% | +0.1 pts | +2.8% |
| Fort Wayne, IN | 5,871 | 299 | 5.1% | +0.0 pts | -0.3% |
| Ogden, UT | 7,456 | 332 | 4.5% | +0.6 pts | +20.3% |
| Greeley, CO | 5,730 | 242 | 4.2% | +0.2 pts | +7.1% |
| Grand Rapids-Wyoming-Kentwood, MI | 12,629 | 452 | 3.6% | -0.2 pts | -6.8% |
Investor home purchase loans by state, 2025
| State | Purchase loans, 2025 | Investor loans | Investor share 2025 | Investor share 2024 | Change | Investor loans vs 2024 | Avg investor loan | Second-home share | Business-purpose share |
|---|---|---|---|---|---|---|---|---|---|
| U.S. total | 3,412,530 | 327,200 | 9.6% | 9.3% | +0.3 pts | +4.5% | $338,014 | 2.7% | 69.4% |
| Alabama | 60,131 | 5,876 | 9.8% | 9.8% | +0.0 pts | +1.7% | $212,561 | 2.9% | 66.9% |
| Alaska | 7,401 | 387 | 5.2% | 4.8% | +0.4 pts | +13.5% | $327,765 | 2.3% | 60.2% |
| Arizona | 91,359 | 6,595 | 7.2% | 6.4% | +0.8 pts | +14.6% | $399,067 | 4.6% | 66.0% |
| Arkansas | 36,539 | 5,550 | 15.2% | 15.4% | -0.2 pts | +5.1% | $201,341 | 2.1% | 64.0% |
| California | 246,503 | 27,764 | 11.3% | 10.3% | +1.0 pts | +6.7% | $679,213 | 2.2% | 72.7% |
| Colorado | 76,470 | 4,946 | 6.5% | 6.3% | +0.2 pts | +3.2% | $468,055 | 3.4% | 68.6% |
| Connecticut | 32,395 | 3,369 | 10.4% | 9.5% | +0.9 pts | +12.3% | $351,643 | 1.5% | 81.6% |
| Delaware | 13,699 | 1,083 | 7.9% | 7.5% | +0.4 pts | +9.1% | $282,969 | 9.7% | 71.9% |
| District of Columbia | 5,343 | 489 | 9.2% | 8.8% | +0.4 pts | +3.8% | $593,303 | 2.1% | 74.4% |
| Florida | 282,625 | 31,424 | 11.1% | 10.7% | +0.4 pts | +1.3% | $371,889 | 5.0% | 77.6% |
| Georgia | 123,181 | 12,110 | 9.8% | 10.2% | -0.4 pts | -5.0% | $262,393 | 1.8% | 65.3% |
| Hawaii | 9,734 | 1,636 | 16.8% | 15.8% | +1.0 pts | +17.8% | $650,782 | 4.9% | 77.4% |
| Idaho | 26,751 | 2,065 | 7.7% | 6.7% | +1.0 pts | +28.7% | $351,542 | 3.8% | 56.3% |
| Illinois | 119,389 | 11,730 | 9.8% | 8.7% | +1.1 pts | +11.5% | $223,039 | 0.9% | 66.7% |
| Indiana | 83,737 | 6,245 | 7.5% | 7.4% | +0.1 pts | +3.1% | $272,742 | 1.2% | 67.3% |
| Iowa | 37,429 | 3,657 | 9.8% | 9.8% | +0.0 pts | +5.8% | $163,756 | 1.6% | 50.5% |
| Kansas | 32,190 | 3,585 | 11.1% | 10.6% | +0.5 pts | +10.5% | $194,810 | 0.9% | 58.2% |
| Kentucky | 48,639 | 4,660 | 9.6% | 9.8% | -0.2 pts | +3.1% | $196,481 | 1.6% | 56.3% |
| Louisiana | 39,811 | 3,989 | 10.0% | 9.8% | +0.2 pts | +5.9% | $181,185 | 1.3% | 46.8% |
| Maine | 15,728 | 1,082 | 6.9% | 7.4% | -0.5 pts | -1.6% | $337,486 | 10.2% | 71.9% |
| Maryland | 61,664 | 5,420 | 8.8% | 8.6% | +0.2 pts | -1.4% | $279,437 | 2.2% | 71.0% |
| Massachusetts | 58,751 | 5,987 | 10.2% | 9.5% | +0.7 pts | +11.6% | $639,441 | 3.2% | 74.9% |
| Michigan | 103,954 | 6,980 | 6.7% | 6.5% | +0.2 pts | +5.2% | $391,722 | 3.4% | 75.0% |
| Minnesota | 64,861 | 4,141 | 6.4% | 6.6% | -0.2 pts | +0.9% | $260,436 | 2.8% | 50.3% |
| Mississippi | 27,895 | 3,008 | 10.8% | 10.5% | +0.3 pts | +6.4% | $174,854 | 2.6% | 71.9% |
| Missouri | 76,024 | 9,471 | 12.5% | 12.6% | -0.1 pts | +1.3% | $192,339 | 2.0% | 62.2% |
| Montana | 11,098 | 960 | 8.7% | 8.9% | -0.2 pts | +6.4% | $453,719 | 5.1% | 70.3% |
| Nebraska | 22,306 | 2,341 | 10.5% | 10.6% | -0.1 pts | +5.7% | $185,931 | 0.9% | 55.7% |
| Nevada | 36,890 | 3,753 | 10.2% | 10.6% | -0.4 pts | -9.5% | $362,964 | 2.7% | 75.3% |
| New Hampshire | 14,481 | 955 | 6.6% | 6.1% | +0.5 pts | +14.9% | $378,435 | 6.3% | 71.5% |
| New Jersey | 78,221 | 10,425 | 13.3% | 11.9% | +1.4 pts | +13.4% | $440,910 | 3.5% | 80.5% |
| New Mexico | 19,631 | 1,189 | 6.1% | 5.6% | +0.5 pts | +7.2% | $262,056 | 2.8% | 61.6% |
| New York | 116,589 | 13,202 | 11.3% | 10.4% | +0.9 pts | +12.8% | $505,108 | 3.1% | 85.2% |
| North Carolina | 143,196 | 13,843 | 9.7% | 9.9% | -0.2 pts | +0.4% | $283,695 | 3.8% | 67.0% |
| North Dakota | 7,996 | 663 | 8.3% | 7.6% | +0.7 pts | +9.6% | $207,474 | 1.5% | 60.5% |
| Ohio | 127,933 | 12,861 | 10.1% | 9.6% | +0.5 pts | +9.3% | $163,583 | 0.9% | 73.4% |
| Oklahoma | 45,817 | 6,647 | 14.5% | 14.7% | -0.2 pts | +0.8% | $193,616 | 1.6% | 61.8% |
| Oregon | 41,900 | 2,761 | 6.6% | 5.5% | +1.1 pts | +24.0% | $369,252 | 2.4% | 69.8% |
| Pennsylvania | 118,128 | 13,394 | 11.3% | 10.8% | +0.5 pts | +8.2% | $214,600 | 1.7% | 74.2% |
| Rhode Island | 9,460 | 777 | 8.2% | 8.4% | -0.2 pts | +1.2% | $463,958 | 3.5% | 78.9% |
| South Carolina | 82,107 | 5,877 | 7.2% | 7.1% | +0.1 pts | +6.6% | $290,414 | 4.6% | 66.2% |
| South Dakota | 9,476 | 742 | 7.8% | 8.1% | -0.3 pts | +0.1% | $233,369 | 2.4% | 67.4% |
| Tennessee | 87,595 | 9,115 | 10.4% | 10.8% | -0.4 pts | -0.9% | $291,827 | 2.4% | 66.1% |
| Texas | 345,278 | 30,442 | 8.8% | 9.1% | -0.3 pts | -4.3% | $268,110 | 1.4% | 64.4% |
| Utah | 41,088 | 2,990 | 7.3% | 6.2% | +1.1 pts | +23.3% | $436,033 | 3.3% | 70.8% |
| Vermont | 6,060 | 492 | 8.1% | 7.2% | +0.9 pts | +23.0% | $341,199 | 10.4% | 69.9% |
| Virginia | 99,177 | 7,998 | 8.1% | 7.6% | +0.5 pts | +7.3% | $306,228 | 1.9% | 67.7% |
| Washington | 79,937 | 5,362 | 6.7% | 6.7% | +0.0 pts | +1.1% | $477,615 | 2.0% | 75.6% |
| West Virginia | 16,586 | 1,378 | 8.3% | 7.7% | +0.6 pts | +10.9% | $185,123 | 2.7% | 52.9% |
| Wisconsin | 62,723 | 5,266 | 8.4% | 8.0% | +0.4 pts | +9.3% | $234,419 | 4.3% | 64.3% |
| Wyoming | 6,654 | 518 | 7.8% | 7.6% | +0.2 pts | +12.4% | $361,641 | 2.4% | 60.0% |
State-by-state takeaways
Alabama: 9.8%
In Alabama, 9.8% of mortgage-financed home purchases in 2025 were for investment properties (5,876 of 60,131 loans), rank 19 of 51. That’s unchanged from 2024. The number of investor purchase loans rose 1.7%. The average investor loan was $212,561, vs $280,010 for owner-occupants. Second homes were 2.9% of purchases.
Alaska: 5.2%
In Alaska, 5.2% of mortgage-financed home purchases in 2025 were for investment properties (387 of 7,401 loans), rank 51 of 51. That’s up 0.4 points from 2024. The number of investor purchase loans rose 13.5%. The average investor loan was $327,765, vs $395,561 for owner-occupants. Second homes were 2.3% of purchases.
Arizona: 7.2%
In Arizona, 7.2% of mortgage-financed home purchases in 2025 were for investment properties (6,595 of 91,359 loans), rank 41 of 51. That’s up 0.8 points from 2024. The number of investor purchase loans rose 14.6%. The average investor loan was $399,067, vs $424,037 for owner-occupants. Second homes were 4.6% of purchases.
Arkansas: 15.2%
In Arkansas, 15.2% of mortgage-financed home purchases in 2025 were for investment properties (5,550 of 36,539 loans), rank 2 of 51. That’s down 0.2 points from 2024. The number of investor purchase loans rose 5.1%. The average investor loan was $201,341, vs $266,557 for owner-occupants. Second homes were 2.1% of purchases.
California: 11.3%
In California, 11.3% of mortgage-financed home purchases in 2025 were for investment properties (27,764 of 246,503 loans), rank 6 of 51. That’s up 1.0 points from 2024. The number of investor purchase loans rose 6.7%. The average investor loan was $679,213, vs $698,264 for owner-occupants. Second homes were 2.2% of purchases.
Colorado: 6.5%
In Colorado, 6.5% of mortgage-financed home purchases in 2025 were for investment properties (4,946 of 76,470 loans), rank 48 of 51. That’s up 0.2 points from 2024. The number of investor purchase loans rose 3.2%. The average investor loan was $468,055, vs $498,517 for owner-occupants. Second homes were 3.4% of purchases.
Connecticut: 10.4%
In Connecticut, 10.4% of mortgage-financed home purchases in 2025 were for investment properties (3,369 of 32,395 loans), rank 13 of 51. That’s up 0.9 points from 2024. The number of investor purchase loans rose 12.3%. The average investor loan was $351,643, vs $448,984 for owner-occupants. Second homes were 1.5% of purchases.
Delaware: 7.9%
In Delaware, 7.9% of mortgage-financed home purchases in 2025 were for investment properties (1,083 of 13,699 loans), rank 35 of 51. That’s up 0.4 points from 2024. The number of investor purchase loans rose 9.1%. The average investor loan was $282,969, vs $364,175 for owner-occupants. Second homes were 9.7% of purchases.
District of Columbia: 9.2%
In District of Columbia, 9.2% of mortgage-financed home purchases in 2025 were for investment properties (489 of 5,343 loans), rank 25 of 51. That’s up 0.4 points from 2024. The number of investor purchase loans rose 3.8%. The average investor loan was $593,303, vs $677,571 for owner-occupants. Second homes were 2.1% of purchases.
Florida: 11.1%
In Florida, 11.1% of mortgage-financed home purchases in 2025 were for investment properties (31,424 of 282,625 loans), rank 9 of 51. That’s up 0.4 points from 2024. The number of investor purchase loans rose 1.3%. The average investor loan was $371,889, vs $400,624 for owner-occupants. Second homes were 5.0% of purchases.
Georgia: 9.8%
In Georgia, 9.8% of mortgage-financed home purchases in 2025 were for investment properties (12,110 of 123,181 loans), rank 20 of 51. That’s down 0.4 points from 2024. The number of investor purchase loans fell 5.0%. The average investor loan was $262,393, vs $370,192 for owner-occupants. Second homes were 1.8% of purchases.
Hawaii: 16.8%
In Hawaii, 16.8% of mortgage-financed home purchases in 2025 were for investment properties (1,636 of 9,734 loans), rank 1 of 51. That’s up 1.0 points from 2024. The number of investor purchase loans rose 17.8%. The average investor loan was $650,782, vs $669,464 for owner-occupants. Second homes were 4.9% of purchases.
Idaho: 7.7%
In Idaho, 7.7% of mortgage-financed home purchases in 2025 were for investment properties (2,065 of 26,751 loans), rank 38 of 51. That’s up 1.0 points from 2024. The number of investor purchase loans rose 28.7%. The average investor loan was $351,542, vs $413,679 for owner-occupants. Second homes were 3.8% of purchases.
Illinois: 9.8%
In Illinois, 9.8% of mortgage-financed home purchases in 2025 were for investment properties (11,730 of 119,389 loans), rank 21 of 51. That’s up 1.1 points from 2024. The number of investor purchase loans rose 11.5%. The average investor loan was $223,039, vs $319,699 for owner-occupants. Second homes were 0.9% of purchases.
Indiana: 7.5%
In Indiana, 7.5% of mortgage-financed home purchases in 2025 were for investment properties (6,245 of 83,737 loans), rank 39 of 51. That’s up 0.1 points from 2024. The number of investor purchase loans rose 3.1%. The average investor loan was $272,742, vs $273,269 for owner-occupants. Second homes were 1.2% of purchases.
Iowa: 9.8%
In Iowa, 9.8% of mortgage-financed home purchases in 2025 were for investment properties (3,657 of 37,429 loans), rank 22 of 51. That’s unchanged from 2024. The number of investor purchase loans rose 5.8%. The average investor loan was $163,756, vs $241,478 for owner-occupants. Second homes were 1.6% of purchases.
Kansas: 11.1%
In Kansas, 11.1% of mortgage-financed home purchases in 2025 were for investment properties (3,585 of 32,190 loans), rank 10 of 51. That’s up 0.5 points from 2024. The number of investor purchase loans rose 10.5%. The average investor loan was $194,810, vs $285,099 for owner-occupants. Second homes were 0.9% of purchases.
Kentucky: 9.6%
In Kentucky, 9.6% of mortgage-financed home purchases in 2025 were for investment properties (4,660 of 48,639 loans), rank 24 of 51. That’s down 0.2 points from 2024. The number of investor purchase loans rose 3.1%. The average investor loan was $196,481, vs $267,668 for owner-occupants. Second homes were 1.6% of purchases.
Louisiana: 10.0%
In Louisiana, 10.0% of mortgage-financed home purchases in 2025 were for investment properties (3,989 of 39,811 loans), rank 18 of 51. That’s up 0.2 points from 2024. The number of investor purchase loans rose 5.9%. The average investor loan was $181,185, vs $258,388 for owner-occupants. Second homes were 1.3% of purchases.
Maine: 6.9%
In Maine, 6.9% of mortgage-financed home purchases in 2025 were for investment properties (1,082 of 15,728 loans), rank 43 of 51. That’s down 0.5 points from 2024. The number of investor purchase loans fell 1.6%. The average investor loan was $337,486, vs $353,148 for owner-occupants. Second homes were 10.2% of purchases.
Maryland: 8.8%
In Maryland, 8.8% of mortgage-financed home purchases in 2025 were for investment properties (5,420 of 61,664 loans), rank 26 of 51. That’s up 0.2 points from 2024. The number of investor purchase loans fell 1.4%. The average investor loan was $279,437, vs $447,686 for owner-occupants. Second homes were 2.2% of purchases.
Massachusetts: 10.2%
In Massachusetts, 10.2% of mortgage-financed home purchases in 2025 were for investment properties (5,987 of 58,751 loans), rank 15 of 51. That’s up 0.7 points from 2024. The number of investor purchase loans rose 11.6%. The average investor loan was $639,441, vs $561,375 for owner-occupants. Second homes were 3.2% of purchases.
Michigan: 6.7%
In Michigan, 6.7% of mortgage-financed home purchases in 2025 were for investment properties (6,980 of 103,954 loans), rank 44 of 51. That’s up 0.2 points from 2024. The number of investor purchase loans rose 5.2%. The average investor loan was $391,722, vs $278,424 for owner-occupants. Second homes were 3.4% of purchases.
Minnesota: 6.4%
In Minnesota, 6.4% of mortgage-financed home purchases in 2025 were for investment properties (4,141 of 64,861 loans), rank 49 of 51. That’s down 0.2 points from 2024. The number of investor purchase loans rose 0.9%. The average investor loan was $260,436, vs $336,698 for owner-occupants. Second homes were 2.8% of purchases.
Mississippi: 10.8%
In Mississippi, 10.8% of mortgage-financed home purchases in 2025 were for investment properties (3,008 of 27,895 loans), rank 11 of 51. That’s up 0.3 points from 2024. The number of investor purchase loans rose 6.4%. The average investor loan was $174,854, vs $242,107 for owner-occupants. Second homes were 2.6% of purchases.
Missouri: 12.5%
In Missouri, 12.5% of mortgage-financed home purchases in 2025 were for investment properties (9,471 of 76,024 loans), rank 5 of 51. That’s down 0.1 points from 2024. The number of investor purchase loans rose 1.3%. The average investor loan was $192,339, vs $279,887 for owner-occupants. Second homes were 2.0% of purchases.
Montana: 8.7%
In Montana, 8.7% of mortgage-financed home purchases in 2025 were for investment properties (960 of 11,098 loans), rank 28 of 51. That’s down 0.2 points from 2024. The number of investor purchase loans rose 6.4%. The average investor loan was $453,719, vs $404,265 for owner-occupants. Second homes were 5.1% of purchases.
Nebraska: 10.5%
In Nebraska, 10.5% of mortgage-financed home purchases in 2025 were for investment properties (2,341 of 22,306 loans), rank 12 of 51. That’s down 0.1 points from 2024. The number of investor purchase loans rose 5.7%. The average investor loan was $185,931, vs $286,297 for owner-occupants. Second homes were 0.9% of purchases.
Nevada: 10.2%
In Nevada, 10.2% of mortgage-financed home purchases in 2025 were for investment properties (3,753 of 36,890 loans), rank 16 of 51. That’s down 0.4 points from 2024. The number of investor purchase loans fell 9.5%. The average investor loan was $362,964, vs $447,984 for owner-occupants. Second homes were 2.7% of purchases.
New Hampshire: 6.6%
In New Hampshire, 6.6% of mortgage-financed home purchases in 2025 were for investment properties (955 of 14,481 loans), rank 46 of 51. That’s up 0.5 points from 2024. The number of investor purchase loans rose 14.9%. The average investor loan was $378,435, vs $429,583 for owner-occupants. Second homes were 6.3% of purchases.
New Jersey: 13.3%
In New Jersey, 13.3% of mortgage-financed home purchases in 2025 were for investment properties (10,425 of 78,221 loans), rank 4 of 51. That’s up 1.4 points from 2024. The number of investor purchase loans rose 13.4%. The average investor loan was $440,910, vs $510,527 for owner-occupants. Second homes were 3.5% of purchases.
New Mexico: 6.1%
In New Mexico, 6.1% of mortgage-financed home purchases in 2025 were for investment properties (1,189 of 19,631 loans), rank 50 of 51. That’s up 0.5 points from 2024. The number of investor purchase loans rose 7.2%. The average investor loan was $262,056, vs $316,101 for owner-occupants. Second homes were 2.8% of purchases.
New York: 11.3%
In New York, 11.3% of mortgage-financed home purchases in 2025 were for investment properties (13,202 of 116,589 loans), rank 7 of 51. That’s up 0.9 points from 2024. The number of investor purchase loans rose 12.8%. The average investor loan was $505,108, vs $481,333 for owner-occupants. Second homes were 3.1% of purchases.
North Carolina: 9.7%
In North Carolina, 9.7% of mortgage-financed home purchases in 2025 were for investment properties (13,843 of 143,196 loans), rank 23 of 51. That’s down 0.2 points from 2024. The number of investor purchase loans rose 0.4%. The average investor loan was $283,695, vs $362,949 for owner-occupants. Second homes were 3.8% of purchases.
North Dakota: 8.3%
In North Dakota, 8.3% of mortgage-financed home purchases in 2025 were for investment properties (663 of 7,996 loans), rank 30 of 51. That’s up 0.7 points from 2024. The number of investor purchase loans rose 9.6%. The average investor loan was $207,474, vs $291,993 for owner-occupants. Second homes were 1.5% of purchases.
Ohio: 10.1%
In Ohio, 10.1% of mortgage-financed home purchases in 2025 were for investment properties (12,861 of 127,933 loans), rank 17 of 51. That’s up 0.5 points from 2024. The number of investor purchase loans rose 9.3%. The average investor loan was $163,583, vs $278,602 for owner-occupants. Second homes were 0.9% of purchases.
Oklahoma: 14.5%
In Oklahoma, 14.5% of mortgage-financed home purchases in 2025 were for investment properties (6,647 of 45,817 loans), rank 3 of 51. That’s down 0.2 points from 2024. The number of investor purchase loans rose 0.8%. The average investor loan was $193,616, vs $262,453 for owner-occupants. Second homes were 1.6% of purchases.
Oregon: 6.6%
In Oregon, 6.6% of mortgage-financed home purchases in 2025 were for investment properties (2,761 of 41,900 loans), rank 47 of 51. That’s up 1.1 points from 2024. The number of investor purchase loans rose 24.0%. The average investor loan was $369,252, vs $434,509 for owner-occupants. Second homes were 2.4% of purchases.
Pennsylvania: 11.3%
In Pennsylvania, 11.3% of mortgage-financed home purchases in 2025 were for investment properties (13,394 of 118,128 loans), rank 8 of 51. That’s up 0.5 points from 2024. The number of investor purchase loans rose 8.2%. The average investor loan was $214,600, vs $313,214 for owner-occupants. Second homes were 1.7% of purchases.
Rhode Island: 8.2%
In Rhode Island, 8.2% of mortgage-financed home purchases in 2025 were for investment properties (777 of 9,460 loans), rank 32 of 51. That’s down 0.2 points from 2024. The number of investor purchase loans rose 1.2%. The average investor loan was $463,958, vs $448,786 for owner-occupants. Second homes were 3.5% of purchases.
South Carolina: 7.2%
In South Carolina, 7.2% of mortgage-financed home purchases in 2025 were for investment properties (5,877 of 82,107 loans), rank 42 of 51. That’s up 0.1 points from 2024. The number of investor purchase loans rose 6.6%. The average investor loan was $290,414, vs $338,041 for owner-occupants. Second homes were 4.6% of purchases.
South Dakota: 7.8%
In South Dakota, 7.8% of mortgage-financed home purchases in 2025 were for investment properties (742 of 9,476 loans), rank 36 of 51. That’s down 0.3 points from 2024. The number of investor purchase loans rose 0.1%. The average investor loan was $233,369, vs $312,854 for owner-occupants. Second homes were 2.4% of purchases.
Tennessee: 10.4%
In Tennessee, 10.4% of mortgage-financed home purchases in 2025 were for investment properties (9,115 of 87,595 loans), rank 14 of 51. That’s down 0.4 points from 2024. The number of investor purchase loans fell 0.9%. The average investor loan was $291,827, vs $372,494 for owner-occupants. Second homes were 2.4% of purchases.
Texas: 8.8%
In Texas, 8.8% of mortgage-financed home purchases in 2025 were for investment properties (30,442 of 345,278 loans), rank 27 of 51. That’s down 0.3 points from 2024. The number of investor purchase loans fell 4.3%. The average investor loan was $268,110, vs $359,666 for owner-occupants. Second homes were 1.4% of purchases.
Utah: 7.3%
In Utah, 7.3% of mortgage-financed home purchases in 2025 were for investment properties (2,990 of 41,088 loans), rank 40 of 51. That’s up 1.1 points from 2024. The number of investor purchase loans rose 23.3%. The average investor loan was $436,033, vs $485,230 for owner-occupants. Second homes were 3.3% of purchases.
Vermont: 8.1%
In Vermont, 8.1% of mortgage-financed home purchases in 2025 were for investment properties (492 of 6,060 loans), rank 33 of 51. That’s up 0.9 points from 2024. The number of investor purchase loans rose 23.0%. The average investor loan was $341,199, vs $348,977 for owner-occupants. Second homes were 10.4% of purchases.
Virginia: 8.1%
In Virginia, 8.1% of mortgage-financed home purchases in 2025 were for investment properties (7,998 of 99,177 loans), rank 34 of 51. That’s up 0.5 points from 2024. The number of investor purchase loans rose 7.3%. The average investor loan was $306,228, vs $442,506 for owner-occupants. Second homes were 1.9% of purchases.
Washington: 6.7%
In Washington, 6.7% of mortgage-financed home purchases in 2025 were for investment properties (5,362 of 79,937 loans), rank 45 of 51. That’s unchanged from 2024. The number of investor purchase loans rose 1.1%. The average investor loan was $477,615, vs $563,829 for owner-occupants. Second homes were 2.0% of purchases.
West Virginia: 8.3%
In West Virginia, 8.3% of mortgage-financed home purchases in 2025 were for investment properties (1,378 of 16,586 loans), rank 31 of 51. That’s up 0.6 points from 2024. The number of investor purchase loans rose 10.9%. The average investor loan was $185,123, vs $241,137 for owner-occupants. Second homes were 2.7% of purchases.
Wisconsin: 8.4%
In Wisconsin, 8.4% of mortgage-financed home purchases in 2025 were for investment properties (5,266 of 62,723 loans), rank 29 of 51. That’s up 0.4 points from 2024. The number of investor purchase loans rose 9.3%. The average investor loan was $234,419, vs $307,730 for owner-occupants. Second homes were 4.3% of purchases.
Wyoming: 7.8%
In Wyoming, 7.8% of mortgage-financed home purchases in 2025 were for investment properties (518 of 6,654 loans), rank 37 of 51. That’s up 0.2 points from 2024. The number of investor purchase loans rose 12.4%. The average investor loan was $361,641, vs $351,296 for owner-occupants. Second homes were 2.4% of purchases.
Who uses this data
- Property managers: a rising investor share means more new rental owners who may need management.
- Agents: investor buyers often want different numbers (rent, cap rate, repair costs). The state and metro tables show where that client base is biggest.
- Contractors and inspectors: investor purchases can come with make-ready or rehab work.
- Short-term rental hosts: check local rules before you buy. See business license requirements by state.
Related data
See minimum wage vs. rent by state, property taxes by state, home services demand by state and small business credit access by state.
Methods and limits
- Source: Home Mortgage Disclosure Act (HMDA) loan-level data for 2025 and 2024, downloaded state by state from the CFPB/FFIEC Data Browser API.
- Included: originated loans (action taken = 1) with loan purpose = home purchase, first lien, on 1-to-4-unit properties. Investor = occupancy type “investment property.” Second home = occupancy type “second residence.”
- Not included: cash purchases, loans from lenders too small to report under HMDA, and loans on 5+ unit apartment buildings. Investors who pay cash don’t show up here, so this undercounts total investor buying.
- Occupancy is what the borrower told the lender at application. Business-purpose is the lender’s flag for loans made mainly for a business or commercial purpose.
- Metro areas use the HMDA “derived MSA/MD” field, named from the Census Bureau’s July 2023 delineation file. Large metros are split into metropolitan divisions. Only metros or divisions with 5,000 or more purchase loans in 2025 are listed.
Sources
- CFPB/FFIEC HMDA Data Browser (API)
- HMDA data documentation
- U.S. Census Bureau, CBSA delineation file, July 2023
Cite this data
Reporters and bloggers may use these numbers and charts. Please credit StartBusinessByState and link to this page.
Source: StartBusinessByState, “Investor Home Purchases by State: Who Is Buying Homes to Rent (2025 Data),” https://startbusinessbystate.com/investor-home-purchases-by-state/ (updated October 7, 2026).
FAQ
What percentage of homes are bought by investors?
Investors took out 9.6% of first-lien home purchase mortgages on 1-to-4-unit homes in 2025, according to HMDA data. That doesn’t include cash purchases, so the share of all sales is likely different.
Which state has the most investor home buyers?
By share of purchase mortgages, Hawaii (16.8%), Arkansas (15.2%) and Oklahoma (14.5%) were highest in 2025.
Is investor home buying increasing?
Slightly. The investor share of purchase mortgages rose from 9.3% in 2024 to 9.6% in 2025, and the number of investor loans rose 4.5%.
Does this include large corporate investors?
Only if they bought with a home purchase mortgage reported under HMDA. Buyers who pay cash, whether individuals or companies, aren’t counted, so this data can’t measure purchases by large investors.
Where does this data come from?
From HMDA loan records that lenders report to federal regulators. We downloaded the 2024 and 2025 records from the CFPB/FFIEC Data Browser and counted them ourselves.
Last updated October 7, 2026 by StartBusinessByState.