U.S. service-business research · 2022 Census data · Published September 15, 2026
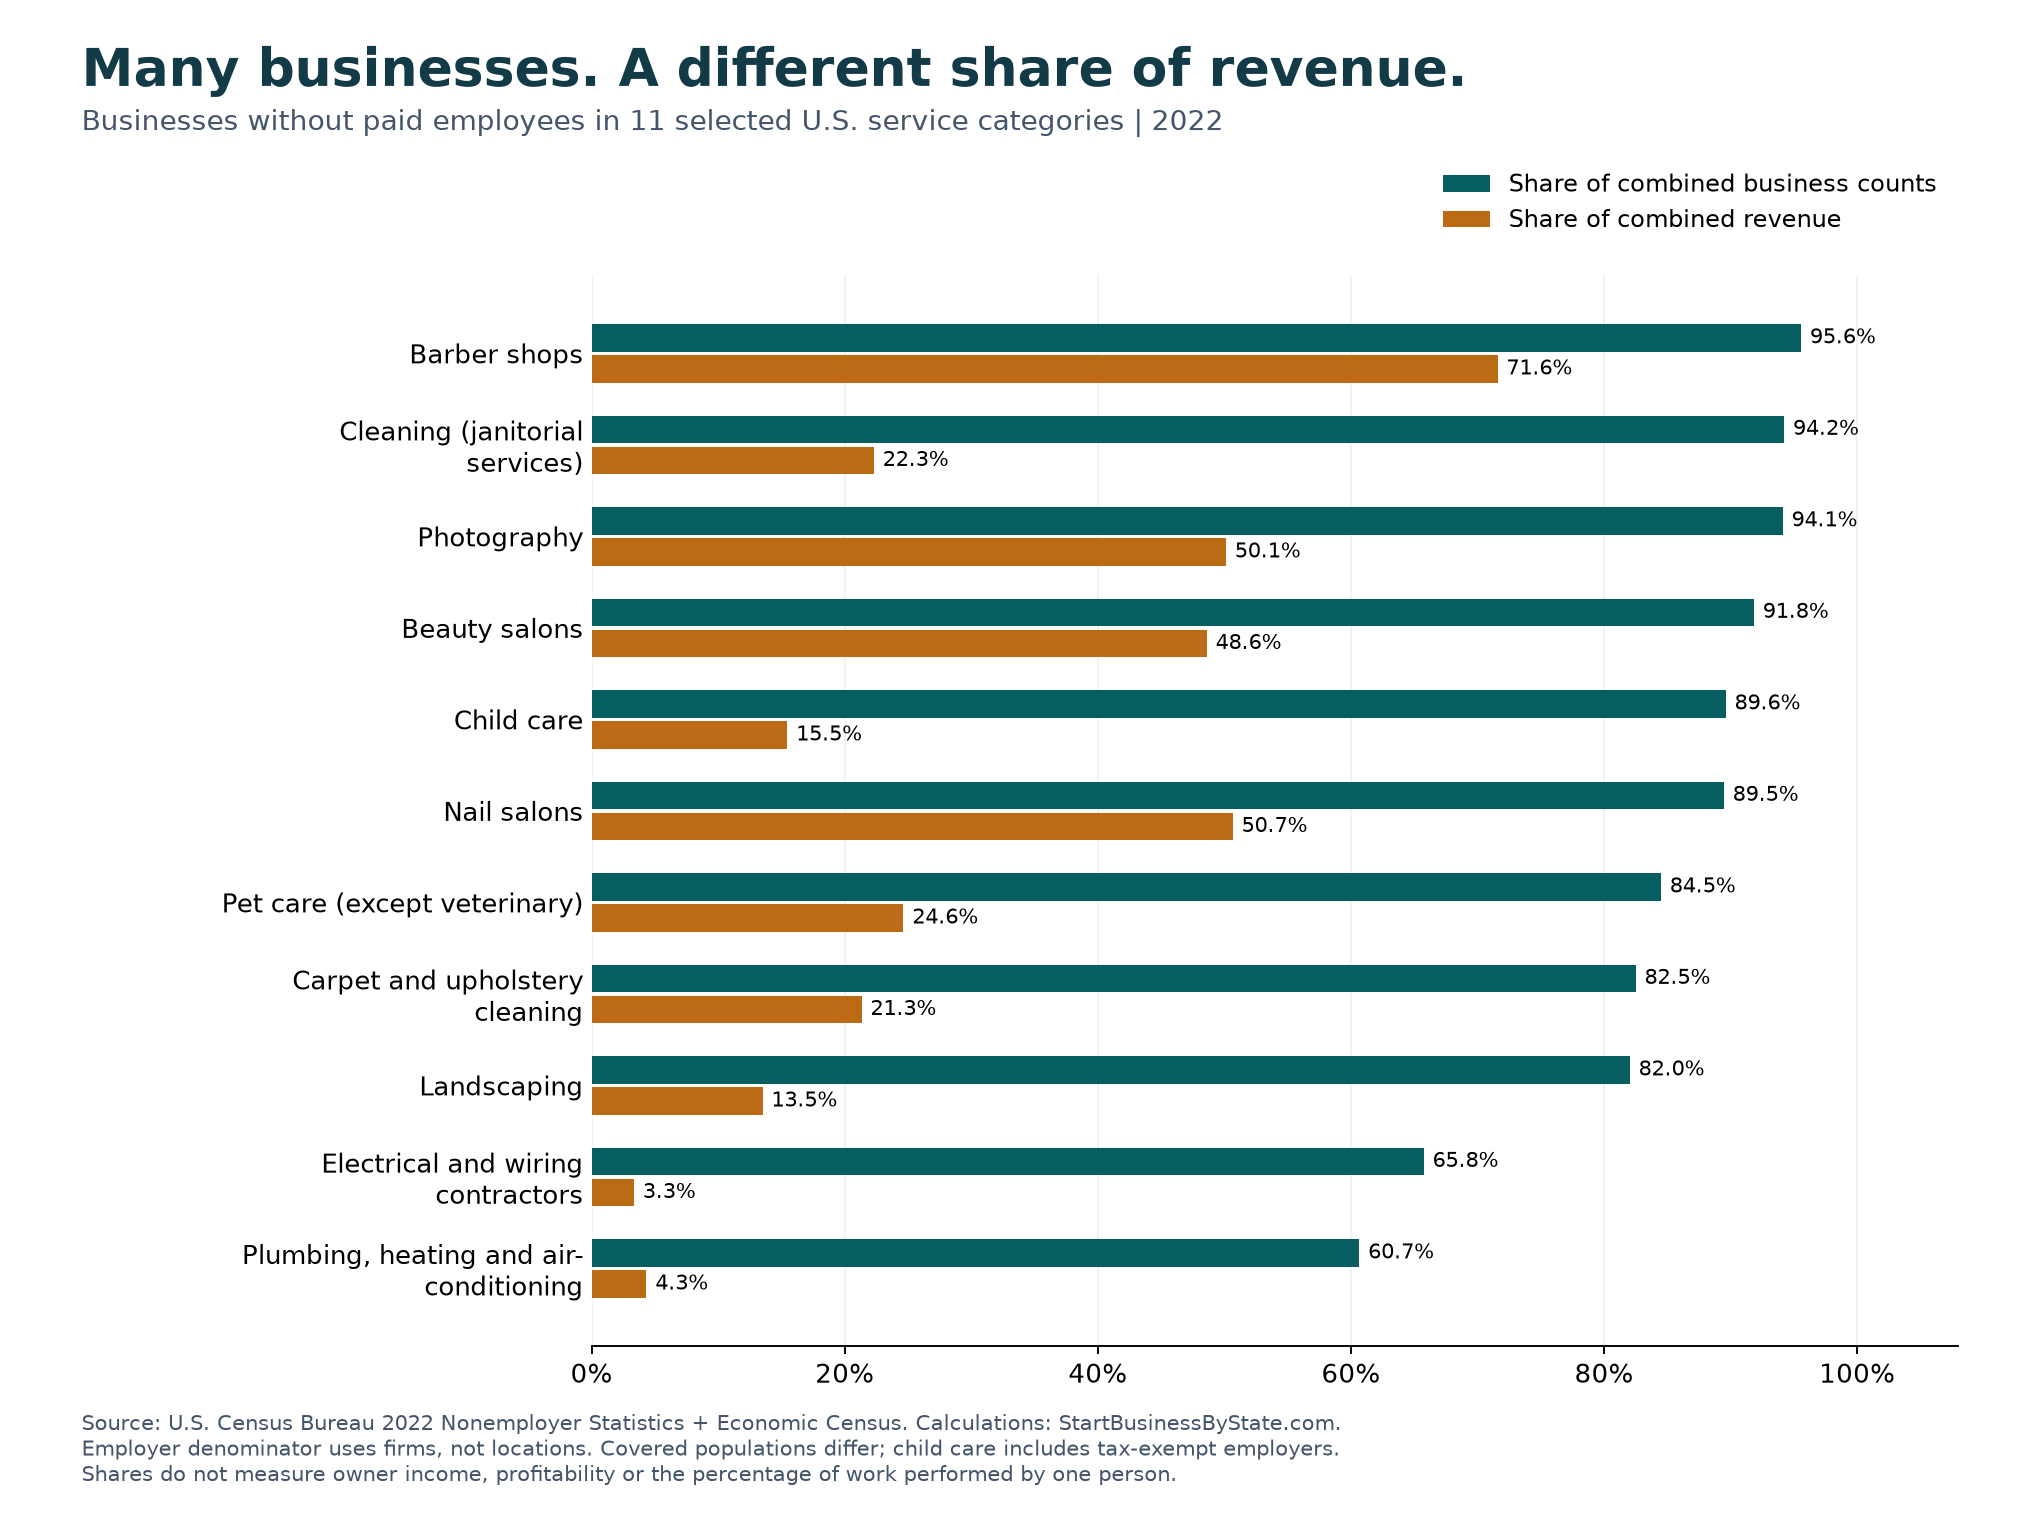
Barber shops, cleaning businesses and photography businesses have the highest shares without paid employees among the 11 service categories compared here: 95.6%, 94.2% and 94.1%, respectively, using combined 2022 Census business counts.
That does not mean most industry revenue goes to those businesses. Cleaning businesses without employees account for 94.2% of the combined count but 22.3% of combined revenue. The comparison uses employer firms, not the number of locations. These are our calculations from two Census datasets, not an official Census ranking.
A business with no paid employees is called a nonemployer. It can have more than one owner, use contractors, or operate part time. These figures describe payroll status; they do not establish how many businesses are run entirely by one person.
Which service businesses most often have no paid employees?
The table compares 11 selected consumer and trade-service categories relevant to small-business planning. It is not a ranking of every U.S. industry, a list of the easiest businesses to start, or a prediction that a new business will succeed without hiring.
Showing all 11 categories.
| Service category | Without paid employees | Employer firms | Without-employees share |
|---|---|---|---|
| Barber shops | 137,372 | 6,370 | 95.6% |
| Cleaning (janitorial services) | 1,045,769 | 63,999 | 94.2% |
| Photography | 231,865 | 14,494 | 94.1% |
| Beauty salons | 823,967 | 73,148 | 91.8% |
| Child care | 547,758 | 63,487 | 89.6% |
| Nail salons | 280,875 | 33,066 | 89.5% |
| Pet care (except veterinary) | 131,327 | 24,098 | 84.5% |
| Carpet and upholstery cleaning | 31,555 | 6,695 | 82.5% |
| Landscaping | 523,071 | 114,570 | 82.0% |
| Electrical and wiring contractors | 151,620 | 78,975 | 65.8% |
| Plumbing, heating and air-conditioning | 172,841 | 112,088 | 60.7% |
Share = nonemployer businesses ÷ (nonemployer businesses + employer firms). Employer counts use all tax statuses; where covered, this includes tax-exempt employers. NES covers taxable businesses meeting its receipts threshold. See the child-care sensitivity check and population limits below. Sources and exact industry codes appear in the methodology table.
Three findings worth separating
- Cleaning is the largest nonemployer population in this selection: 1,045,769 janitorial businesses in 2022. The largest count and the highest percentage are different findings.
- Barber shops have the highest share in this selection: 95.6%. Beauty salons and nail salons are separate categories, at 91.8% and 89.5%.
- Plumbing/HVAC and electrical contracting still have nonemployer majorities: 60.7% and 65.8%. Their shares are lower than those of the other categories in this comparison, not necessarily lower than every other service industry.
A large share of businesses can have a small share of revenue
Business counts give each firm one place in the denominator, whether it has a few customers or many locations. Revenue weights the scale of activity. Comparing the two helps avoid treating a high nonemployer count as evidence that most industry spending goes to very small operators.
| Service category | Nonemployer receipts | Employer revenue | Nonemployer revenue share | Mean receipts per nonemployer |
|---|---|---|---|---|
| Barber shops | $4.19B | $1.66B | 71.6% | $30,504 |
| Cleaning (janitorial services) | $20.85B | $72.61B | 22.3% | $19,936 |
| Photography | $6.81B | $6.77B | 50.1% | $29,359 |
| Beauty salons | $24.27B | $25.66B | 48.6% | $29,461 |
| Child care | $10.69B | $58.43B | 15.5% | $19,512 |
| Nail salons | $11.67B | $11.37B | 50.7% | $41,549 |
| Pet care (except veterinary) | $3.31B | $10.11B | 24.6% | $25,176 |
| Carpet and upholstery cleaning | $1.13B | $4.16B | 21.3% | $35,721 |
| Landscaping | $18.02B | $115.41B | 13.5% | $34,458 |
| Electrical and wiring contractors | $8.64B | $249.25B | 3.3% | $56,955 |
| Plumbing, heating and air-conditioning | $13.48B | $297.61B | 4.3% | $78,008 |
For landscaping, businesses without employees represent 82.0% of counts and 13.5% of revenue. Barber shops are different: their nonemployer revenue share is 71.6%. Neither pattern tells us an owner’s profit, hours worked, subcontractor spending, or whether customers are residential or commercial.
The mean receipts column divides total nonemployer receipts by the number of nonemployer businesses. It is an arithmetic average, not a median, salary or full-time earnings estimate. For cleaning-specific revenue brackets and more recent nonemployer figures, use our cleaning-business revenue study; its 2023 nonemployer figures deliberately differ from this same-year 2022 comparison.
What this means when choosing a service business
These figures can help frame an operating-model question: how common are businesses without payroll in the industry you are considering? They cannot answer whether your own service area has unmet demand or whether you can deliver the work safely and profitably without employees.
- Test the workload. Estimate the jobs you can complete, travel and administration time, cancellations and coverage when you are unavailable. A large nonemployer population does not establish a sustainable full-time workload.
- Build a local budget. Price equipment, insurance, premises and any outsourced work separately. Receipts before expenses are not funds available to pay the owner.
- Check the actual industry. The plumbing/HVAC category is broader than HVAC alone. Janitorial cleaning and carpet cleaning are separate. Do not apply a broad category’s percentage to a narrower business without acknowledging that difference.
- Check your state’s requirements. Having no employees does not by itself remove licensing, tax or insurance obligations. The relevant state guides are linked in the scope table below.
Our state and industry business comparison adds a geographic screening view. Its employer-density measures omit nonemployers, so read it alongside this study rather than interpreting employer locations as the whole market.
For state-level Schedule C average net profit and margins, see: sole prop net profit by state.
Download the data and check the methodology
Download all counts, revenue totals and calculations (CSV) · Download the comparison chart (PNG)
Sources and reference year. We retrieved U.S. national data from the 2022 Nonemployer Statistics API and 2022 Economic Census Summary Statistics API on September 15, 2026. Both use 2022 NAICS. The publication year is not the data year. We chose 2022 to pair verified employer firm counts and nonemployer counts for the same detailed categories and year; this is not a claim that no newer economic data exist.
Selection and matching. The 11 categories cover cleaning, personal services, child care and selected trades. Categories are editorially selected, not the top 11 from all industries. NES sometimes publishes an equivalent category at a shorter code: for example, 56172 matches employer 561720 for janitorial services. Photography uses the same broader 54192 category in both datasets. We do not add parent and child industry rows together.
| Category | NES / employer NAICS | Scope and guides | Source tables |
|---|---|---|---|
| Barber shops | 812111 / 812111 | Barber shops; not all hair-care businesses. State hair-salon guides. | NES · Employer |
| Cleaning (janitorial services) | 56172 / 561720 | Includes janitorial and window cleaning; excludes carpet and upholstery cleaning. State cleaning guides. | NES · Employer |
| Photography | 54192 / 54192 | Photographic services, including portrait and commercial photography. | NES · Employer |
| Beauty salons | 812112 / 812112 | Beauty salons only; barber shops and nail salons appear separately. State hair-salon guides. | NES · Employer |
| Child care | 6244 / 624410 | Child care services; employer total includes taxable and tax-exempt establishments. Not a count of licensed providers or seats. State daycare guides. | NES · Employer |
| Nail salons | 812113 / 812113 | Nail salons; separate from beauty salons. State hair-salon guides. | NES · Employer |
| Pet care (except veterinary) | 81291 / 812910 | Includes non-veterinary pet-care services, not veterinarians. | NES · Employer |
| Carpet and upholstery cleaning | 56174 / 561740 | Separate category from janitorial services. State cleaning guides. | NES · Employer |
| Landscaping | 56173 / 561730 | Landscaping services; not every agricultural or construction contractor. State landscaping guides. | NES · Employer |
| Electrical and wiring contractors | 23821 / 238210 | Electrical contractors and other wiring installation contractors. | NES · Employer |
| Plumbing, heating and air-conditioning | 23822 / 238220 | Combined plumbing/HVAC category; cannot isolate HVAC-only businesses. State HVAC guides. | NES · Employer |
Business versus location. The employer count is the Economic Census FIRM field, not ESTAB. A company can operate multiple establishments. Census treats firms and establishments interchangeably in NES because each distinct qualifying business income-tax return is counted as a nonemployer firm. An employer firm may appear in more than one industry; the 11 category totals should not be summed into a count of unique companies.
Calculations. The count share is N ÷ (N + E) × 100, where N is NES businesses and E is employer firms. Revenue share is nonemployer receipts ÷ (nonemployer receipts + employer revenue) × 100. Both source monetary totals are in thousands of dollars; we multiply by 1,000 before displaying dollars or calculating mean receipts. Calculations use unrounded values; percentages display one decimal place. The CSV preserves counts, dollar totals, codes, tax-status selection and disclosure flags.
Coverage and tax status. NES includes businesses without paid employees that are subject to federal income tax and meet the receipts threshold: generally $1,000, or $1 for construction. It does not count all informal work or all people working for themselves. Economic Census employer rows here use TAXSTAT=00, all establishments, including tax-exempt employers where covered. This combines two published populations; it is not an official Census estimate of the percentage of all possible businesses.
Child-care sensitivity check. The main table uses 63,487 employer firms across all tax statuses. Restricting the employer side to its published taxable-firm row gives 52,431 employer firms and a 91.3% nonemployer count share, rather than 89.6%. That narrower comparison excludes tax-exempt employers. Neither version measures the proportion of licensed providers, available child-care seats, or home-based operations.
Disclosure and interpretation. Census uses disclosure protection and other estimation procedures. We checked the returned flags before calculating; an unavailable or suppressed cell must not be treated as a real zero. NES receipts carry noise flags, retained in the download. These are gross-receipts and payroll-status comparisons, not measures of owner count, survival, profitability, market demand or the legal classification of a worker.
Definition and methods references: Census nonemployer FAQ, NES methodology, and 2022 Economic Census methodology.
Cite this study
StartBusinessByState.com, “Which Service Businesses Have No Employees? An 11-Industry Comparison.” Published September 15, 2026. Calculations from U.S. Census Bureau 2022 Nonemployer Statistics and 2022 Economic Census.
When quoting a finding, name the category, data year and whether the percentage describes business counts or revenue. Link to this page so readers can inspect the definitions and download the figures.
Common questions
Does nonemployer mean a one-person business?
No. It means a business without paid employees in the Census definition. The data do not establish that there is one owner, that the owner performs every task, or that the business uses no contractors.
Are most cleaning businesses operated without employees?
In this 2022 comparison, nonemployers account for 94.2% of the combined janitorial business count. That is a payroll-status measure, not a count of solo cleaners or full-time owner-operators.
Does a higher percentage make an industry easier to enter?
No. The study measures the businesses already counted, not startup difficulty, local competition, licensing burdens or the probability that a new business will succeed.
Why not use the number of employer locations?
A firm with several locations would contribute several establishments. Using employer firms keeps the denominator closer to a business comparison; the separate establishment count remains in the CSV for transparency.
Continue your industry research
For the same industries broken out by state using 2023 NES and CBP employer establishments, see where service businesses stay solo: nonemployer share by state. That companion map uses establishments (not Economic Census firms) and a matched 2023 year.
For employer payroll levels and typical location size by state (QCEW 2024 private), see employer pay and typical location size by state.
For employer establishment openings/closings and job churn (BLS BED payroll universe — the complement to nonemployer counts), see service business openings, closings, and churn.
For the businesses that do have payroll, see how service-business sizes compare across employee brackets. The companion study separates small-employer counts from revenue shares and explains its narrower full-year-employer population.
For employment, payroll and state-level context, see cleaning industry statistics, landscaping industry statistics, child-care industry statistics, and beauty-salon industry statistics. Those pages have their own reference years and scope; their figures should not be silently substituted into this comparison.