Research edition: September 15, 2026 · BLS reference year: 2024 · U.S. private industry
In 2024, landscaping and the combined plumbing/HVAC industry each recorded an estimated 3.0 nonfatal workplace injuries and illnesses per 100 full-time-equivalent workers. Janitorial cleaning was 2.5 and child day care was 1.9, compared with 2.3 across private industry. These BLS case rates include illnesses; they are not the percentage of employees injured or insurance-claim rates.
This comparison covers eight selected service and contractor industries. It pairs published rates with sampling uncertainty, separates cases that disrupt work from other recordable cases, and provides a simple calculator for understanding the denominator.
Sources: BLS 2024 Table 1 and Table A1 sampling errors, published January 22, 2026. Rates are national estimates for employer-reported, recordable nonfatal cases.
Workplace injury and illness rates by service industry
Pet care excluding veterinary services had the highest published total rate in this selection, 5.8; carpet and upholstery cleaning followed at 5.6. Both estimates have substantial sampling uncertainty. They should not be presented as a definitive first- and second-place danger ranking, and this selection is not a list of the eight most hazardous U.S. industries.
Showing 8 selected industries; private-industry reference remains below.
| Industry | 2017 NAICS | Total recordable (TRC) | Days away, restriction or transfer (DART) | Days away (DAFW) | Restriction / transfer only (DJTR) | Other recordable |
|---|---|---|---|---|---|---|
| Pet care | 81291 | 5.8 | 2.0 | 1.5 | 0.5 | 3.8 |
| Carpet and upholstery cleaning services | 56174 | 5.6 | 4.8 | 3.9 | 0.9 | 0.9 |
| Landscaping services | 56173 | 3.0 | 2.0 | 1.4 | 0.6 | 1.0 |
| Plumbing, heating, and air-conditioning contractors | 23822 | 3.0 | 1.7 | 1.1 | 0.6 | 1.4 |
| Janitorial services | 56172 | 2.5 | 1.7 | 1.2 | 0.5 | 0.7 |
| Automotive repair and maintenance | 8111 | 1.9 | 1.1 | 0.9 | 0.3 | 0.8 |
| Child day care services | 6244 | 1.9 | 1.2 | 0.8 | 0.4 | 0.7 |
| Electrical contractors and other wiring installation contractors | 23821 | 1.8 | 1.1 | 0.7 | 0.3 | 0.8 |
| All private industry (reference) | All | 2.3 | 1.4 | 0.8 | 0.5 | 1.0 |
Values reproduce BLS’s published one-decimal rates. Components may not sum to totals because of rounding. DART is part of TRC, not an additional category to add on top of it. DAFW includes cases with days away even if they also involved restriction or transfer.
What does the work-disruption rate add?
DART measures recordable cases involving days away, restricted work or a job transfer. Landscaping and plumbing/HVAC share a total rate of 3.0, but their DART estimates are 2.0 and 1.7. Pet care’s total rate is 5.8 while its DART rate is 2.0; carpet cleaning’s total is 5.6 and DART is 4.8. Those distinctions can help frame staffing questions, without estimating how long a particular absence will last.
These are case frequencies, not lost-day totals, medical costs or injury severity scores. A case with one day away and a case with many days away each count as a case in the applicable category. The table does not tell us which hazards caused the cases.
How precise are the differences?
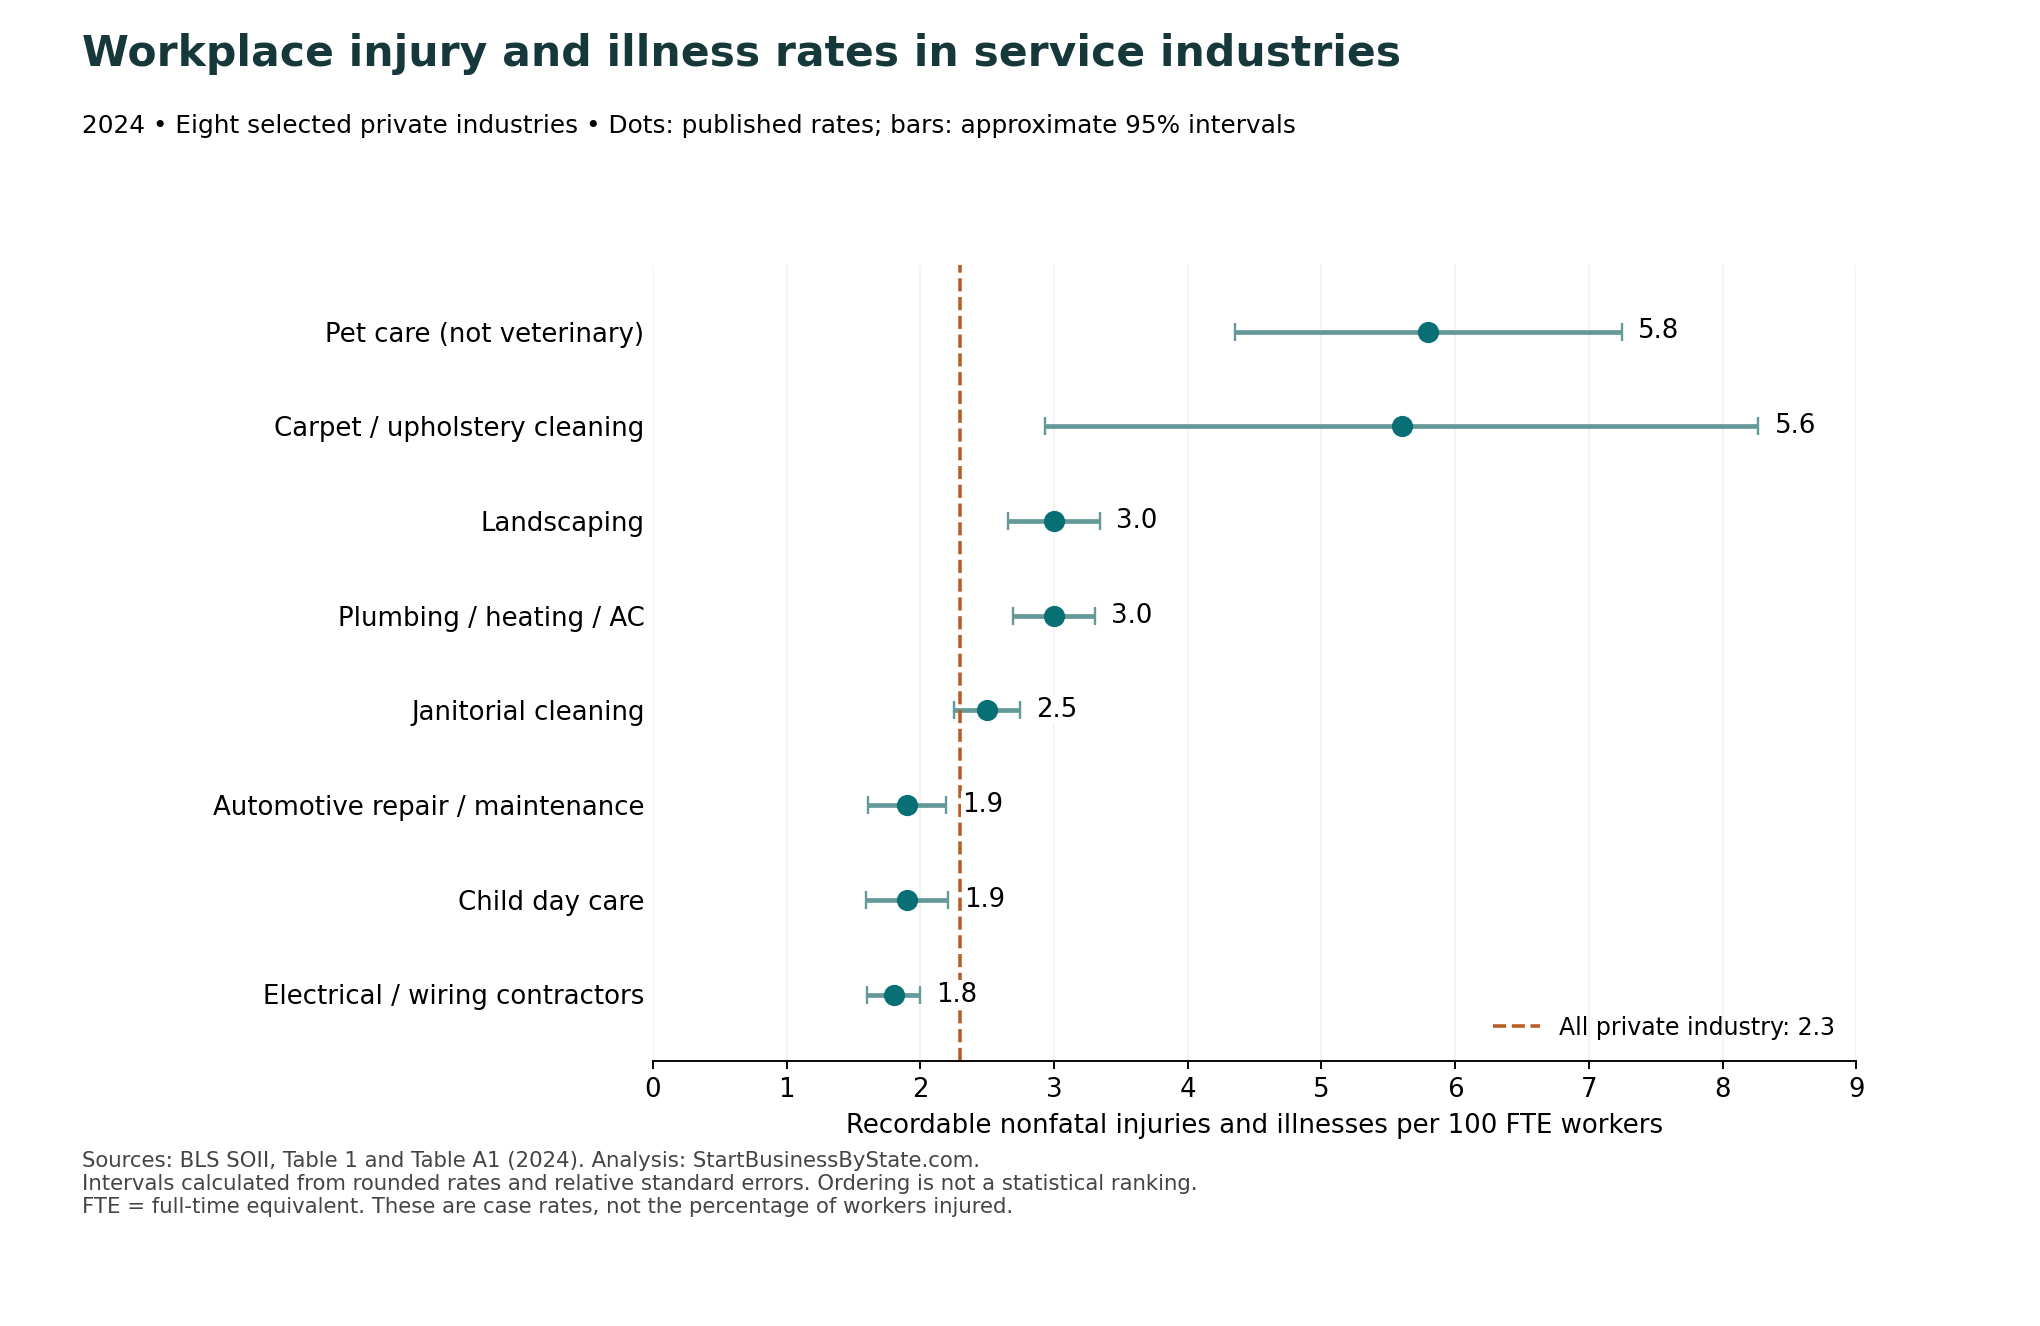
BLS reports a 24.3% relative standard error for carpet cleaning’s total rate, compared with 12.7% for pet care and 5.0% for janitorial cleaning. Applying BLS’s published confidence-interval formula gives an approximate range of 2.93–8.27 for carpet cleaning and 4.36–7.24 for pet care. The intervals overlap substantially.
Janitorial cleaning’s estimated 2.5 is numerically above the all-private rate of 2.3, but its approximate interval is 2.25–2.75. We do not treat a small numerical gap as proof of a real difference. No pairwise statistical tests are performed here; interval overlap alone is not a complete significance test.
View total-rate sampling errors and calculated intervals
| Industry | TRC rate | Relative standard error | Approx. 95% interval |
|---|---|---|---|
| Pet care | 5.8 | 12.7% | 4.36–7.24 |
| Carpet and upholstery cleaning services | 5.6 | 24.3% | 2.93–8.27 |
| Landscaping services | 3.0 | 5.9% | 2.65–3.35 |
| Plumbing, heating, and air-conditioning contractors | 3.0 | 5.2% | 2.69–3.31 |
| Janitorial services | 2.5 | 5.0% | 2.25–2.75 |
| Automotive repair and maintenance | 1.9 | 7.8% | 1.61–2.19 |
| Child day care services | 1.9 | 8.3% | 1.59–2.21 |
| Electrical contractors and other wiring installation contractors | 1.8 | 5.7% | 1.60–2.00 |
| Private industry | 2.3 | 0.4% | 2.28–2.32 |
Intervals describe sampling uncertainty around the estimated industry rate, not a range for an individual business or worker. They do not capture every source of error, such as missed cases, reporting mistakes or classification problems. See the BLS calculation and reliability methods.
Calculate a rate from cases and hours worked
The formula is recordable cases × 200,000 ÷ hours worked. The base of 200,000 hours represents 100 people working 40 hours a week for 50 weeks. Using hours makes differently sized workforces comparable; it does not turn the result into a probability that an employee will be hurt.
Illustrative calculator: the initial inputs are an example, not reported business data. Use cases and hours from the same calendar year and workforce. This calculator does arithmetic; it does not decide which incidents are recordable.
Example: 2 cases × 200,000 ÷ 100,000 hours = 4.00 cases per 100 FTE workers.
All-private-industry 2024 reference: 2.3. A comparison is descriptive, not a compliance finding, forecast or statistical test.
Use the formula above; the interactive calculation requires JavaScript.
Small employers can see large rate swings from a single case. With 10,000 hours worked, one case produces a rate of 20.0; with 100,000 hours, one case produces 2.0. Neither example alone establishes that one business has worse practices. A zero-case year produces a zero rate but does not prove that hazards are absent.
Count hours actually worked for the same employee population as the cases, rather than substituting headcount or paid leave hours. Do not enter near misses, customer incidents or every first-aid event as if they were automatically recordable cases. For definitions, consult the BLS case and coverage concepts and your applicable reporting guidance.
What these industry labels do—and do not—cover
- Cleaning: Janitorial Services and Carpet and Upholstery Cleaning Services are separate BLS categories. Their rates should not be swapped or averaged without the underlying exposure data.
- HVAC: NAICS 23822 includes plumbing, heating and air-conditioning contractors. Its 3.0 rate is not an HVAC-only estimate.
- Daycare: These are employee workplace cases, not injuries to children, licensing violations or a measure of child safety.
- Pet care: The category excludes veterinary services. It measures worker cases, not injuries to animals.
- Landscaping: This is an industry-wide employer estimate, not a rate for the specific occupation of tree trimmer. Our tree-work safety research addresses a different question involving fatal injuries.
The selected BLS table does not publish a separate salon-only or food-truck-only estimate. We do not relabel the broader personal-care or special-food-services categories as those businesses. Self-employed workers are outside SOII’s coverage; these figures cannot describe every owner-operated service business.
Use the data for staffing and insurance planning
For enforcement-program context rather than injury rates, review state payroll footprints in selected OSHA heat-targeted industries. Q1 2026 employment predates the revised directive; all payroll occupations are included. Job counts do not establish heat exposure, violations or inspection eligibility.
Use the benchmark as a starting point for questions about your own work: how incidents are recorded, what tasks expose staff to hazards, how absences would affect customer commitments, and who handles safety training. The survey does not identify a specific cause for the differences shown here or provide a complete prevention plan.
Industry rates do not set an insurance premium, determine coverage or replace state-specific requirements. They also are not workers’ compensation claim frequencies: an employer’s recording obligation and an insurer’s coverage decision are different questions. For coverage types, exclusions and quote preparation, use the relevant dedicated guide:
- Cleaning business insurance
- Landscaping business insurance
- HVAC business insurance
- Daycare business insurance
For setup and state-level planning, browse our cleaning, landscaping, HVAC and daycare startup guides. For workforce context, compare service-business sizes alongside the cleaning, landscaping and HVAC industry statistics. Keep counts of businesses, counts of workers and rates per hours worked separate.
Download the data and check the methodology
Download rates, sampling errors and calculated intervals (CSV) · Download the comparison chart (PNG)
Source and selection. This edition uses BLS’s 2024 Survey of Occupational Injuries and Illnesses annual summary Table 1 and its companion Table A1. Eight private industries were chosen for their relevance to service-business and contractor planning: janitorial cleaning, landscaping, plumbing/HVAC, child day care, carpet cleaning, pet care, electrical contracting and automotive repair. The all-private-industry row is a reference, not a ninth selected industry. This is not an exhaustive ranking or a small-business-only dataset.
Reproduction. The CSV retains each published industry name, 2017 NAICS code, five case-type rates and the corresponding relative standard errors. All selected rate and RSE cells are published values; no missing rate is treated as zero. Rates remain at the source’s one-decimal precision. We do not force rounded components to sum or average the selected industries into a new overall rate.
Calculated intervals. Standard error ≈ published rate × RSE ÷ 100. Approximate 95% interval = published rate ± 1.96 × standard error, following the BLS method. These are our calculations from rounded source values, not separately published BLS interval estimates. Tables show endpoints to two decimals solely to make the calculation checkable, not to imply extra precision in the underlying rate.
Units and comparability. All figures in the main table use the same year, private ownership and denominator of 100 full-time-equivalent workers. We do not combine them with the separate 2023–2024 biennial case-circumstance data, fatality rates per 100,000 workers, state estimates or insurance claims. The population excludes the self-employed and federal workers, and has other exclusions described by BLS.
Limitations. SOII is an employer-reporting sample survey, not a census of every workplace event. Sampling and nonsampling errors can affect estimates. The data does not establish an individual worker’s injury probability, a causal industry ranking, an exact number of injured people, or the rate for a new business. More than one case can involve the same worker.
Primary sources: 2024 rates, Table 1; 2024 relative standard errors, Table A1; calculation and reliability methods; SOII concepts and coverage. Source tables checked September 15, 2026. Calculations and presentation by StartBusinessByState.com.
Cite this study: StartBusinessByState.com, “Workplace Injury and Illness Rates by Service Industry,” September 15, 2026. Analysis of BLS SOII 2024 data. Retain the year, industry definition and “cases per 100 full-time-equivalent workers” when quoting a figure, and link to this page so readers can inspect the data and limitations.