Specialty-trade contractors and services to buildings and dwellings accounted for 7,199,310 average private payroll jobs across the 50 states and DC in Q1 2026. These selected industry families appear in OSHA’s revised heat-enforcement target list. Their combined footprint represented 5.46% of private employment, with the largest employment shares in Idaho and Utah.
That is an industry-footprint finding, not a count of workers exposed to dangerous heat. OSHA’s target list covers more industries than the two families studied here, and the directive expressly cautions against assuming heat exposure at every establishment within a listed industry.
Published September 18, 2026 · Employment: January–March 2026, BLS QCEW release August 28, 2026 · Federal directive: CPL 03-00-024, effective April 10, 2026 · Geography: 50 states + DC · All private payroll occupations and employer sizes.
Findings · State details · Full table · Methods and downloads
Why this comparison matters now
OSHA updated its heat National Emphasis Program on April 10, 2026. The revised Appendix A lists 55 target industries at the four-digit NAICS level. The program guides inspections and outreach; it is separate from the proposed federal heat standard. As of September 18, that rulemaking page still describes a proposal rather than a final standard.
The issue has a fresh reporting cycle: NOAA’s September 9 climate release identified the warmest contiguous-US summer in its 132-year record. At the NSC Safety Congress, an OSHA official discussed possible supplemental heat rulemaking, according to September 16 reporting by Safety+Health. That is a reported plan, not an issued supplemental rule. Our state table adds employment context to that discussion without treating older payroll figures as consequences of the summer or policy change.
Three findings worth separating
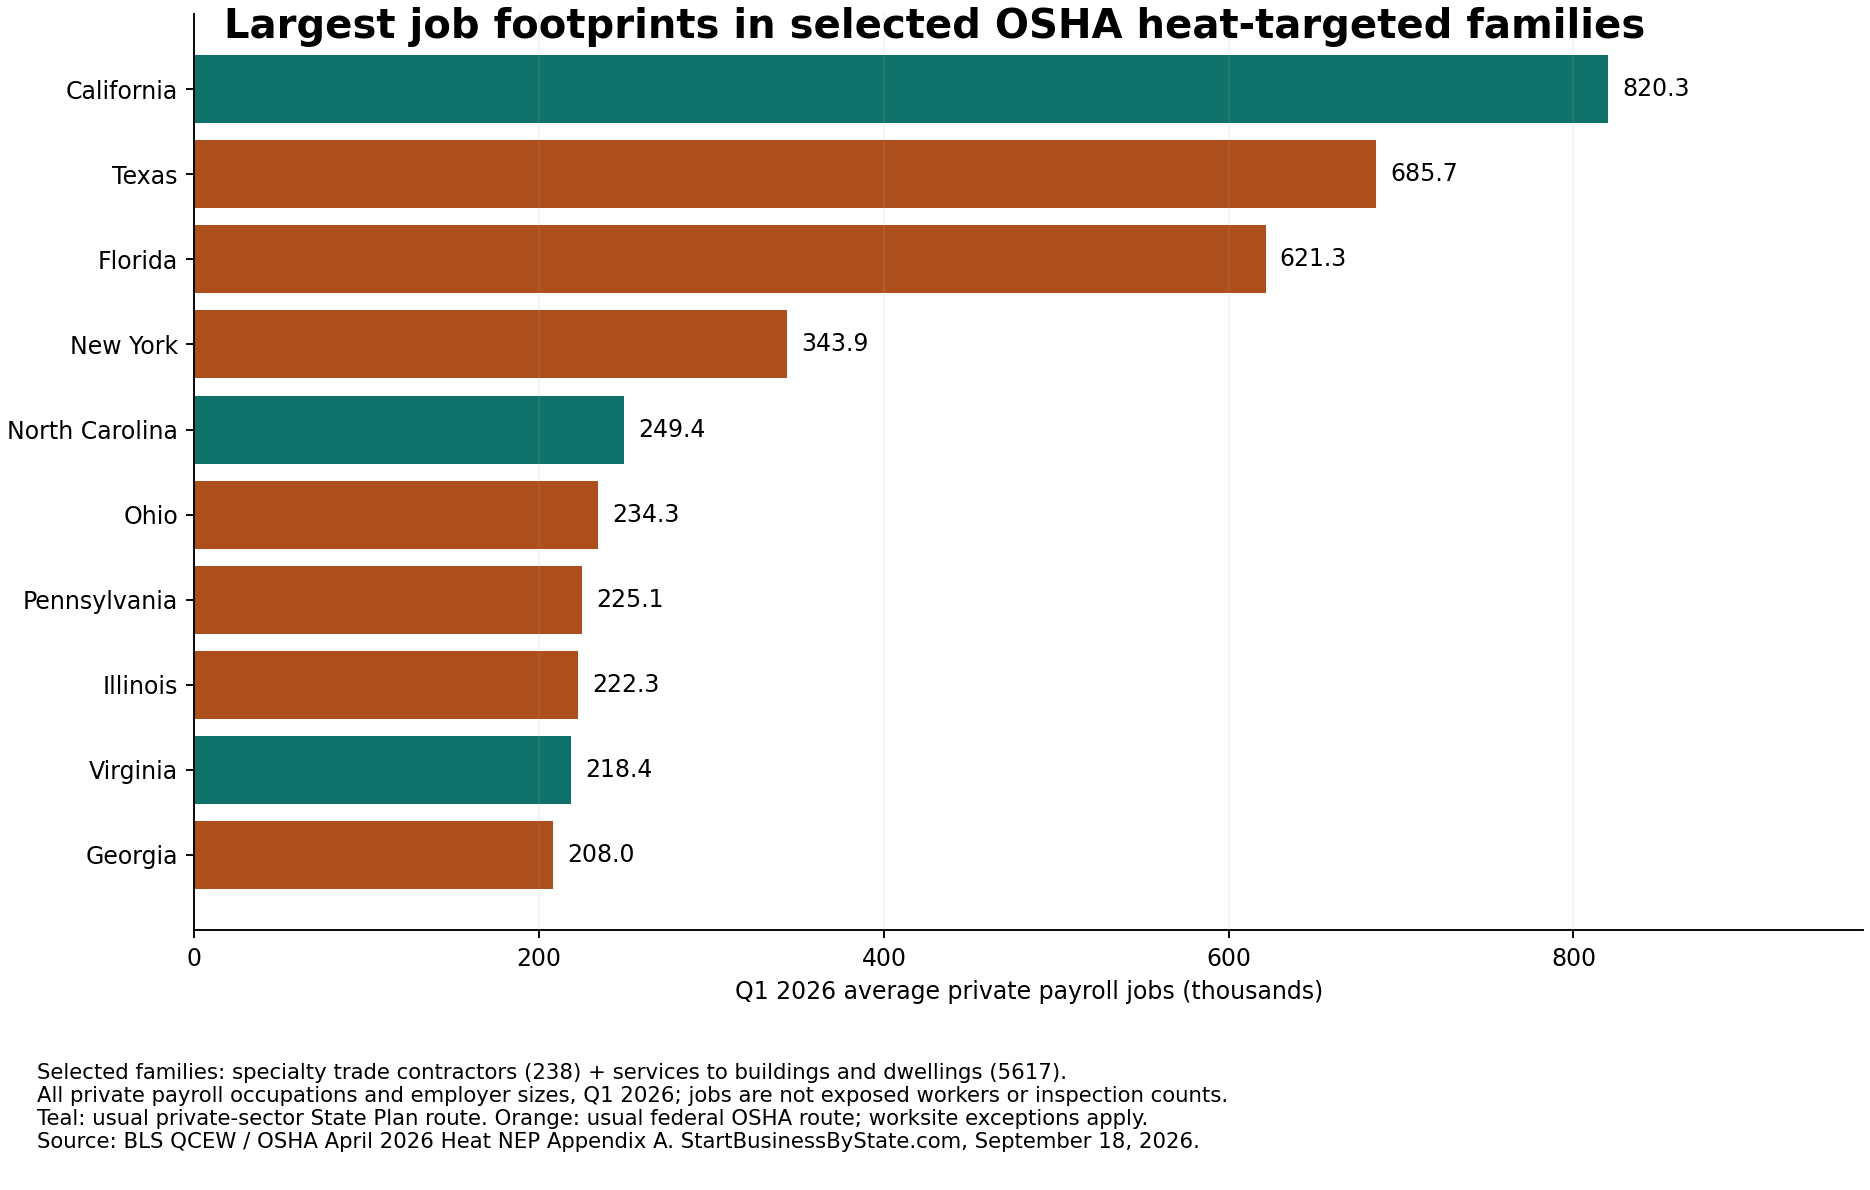
- The largest headcounts and largest concentrations are different stories. California had about 820,280 selected-family jobs, Texas 685,733 and Florida 621,347. Together, they held 29.5% of the 50-state/DC footprint. These are broad industry jobs, including administrative and other indoor roles.
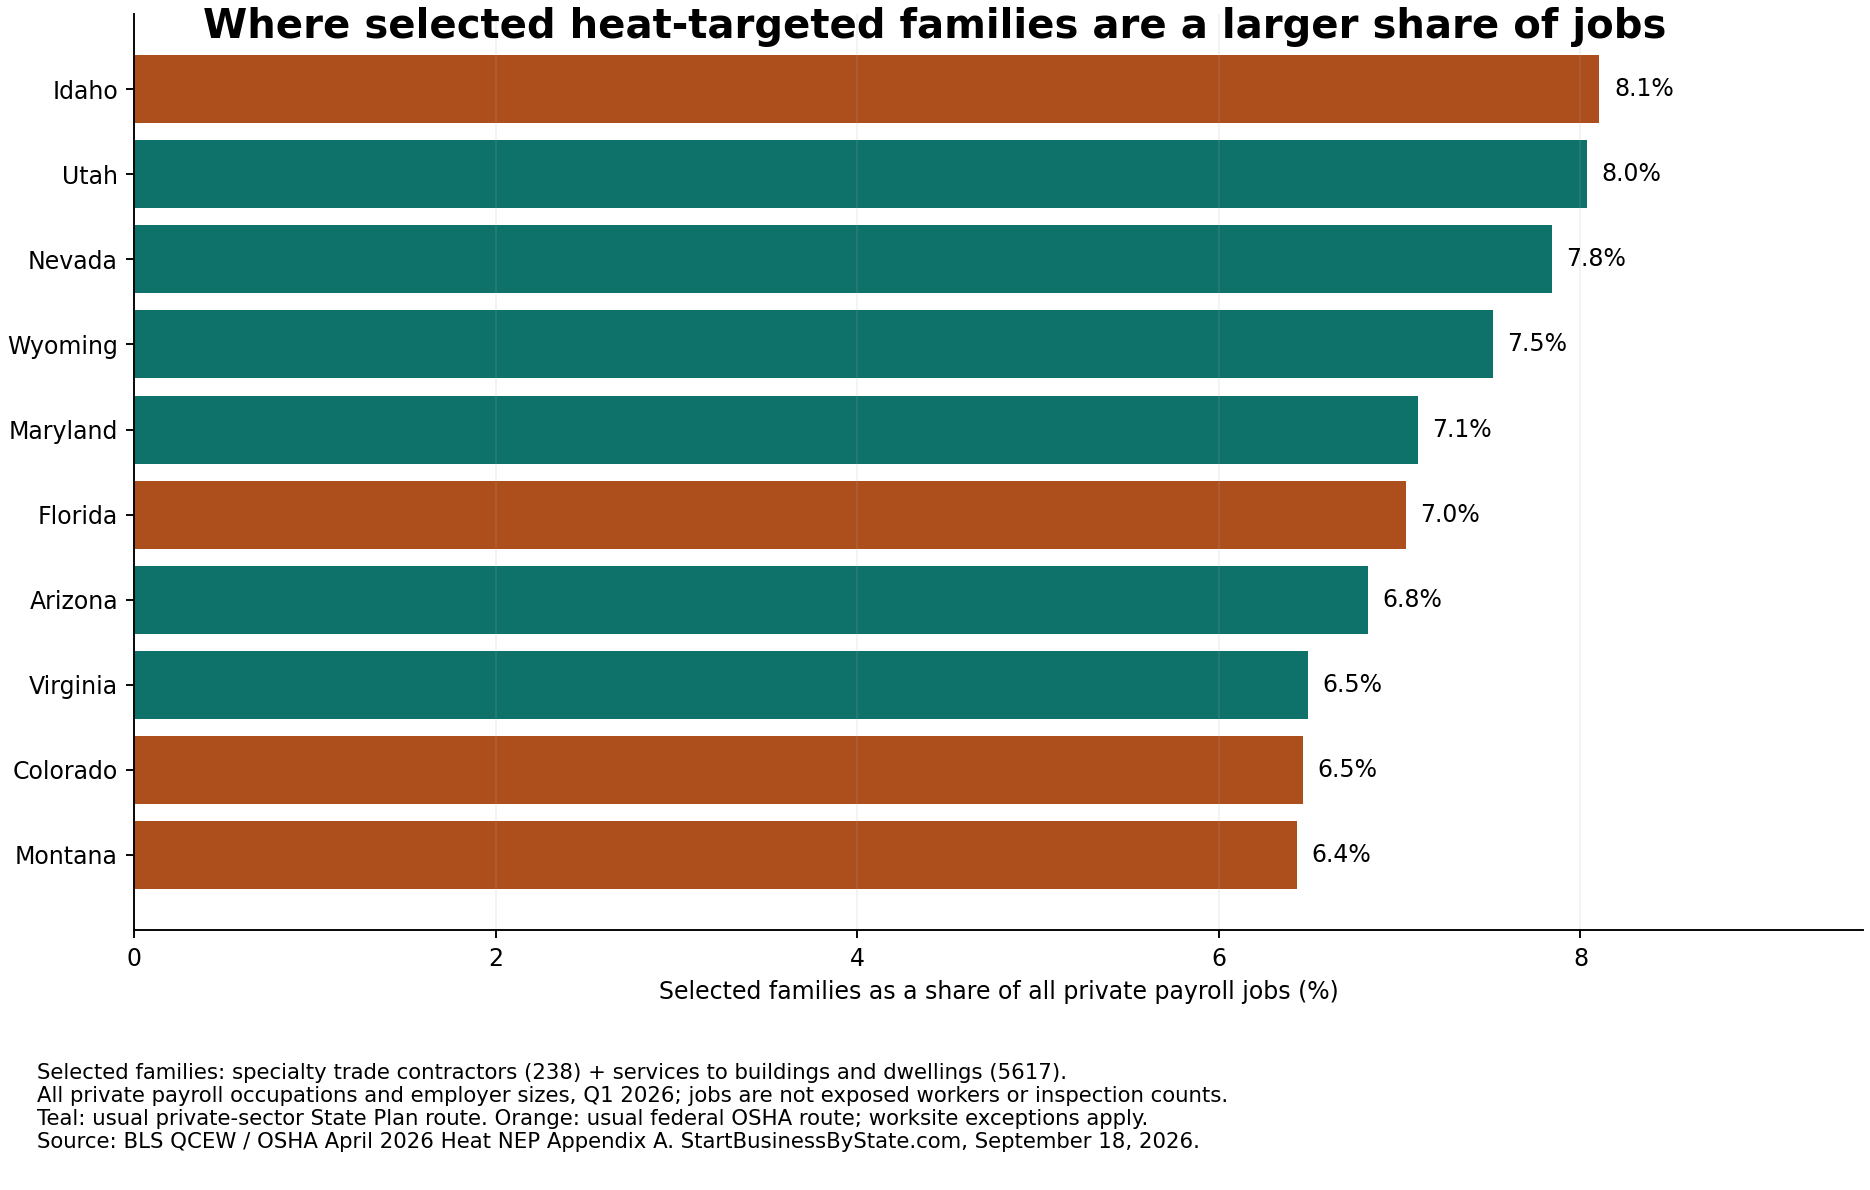
- Idaho and Utah led on employment share. The selected families represented 8.10% of Idaho private employment and 8.04% in Utah, compared with 5.46% across the 50 states and DC. Nevada was next at 7.84%. These percentages describe industry mix, not a heat-danger or inspection-probability ranking.
- Jurisdiction cuts across the footprint. Approximately 4.10 million selected jobs were in the 30 state/DC jurisdictions where federal OSHA is the usual private-sector route; 3.10 million were in the 21 states with private-sector State Plans. This geographic split does not establish which workplaces adopted the revised NEP or are eligible for inspection.
Exactly which industries are included?
The total combines two mutually exclusive QCEW categories. We chose them because they contain landscaping, cleaning and contractor businesses relevant to this site’s readers, while their parent groups are explicitly listed in the directive.
- Specialty trade contractors, NAICS 238: Appendix A lists all four component groups: 2381 foundation/structure/building exterior, 2382 building equipment, 2383 building finishing and 2389 other specialty trade contractors. The QCEW 238 total includes the full family—not only HVAC, roofing or outdoor work. The directive uses construction-worksite lists for programmed construction inspections, rather than simply treating employer lists as worksites.
- Services to buildings and dwellings, NAICS 5617: listed in Appendix A, Table 1, including landscape services, tree removal and trimming. It also includes janitorial, pest-control and other building-service operations. It is broader than landscaping alone.
The state detail tool also reports landscaping (56173), janitorial (56172), plumbing/heating/AC (23822) and roofing (23816). These are subsets of the two totals; they are not added again. Plumbing/HVAC includes all industry payroll occupations, not just HVAC technicians. Neither of the two selected totals represents all 55 NEP industries.
Look up your state’s industry footprint
Idaho
59,987 jobs · 8.10% of private jobs
Federal OSHA is the usual route for private-sector enforcement; worksite exceptions apply.
- Landscaping subset: 5,566 jobs
- Janitorial subset: 5,663 jobs
- Plumbing/HVAC subset: 11,117 jobs
- Roofing subset: 1,608 jobs
Subset values are already contained in the selected-family total. Payroll jobs do not establish hours outdoors, heat exposure, available technicians or eligible inspections.
All 50 states and DC
51 states/DC shown. Q1 2026 private payroll baseline; selected families only.
| State/DC | Specialty trades 238 | Building services 5617 | Selected total | Share of private jobs | Usual route* |
|---|---|---|---|---|---|
| Alabama | 67,407 | 27,464 | 94,871 | 5.51% | Federal OSHA |
| Alaska | 7,101 | 3,599 | 10,700 | 4.39% | State Plan |
| Arizona | 145,389 | 47,965 | 193,354 | 6.82% | State Plan |
| Arkansas | 41,253 | 17,840 | 59,093 | 5.37% | Federal OSHA |
| California | 569,401 | 250,879 | 820,280 | 5.31% | State Plan |
| Colorado | 113,439 | 41,808 | 155,247 | 6.46% | Federal OSHA |
| Connecticut | 42,083 | 25,984 | 68,066 | 4.73% | Federal OSHA |
| Delaware | 15,707 | 8,730 | 24,437 | 6.07% | Federal OSHA |
| District of Columbia | 8,096 | 11,069 | 19,166 | 3.79% | Federal OSHA |
| Florida | 422,023 | 199,324 | 621,347 | 7.03% | Federal OSHA |
| Georgia | 146,276 | 61,763 | 208,040 | 4.97% | Federal OSHA |
| Hawaii | 21,118 | 11,511 | 32,629 | 6.27% | State Plan |
| Idaho | 47,226 | 12,760 | 59,987 | 8.10% | Federal OSHA |
| Illinois | 146,804 | 75,540 | 222,343 | 4.32% | Federal OSHA |
| Indiana | 110,219 | 40,247 | 150,466 | 5.47% | State Plan |
| Iowa | 55,249 | 17,781 | 73,030 | 5.69% | State Plan |
| Kansas | 45,330 | 17,337 | 62,666 | 5.33% | Federal OSHA |
| Kentucky | 58,686 | 25,485 | 84,171 | 5.04% | State Plan |
| Louisiana | 65,998 | 21,796 | 87,794 | 5.45% | Federal OSHA |
| Maine | 20,821 | 8,523 | 29,344 | 5.56% | Federal OSHA |
| Maryland | 109,349 | 45,726 | 155,075 | 7.10% | State Plan |
| Massachusetts | 108,245 | 51,371 | 159,615 | 5.15% | Federal OSHA |
| Michigan | 123,642 | 58,137 | 181,779 | 4.83% | State Plan |
| Minnesota | 79,676 | 31,208 | 110,884 | 4.47% | State Plan |
| Mississippi | 29,538 | 13,964 | 43,502 | 4.65% | Federal OSHA |
| Missouri | 95,432 | 35,556 | 130,988 | 5.33% | Federal OSHA |
| Montana | 20,437 | 6,650 | 27,087 | 6.43% | Federal OSHA |
| Nebraska | 40,925 | 12,653 | 53,578 | 6.39% | Federal OSHA |
| Nevada | 81,702 | 27,701 | 109,404 | 7.84% | State Plan |
| New Hampshire | 20,862 | 10,517 | 31,379 | 5.31% | Federal OSHA |
| New Jersey | 102,045 | 58,451 | 160,496 | 4.41% | Federal OSHA |
| New Mexico | 29,716 | 9,024 | 38,740 | 5.68% | State Plan |
| New York | 233,783 | 110,069 | 343,852 | 4.17% | Federal OSHA |
| North Carolina | 174,971 | 74,399 | 249,370 | 5.92% | State Plan |
| North Dakota | 16,950 | 4,408 | 21,358 | 6.21% | Federal OSHA |
| Ohio | 165,875 | 68,422 | 234,297 | 4.97% | Federal OSHA |
| Oklahoma | 55,635 | 17,056 | 72,691 | 5.37% | Federal OSHA |
| Oregon | 65,493 | 25,677 | 91,170 | 5.53% | State Plan |
| Pennsylvania | 156,891 | 68,205 | 225,095 | 4.24% | Federal OSHA |
| Rhode Island | 13,669 | 7,205 | 20,874 | 4.92% | Federal OSHA |
| South Carolina | 75,253 | 35,493 | 110,746 | 5.69% | State Plan |
| South Dakota | 16,386 | 4,745 | 21,131 | 5.65% | Federal OSHA |
| Tennessee | 107,195 | 43,967 | 151,162 | 5.37% | State Plan |
| Texas | 504,844 | 180,889 | 685,733 | 5.69% | Federal OSHA |
| Utah | 94,498 | 22,973 | 117,472 | 8.04% | State Plan |
| Vermont | 9,154 | 3,481 | 12,635 | 5.01% | State Plan |
| Virginia | 147,959 | 70,393 | 218,352 | 6.49% | State Plan |
| Washington | 128,215 | 44,214 | 172,428 | 5.84% | State Plan |
| West Virginia | 18,235 | 7,697 | 25,931 | 4.68% | Federal OSHA |
| Wisconsin | 90,831 | 39,082 | 129,913 | 5.17% | Federal OSHA |
| Wyoming | 12,481 | 3,062 | 15,543 | 7.52% | State Plan |
*The route describes most private-sector workplaces, not every worksite. State names link to state business hubs because this table spans multiple industries. Connecticut, Illinois, Maine, Massachusetts, New Jersey and New York have public-sector-only State Plans; their private-sector route is federal OSHA. Puerto Rico and other territories are outside this 50-state/DC analysis. Alaska, Hawaii and DC are included.
What the table does not tell an employer
Employment counts do not establish a worksite’s legal obligations. Our state heat-law comparison covers selected current standards and new legislative developments, including the difference between air temperature and heat index.
The NEP’s programmed targeting depends on local National Weather Service heat advisories or warnings, industry criteria and worksite conditions. Complaints, referrals and other unprogrammed inspections are a separate route. The absence of an industry from our selected table does not establish exemption from heat enforcement.
OSHA’s State Plan information identifies the usual jurisdiction, but the federal directive encourages rather than requires State Plans to adopt this updated NEP. A State Plan may have its own program or heat rules. For example, Hawaii’s official directive register records adoption on August 7, 2026; that does not establish adoption elsewhere. We have not built a state-by-state NEP adoption or heat-standard database.
Employer size and appropriations-act inspection limitations and exceptions also matter. QCEW totals cannot determine an establishment’s eligibility. Nor does being in a listed industry prove a violation, set a temperature limit or predict a citation.
For practical planning, use the landscaping business guide and HVAC business guide alongside OSHA’s official heat resources and free, confidential On-Site Consultation program. The landscaping insurance guide addresses a separate coverage-planning question; insurance is not a substitute for prevention.
Our workplace injury and illness comparison measures a different outcome from a different dataset. The tree-work safety study addresses fatalities. For weather rather than enforcement-program context, see summer 2026 cooling weather and earlier plumbing/HVAC employment. These pages should not be combined into an invented risk score.
Download the data and reproduce the analysis
- Download the 51-row state dataset (CSV)
- Download the industry mapping and subset rules (CSV)
- Download the state job-footprint chart (PNG)
- Download the employment-share chart (PNG)
- Verify the directive. We checked the federal directive’s April 10, 2026 cover, Section VI and Appendix A against the scanned copy hosted by Hawaii’s labor department: official HIOSH-hosted directive PDF. Appendix A is on PDF pages 28–30, printed A-1 to A-3. Its 2017 NAICS target groups align with the selected QCEW groups at these levels; we do not infer individual establishment eligibility from code membership.
- Retrieve the payroll baseline. BLS public QCEW Q1 2026 industry CSVs: 238, 5617, 56173, 56172, 23822, 23816 and all private industries, 10. Retrieved September 18. Private ownership=5, all-size=0; statewide aggregation codes 55/56/57 for three/four/five-digit industries and 51 for total private. Retain 50 states/DC only. All 357 selected source cells were available without disclosure suppression.
- Calculate quarter averages. For every industry/state, average January, February and March employment counts. Selected jobs = average employment in 238 + average employment in 5617. The share = selected jobs / average all-private employment × 100. Aggregate the same 51 jurisdictions for the national-context figure; it is not a total including territories. Use unrounded values for calculations; display jobs as whole numbers and shares to two decimals. Independently recompute every value from original CSVs using Decimal arithmetic.
- Respect the payroll universe. QCEW counts covered full- and part-time payroll jobs across all occupations, not full-time equivalents or unique people. It excludes proprietors and unpaid family workers. The baseline includes employers of every size, not just small businesses, and may be revised. Landscaping is seasonal: Q1 is not summer or a whole-year staffing average.
- Classify usual jurisdiction separately. OSHA lists 22 State Plans covering private-sector workers, including Puerto Rico. Excluding Puerto Rico gives 21 states in this dataset; the other 29 states plus DC have the federal route for private workers. Public-sector-only State Plans are not counted as private-sector plans. Classification is verified as of September 18, 2026 and does not establish NEP adoption, applicable state heat-rule detail or federal jurisdiction exceptions.
Frequently asked questions
Are these 7.2 million workers exposed to dangerous heat?
No. They are payroll jobs in two selected industry families. The data does not measure exposure, location within a worksite, hours outdoors or heat illness. The directive warns that exposure should not be assumed at every establishment in a listed industry.
Does this cover every industry in OSHA’s heat program?
No. It covers specialty trade contractors and services to buildings and dwellings. Appendix A lists 55 four-digit industries; this is a focused subset, not the complete program footprint.
Did the April 2026 program create or eliminate these jobs?
This analysis cannot answer that. Q1 employment predates the revised directive. It is an industry baseline, not an estimate of policy effects or summer hiring.
Does a State Plan label mean the state adopted the federal NEP?
No. It identifies the usual private-sector enforcement route. State Plans are encouraged to adopt the revised program, but adoption and state-specific heat requirements require separate verification.
Suggested citation: StartBusinessByState.com, “OSHA Heat Program: Selected Industry Employment by State,” September 18, 2026; analysis of BLS QCEW Q1 2026 and OSHA CPL 03-00-024 Appendix A. Identify the selected families and payroll period when quoting a figure.