Fixed edition analyzed September 16, 2026. BEA Regional SAINC1 personal income and per capita personal income for 2021–2025 (API note: last updated April 9, 2026 — new 2025; revised 2020–2024), current dollars. Census Business Formation Statistics business applications (BA, not seasonally adjusted) summed to calendar years 2021–2025. Correlation check only — not a ranking and not causation.
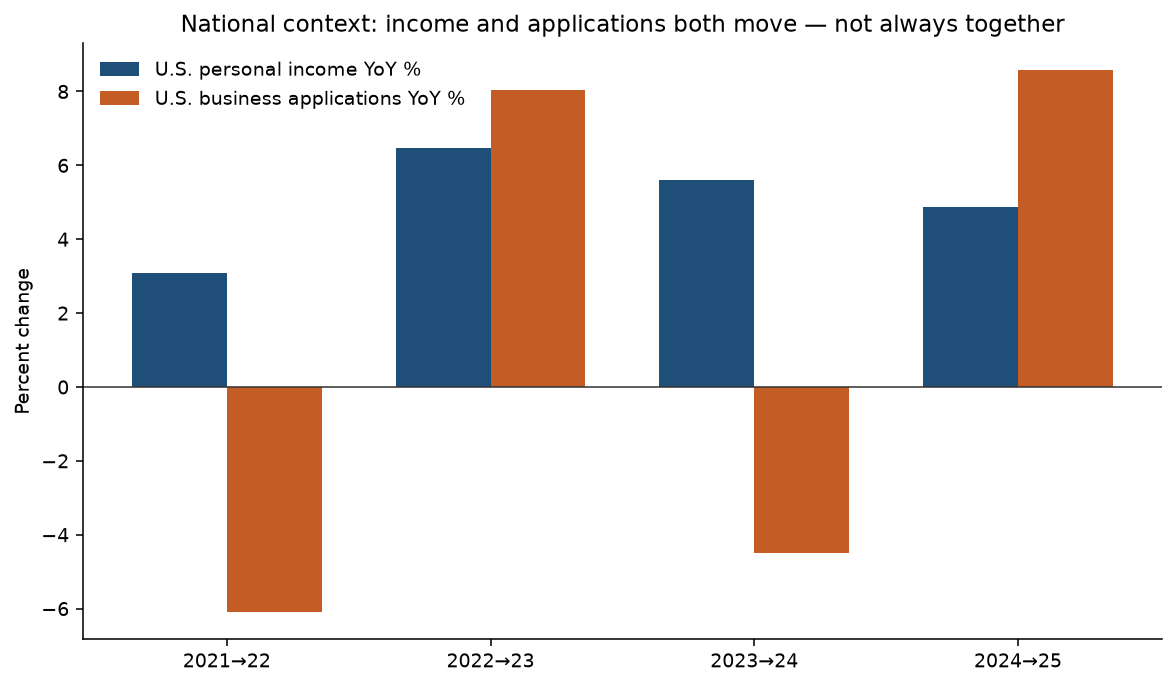
U.S. personal income rose +4.9% from 2024 to 2025, while Americans filed 5,671,836 business applications in calendar 2025 (+8.6% from 2024). Do the states with the fastest income growth also post the fastest application growth?
Mostly no. Across 50 states and D.C., the 2024→2025 Pearson correlation between personal-income growth and business-application growth is +0.09 (Spearman +0.05). That is a near-zero association — the same humble framing as our state migration vs business formation study. Income growth and application filings can both rise nationally without lining up state by state.
What we compared
- Income: BEA table SAINC1 line 1 (personal income, millions of current dollars) and line 3 (per capita personal income). Not inflation-adjusted; see Methods for the optional real-income check on earlier years.
- Applications: Census BFS monthly BA, non-seasonally adjusted, summed to calendar years so the clock matches annual income — the same CY approach as the migration study, not the Aug–Jul rolling window on our business formation statistics page.
- Metric: Year-over-year percent change, then scatter and rank correlation. We also report results without Wyoming and Delaware, whose extreme per-capita application rates are discussed on the formation page.
The latest year barely agrees
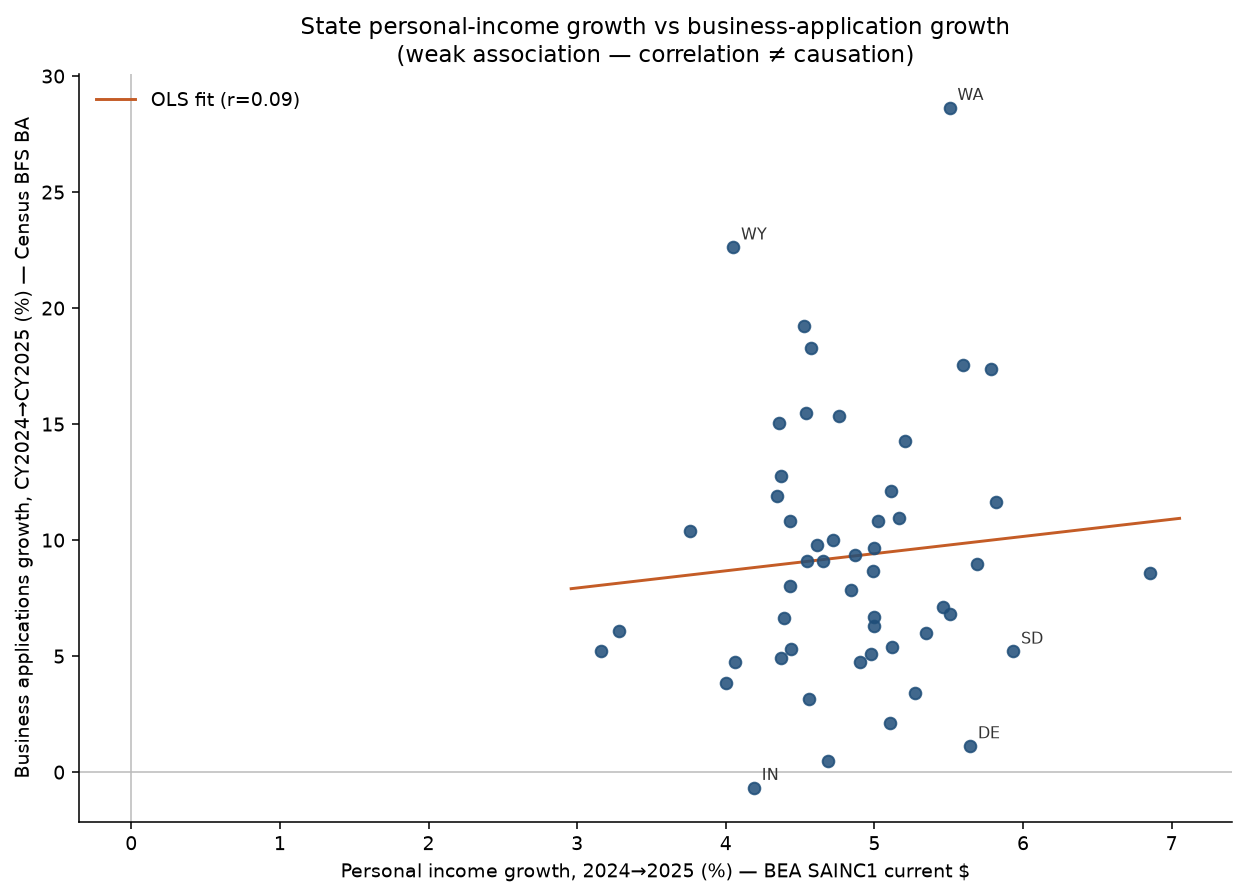
Removing Wyoming and Delaware still leaves a weak link (r = +0.20, ρ = +0.15, n = 49). Per capita personal income growth is no better as a predictor of application growth (r = +0.11).
In 2024→2025, 50 of 51 jurisdictions saw both income and applications rise. Only Indiana posted rising income with falling applications (-0.7% apps). Shared national direction is not the same as aligned state rankings.
The association is unstable across years
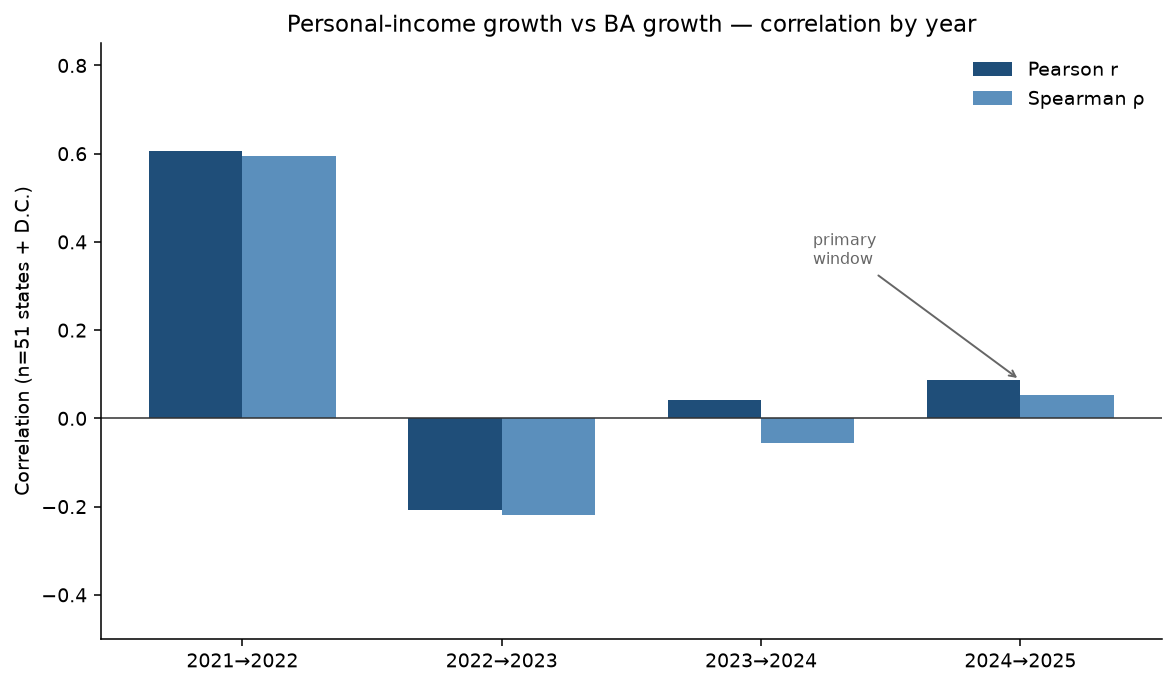
| Window | Pearson r (ΔPI vs Δapps) | Spearman ρ | Pearson r (ΔPCPI vs Δapps) | n |
|---|---|---|---|---|
| 2021→2022 | +0.61 | +0.60 | +0.66 | 51 |
| 2022→2023 | -0.21 | -0.22 | -0.22 | 51 |
| 2023→2024 | +0.04 | -0.06 | +0.07 | 51 |
| 2024→2025 | +0.09 | +0.05 | +0.11 | 51 |
| Pooled panel | +0.33 | +0.23 | — | 204 |
2021→2022 shows a moderate positive association; 2022→2023 flips mildly negative; the two most recent windows sit near zero. A pooled panel average (r ≈ 0.33) still does not justify treating income growth as a formation ranking signal.
Where the rankings diverge
| State | PI growth | PI rank | Apps growth | Apps rank | Rank gap |
|---|---|---|---|---|---|
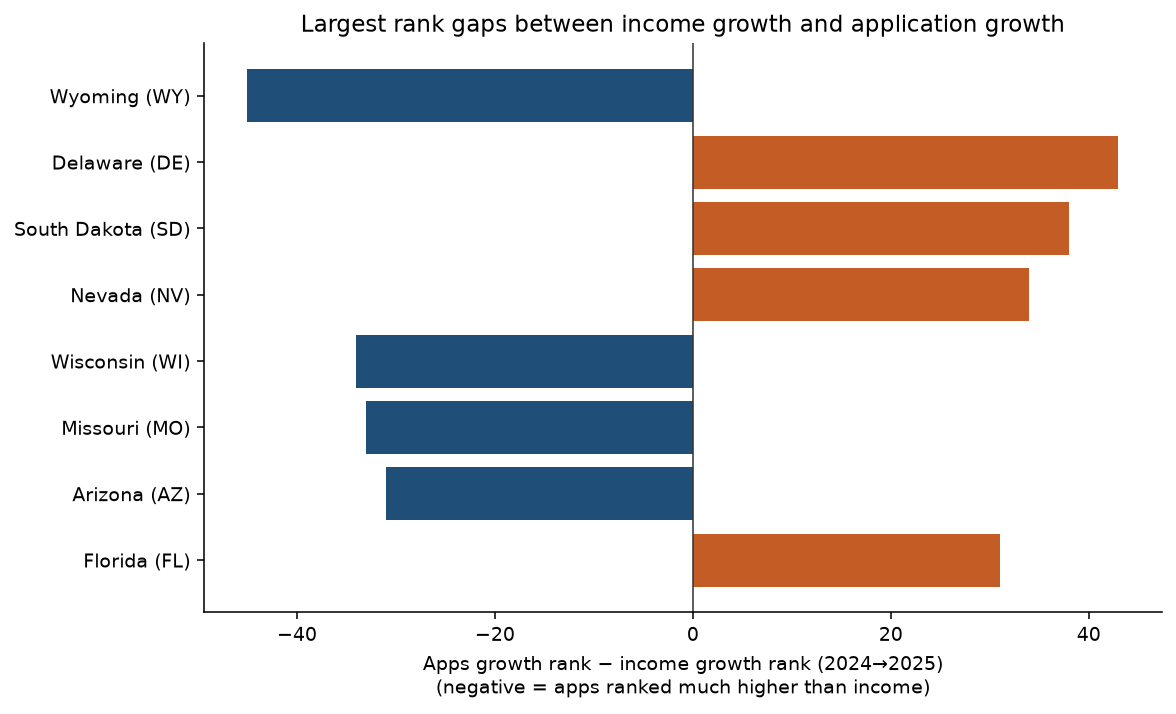
| Wyoming | +4.1% | #47 | +22.6% | #2 | -45 |
| Delaware | +5.6% | #6 | +1.1% | #49 | +43 |
| South Dakota | +5.9% | #2 | +5.2% | #40 | +38 |
| Nevada | +5.3% | #12 | +3.4% | #46 | +34 |
| Wisconsin | +4.4% | #43 | +15.1% | #9 | -34 |
| Missouri | +4.5% | #36 | +19.2% | #3 | -33 |
Wyoming’s application surge alongside middling income growth — and Delaware’s stronger income growth alongside soft application growth — fit the measurement caveats on our formation statistics page: BFS counts applications, not local employer births.
All 50 states and D.C. (2024→2025)
Download the CSV: personal-income-vs-business-formation-2024-2025.csv. State names link to state hubs.
| State | PI 2024 ($M) | PI 2025 ($M) | PI YoY | PCPI YoY | Apps 2024 | Apps 2025 | Apps YoY | Rank gap |
|---|---|---|---|---|---|---|---|---|
| Hawaii | 102,703.8 | 109,742.4 | +6.8% | +7.0% | 18,014 | 19,558 | +8.6% | 26 |
| South Dakota | 69,996.3 | 74,150.0 | +5.9% | +5.0% | 11,494 | 12,092 | +5.2% | 38 |
| North Carolina | 724,994.6 | 767,182.6 | +5.8% | +4.4% | 163,580 | 182,653 | +11.7% | 11 |
| Kansas | 195,633.0 | 206,945.7 | +5.8% | +5.4% | 31,982 | 37,534 | +17.4% | 2 |
| South Carolina | 332,982.7 | 351,926.0 | +5.7% | +4.2% | 86,364 | 94,104 | +9.0% | 20 |
| Delaware | 71,594.2 | 75,635.2 | +5.6% | +4.7% | 59,463 | 60,132 | +1.1% | 43 |
| New Mexico | 124,086.2 | 131,026.8 | +5.6% | +5.7% | 34,673 | 40,758 | +17.6% | -2 |
| Idaho | 124,746.7 | 131,619.9 | +5.5% | +4.0% | 31,144 | 33,267 | +6.8% | 23 |
| Washington | 677,934.6 | 715,263.1 | +5.5% | +4.5% | 110,542 | 142,196 | +28.6% | -8 |
| California | 3,400,237.3 | 3,585,890.9 | +5.5% | +5.5% | 517,133 | 553,931 | +7.1% | 20 |
| Oklahoma | 260,910.2 | 274,858.0 | +5.3% | +4.7% | 53,645 | 56,855 | +6.0% | 25 |
| Nevada | 228,086.6 | 240,111.7 | +5.3% | +4.3% | 62,655 | 64,781 | +3.4% | 34 |
| Tennessee | 480,671.2 | 505,698.3 | +5.2% | +4.3% | 90,327 | 103,220 | +14.3% | -3 |
| Montana | 78,741.6 | 82,807.2 | +5.2% | +4.5% | 26,939 | 29,887 | +10.9% | 1 |
| North Dakota | 57,153.4 | 60,077.4 | +5.1% | +4.3% | 8,455 | 8,912 | +5.4% | 22 |
| Florida | 1,706,305.7 | 1,793,464.1 | +5.1% | +4.2% | 634,356 | 647,734 | +2.1% | 31 |
| Mississippi | 153,256.4 | 161,093.5 | +5.1% | +5.0% | 46,805 | 52,467 | +12.1% | -4 |
| Texas | 2,184,833.3 | 2,294,646.6 | +5.0% | +3.7% | 490,959 | 544,146 | +10.8% | -2 |
| Nebraska | 145,798.5 | 153,082.3 | +5.0% | +4.3% | 20,862 | 22,876 | +9.7% | 1 |
| New Hampshire | 117,220.3 | 123,076.5 | +5.0% | +4.5% | 15,977 | 17,046 | +6.7% | 13 |
| Utah | 235,907.4 | 247,691.4 | +5.0% | +3.9% | 68,471 | 72,787 | +6.3% | 13 |
| Arkansas | 183,201.8 | 192,345.6 | +5.0% | +4.4% | 36,365 | 39,512 | +8.7% | 4 |
| Rhode Island | 78,553.7 | 82,465.2 | +5.0% | +4.6% | 11,226 | 11,800 | +5.1% | 18 |
| Georgia | 704,463.9 | 738,993.1 | +4.9% | +4.0% | 243,084 | 254,582 | +4.7% | 20 |
| Pennsylvania | 924,379.6 | 969,412.5 | +4.9% | +4.8% | 147,457 | 161,275 | +9.4% | -3 |
| Alabama | 295,590.5 | 309,906.4 | +4.8% | +4.2% | 65,324 | 70,466 | +7.9% | 3 |
| Alaska | 56,423.1 | 59,110.5 | +4.8% | +4.7% | 9,130 | 10,531 | +15.3% | -19 |
| Colorado | 494,798.6 | 518,167.9 | +4.7% | +4.3% | 130,718 | 143,807 | +10.0% | -9 |
| Maine | 96,850.3 | 101,392.7 | +4.7% | +4.2% | 14,118 | 14,186 | +0.5% | 21 |
| Iowa | 211,425.4 | 221,266.3 | +4.7% | +4.4% | 32,113 | 35,038 | +9.1% | -7 |
| Virginia | 681,552.2 | 712,992.6 | +4.6% | +3.9% | 126,386 | 138,762 | +9.8% | -11 |
| Kentucky | 267,297.9 | 279,513.8 | +4.6% | +4.0% | 54,138 | 64,042 | +18.3% | -28 |
| New York | 1,699,680.0 | 1,777,164.5 | +4.6% | +4.5% | 291,884 | 301,047 | +3.1% | 14 |
| Minnesota | 437,981.9 | 457,907.5 | +4.5% | +4.0% | 67,673 | 73,825 | +9.1% | -10 |
| Ohio | 766,045.8 | 800,799.1 | +4.5% | +4.2% | 145,662 | 168,207 | +15.5% | -28 |
| Missouri | 405,457.2 | 423,808.7 | +4.5% | +4.1% | 85,028 | 101,393 | +19.2% | -33 |
| Illinois | 947,182.8 | 989,192.4 | +4.4% | +4.3% | 171,362 | 189,879 | +10.8% | -21 |
| New Jersey | 806,558.7 | 842,372.2 | +4.4% | +4.0% | 153,020 | 161,138 | +5.3% | 1 |
| West Virginia | 97,970.7 | 102,315.6 | +4.4% | +4.5% | 15,167 | 16,387 | +8.0% | -11 |
| Connecticut | 349,377.1 | 364,716.0 | +4.4% | +4.0% | 46,736 | 49,834 | +6.6% | -7 |
| Massachusetts | 667,993.0 | 697,205.3 | +4.4% | +4.2% | 75,426 | 79,139 | +4.9% | 1 |
| Michigan | 645,846.8 | 674,070.6 | +4.4% | +4.1% | 134,838 | 152,060 | +12.8% | -31 |
| Wisconsin | 403,888.3 | 421,498.1 | +4.4% | +4.1% | 62,118 | 71,475 | +15.1% | -34 |
| Arizona | 498,903.6 | 520,574.1 | +4.3% | +3.4% | 121,271 | 135,679 | +11.9% | -31 |
| Indiana | 443,688.8 | 462,278.6 | +4.2% | +3.6% | 90,375 | 89,768 | -0.7% | 6 |
| Oregon | 302,582.3 | 314,868.7 | +4.1% | +3.9% | 59,813 | 62,652 | +4.8% | -3 |
| Wyoming | 50,815.4 | 52,873.5 | +4.0% | +3.7% | 64,444 | 79,023 | +22.6% | -45 |
| Vermont | 46,229.3 | 48,079.2 | +4.0% | +4.3% | 7,295 | 7,575 | +3.8% | -3 |
| Louisiana | 284,587.2 | 295,288.3 | +3.8% | +3.7% | 68,514 | 75,620 | +10.4% | -31 |
| Maryland | 496,413.9 | 512,715.9 | +3.3% | +3.0% | 95,446 | 101,253 | +6.1% | -15 |
| District of Columbia | 78,079.5 | 80,546.6 | +3.2% | +2.8% | 14,205 | 14,945 | +5.2% | -12 |
What this can and cannot tell you
- Correlation is not cause. Coefficients are reported with sample size. A value near 0.1 is a weak association, not a mechanism.
- Current dollars. SAINC1 personal income is not inflation-adjusted. Real personal income (BEA SARPI) was available through 2024 in this pull and does not change the weak-link conclusion for those earlier windows.
- Applications ≠ employers or LLCs. BFS BA is EIN filing intent. Most applications never become employer businesses; see business formation statistics for conversion context and business survival rates by state for later outcomes.
- Different question than migration. Household moves (IRS) and personal-income growth (BEA) are related but not the same. Both pair weakly with application growth in their respective matched windows.
- Labor market sibling. For whether unemployment changes track service payroll hiring, see unemployment vs service hiring by state.
- Price-level sibling. For BEA SARPP regional price parities vs OEWS wages and NDCP daycare prices (purchasing-power check), see regional price parities vs wages and daycare.
Industry context: cleaning, landscaping, HVAC, and daycare industry statistics.
Methods (short)
BEA API Regional / SAINC1 lines 1 and 3 for years 2021–2025; percent changes matched to Census BFS calendar-year BA sums (NSA series filters matching prior SBL BFS pulls; CY2023 U.S. total 5,469,302 matches the migration study). Primary window 2024→2025; panel also 2021→2022 through 2023→2024. Full documentation: methods notes in the study work folder.
Sources
| Data | Source | Vintage |
|---|---|---|
| State personal income & PCPI | BEA Regional SAINC1 (API) | 2021–2025; API note Apr 9, 2026 |
| Real personal income (optional) | BEA Regional SARPI | 2021–2024 in this pull |
| Business applications (BA) | U.S. Census Bureau, Business Formation Statistics | CY2021–CY2025 monthly NSA sums |