Original research · BLS Business Employment Dynamics (BED / API survey BD) · Seasonally adjusted rates · Primary window 2025 (mean of Q1–Q4) · Latest quarter in pull 2025 Q4 · Published September 16, 2026
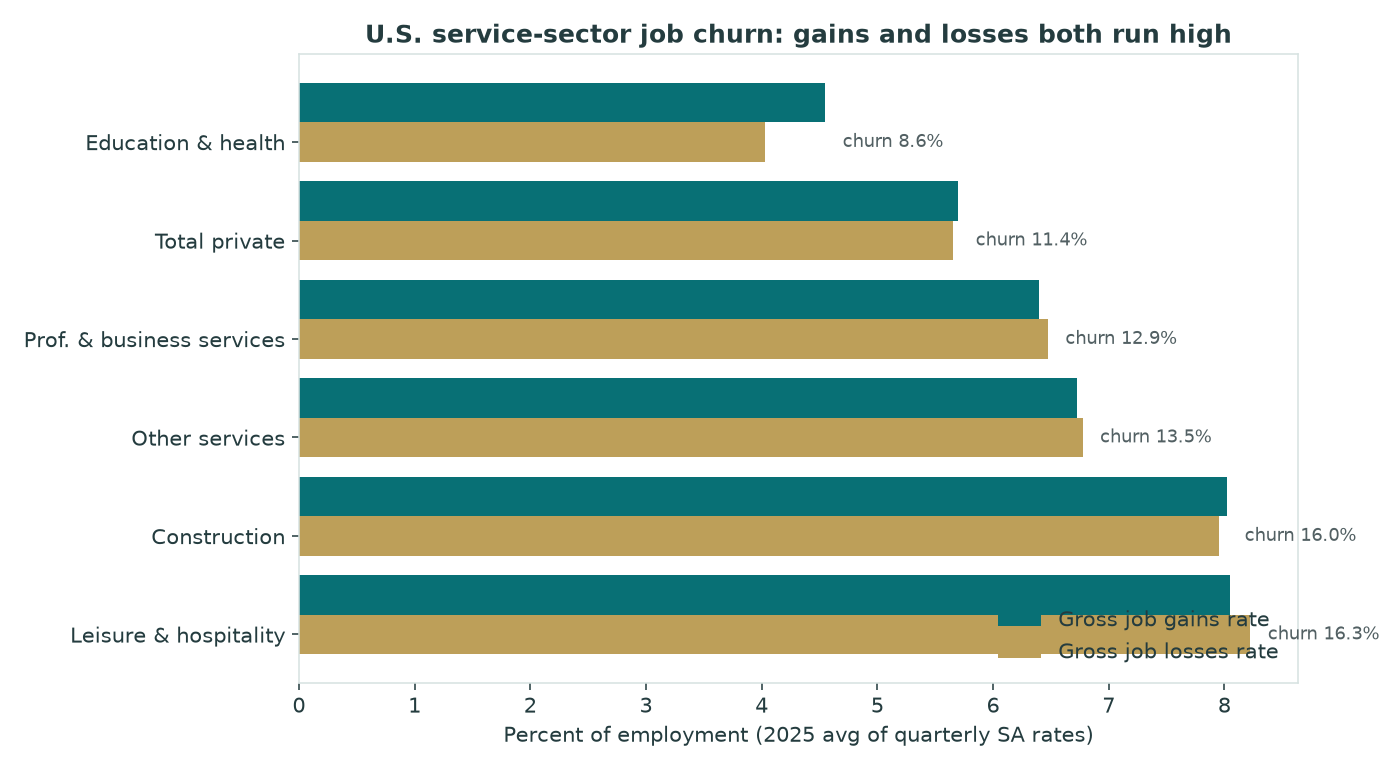
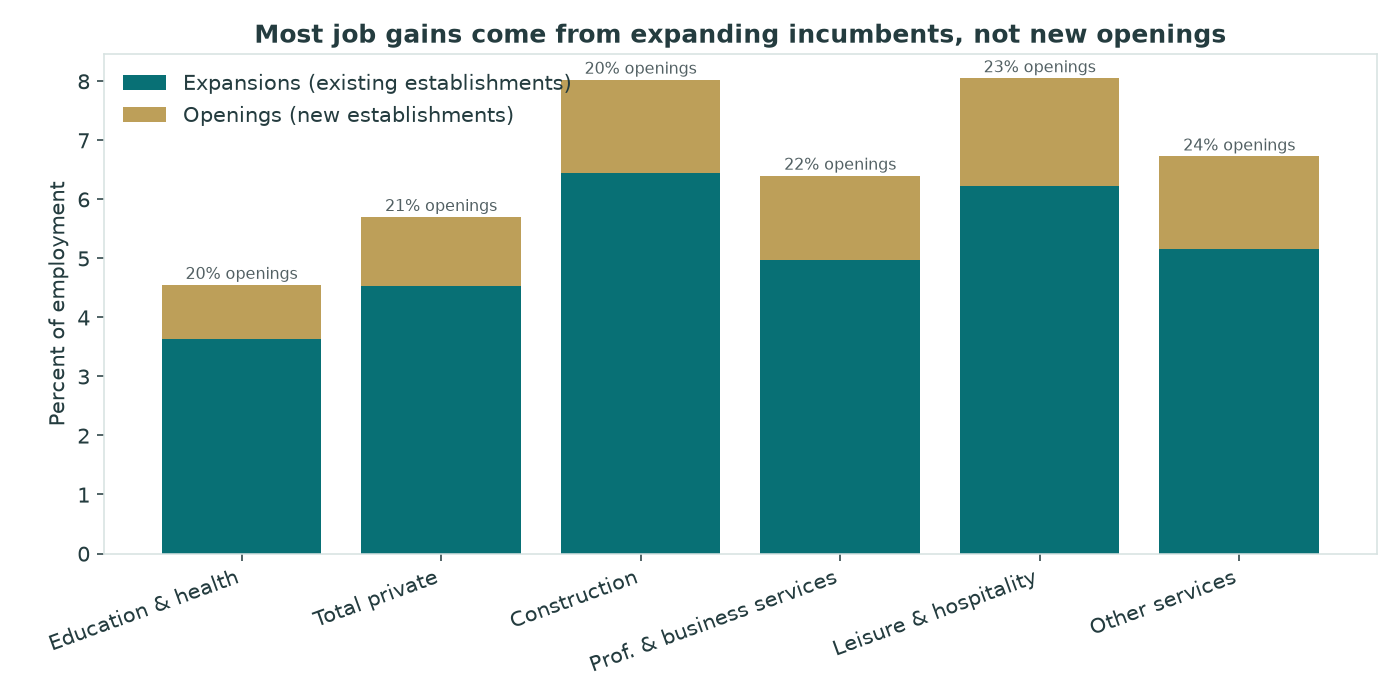
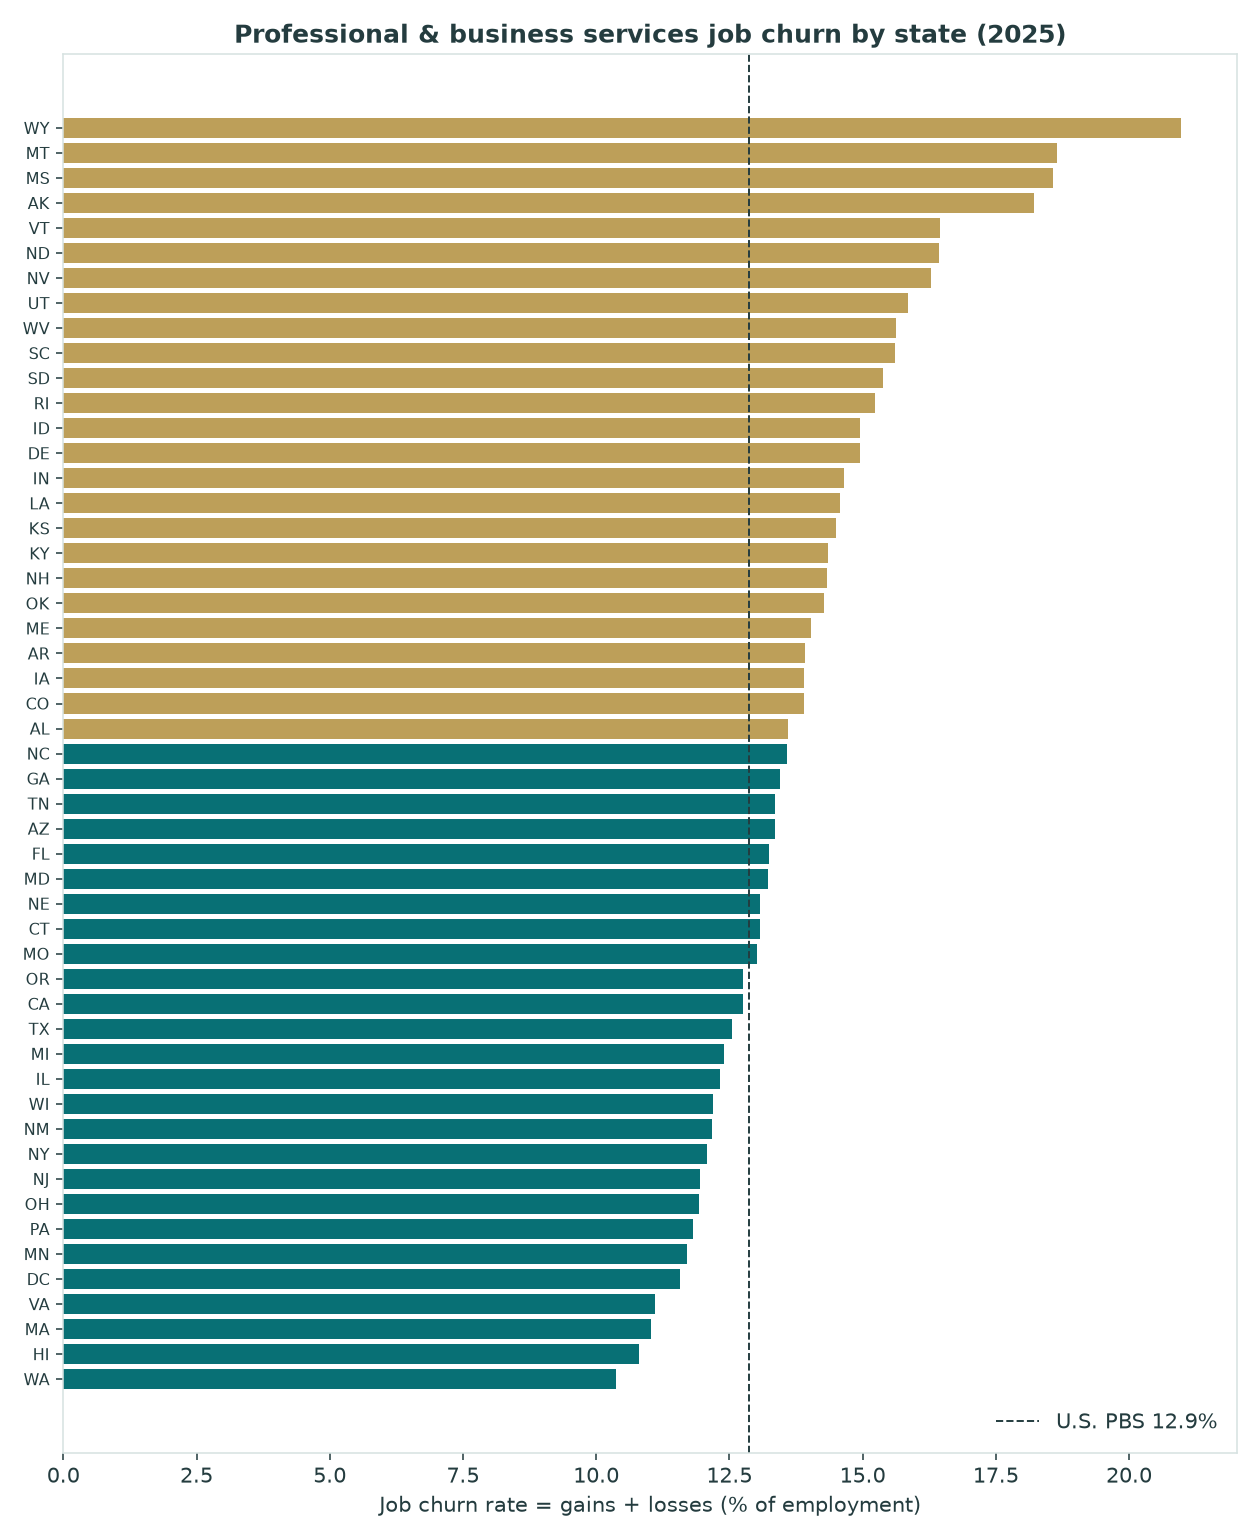
Service-sector job churn is a flow story, not a survival ranking. In 2025, U.S. leisure & hospitality establishments turned over jobs at a 16.3% combined gains+losses rate and construction at 16.0%, while education & health ran much quieter at 8.6%. Professional & business services — the BED sector that contains administrative & support employers such as janitorial and landscaping rollups — sat at 12.9%, with state churn stretching from WA 10.4% to WY 21.0%. Roughly four-fifths of job gains still come from expanding establishments, not openings. This page uses BED’s published state × sector grain; it does not invent 6-digit NAICS cross-tabs.
Key findings
- Sector ordering is stark. 2025 U.S. job churn (gains + losses as % of employment): leisure/hospitality 16.3%, construction 16.0%, other services 13.5%, professional & business services 12.9%, total private 11.4%, education & health 8.6%.
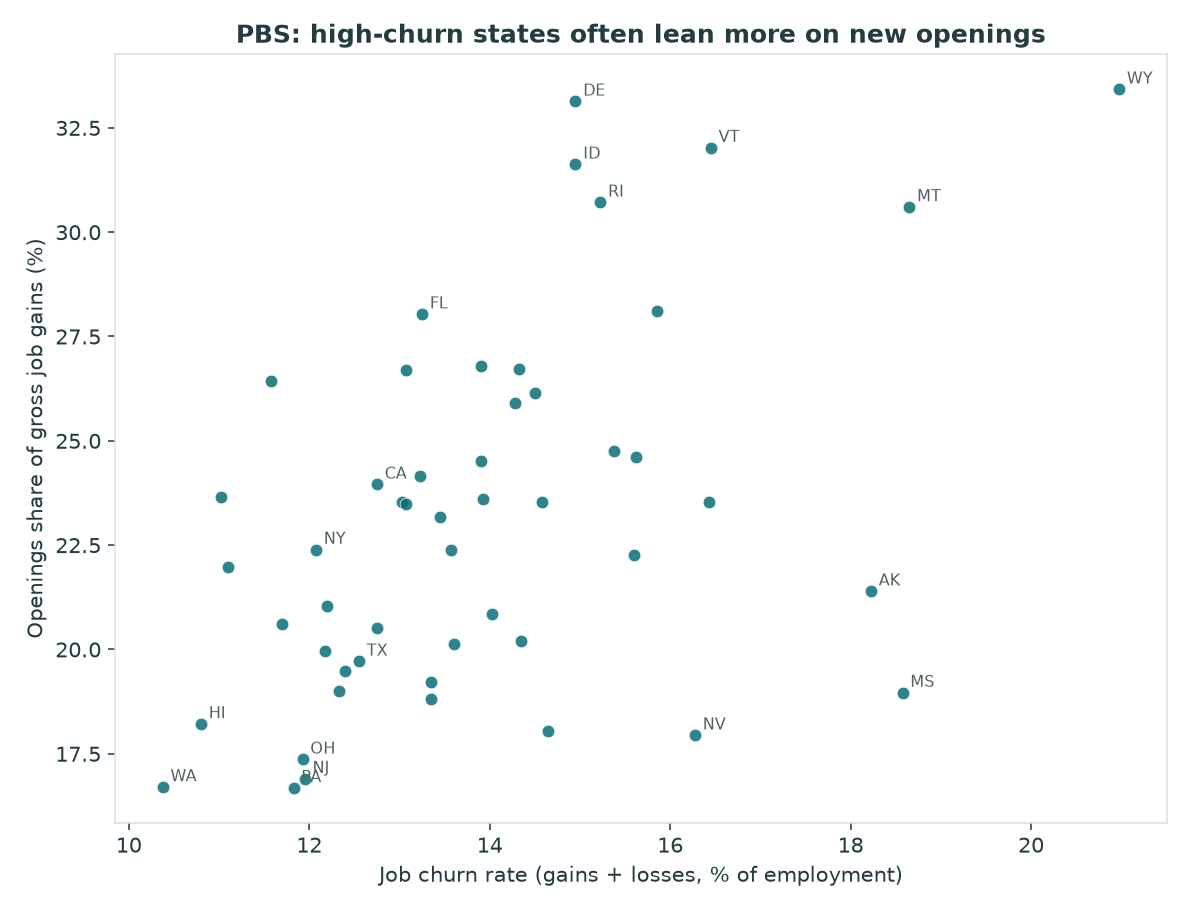
- Openings are the minority of hiring. Openings contributed about 21% of U.S. total-private gross job gains and 22% in PBS — expansions of existing establishments dominate.
- PBS state churn spans roughly 11 points. Highest: WY 21.0%, MT 18.6%, MS 18.6%. Lowest: WA 10.4%, HI 10.8%, MA 11.0% (n=51).
- Construction and leisure have extreme state tails (AK construction churn 31.6%; AK leisure/hospitality 29.5%), while education & health stays comparatively compressed (PA 6.7% to ID 11.9%).
- Churn cooled slightly vs 2024. U.S. total-private churn 11.57% → 11.35%; PBS 13.00% → 12.88%. Among states+DC, PBS churn fell in 35 jurisdictions and rose in 16.
Not a best-state score. High churn often marks seasonal markets or fast turnover — the same pattern our business survival rates by state page flags when fast-formation states sit mid-table on cohort survival. Pair churn with net rates and survival; do not treat either alone as “opportunity.”
U.S. sector comparison (2025)
Rates are percent of employment (job measures) or percent of establishments (establishment openings/closings), seasonally adjusted, averaged across 2025’s four quarters.
| Sector | Job gains | Job losses | Churn | Net | Openings share of gains | Est. openings | Est. closings |
|---|---|---|---|---|---|---|---|
| Leisure and hospitality | 8.05% | 8.22% | 16.27% | -0.17% | 22.7% | 4.38% | 4.35% |
| Construction | 8.03% | 7.95% | 15.98% | +0.08% | 19.8% | 6.35% | 6.53% |
| Other services (except public administration) | 6.72% | 6.78% | 13.50% | -0.05% | 23.7% | 4.28% | 4.35% |
| Professional and business services | 6.40% | 6.47% | 12.88% | -0.07% | 22.1% | 7.05% | 7.20% |
| Total private | 5.70% | 5.65% | 11.35% | +0.05% | 20.9% | 5.70% | 5.35% |
| Education and health services | 4.55% | 4.03% | 8.57% | +0.52% | 20.5% | 5.72% | 4.80% |
Charts
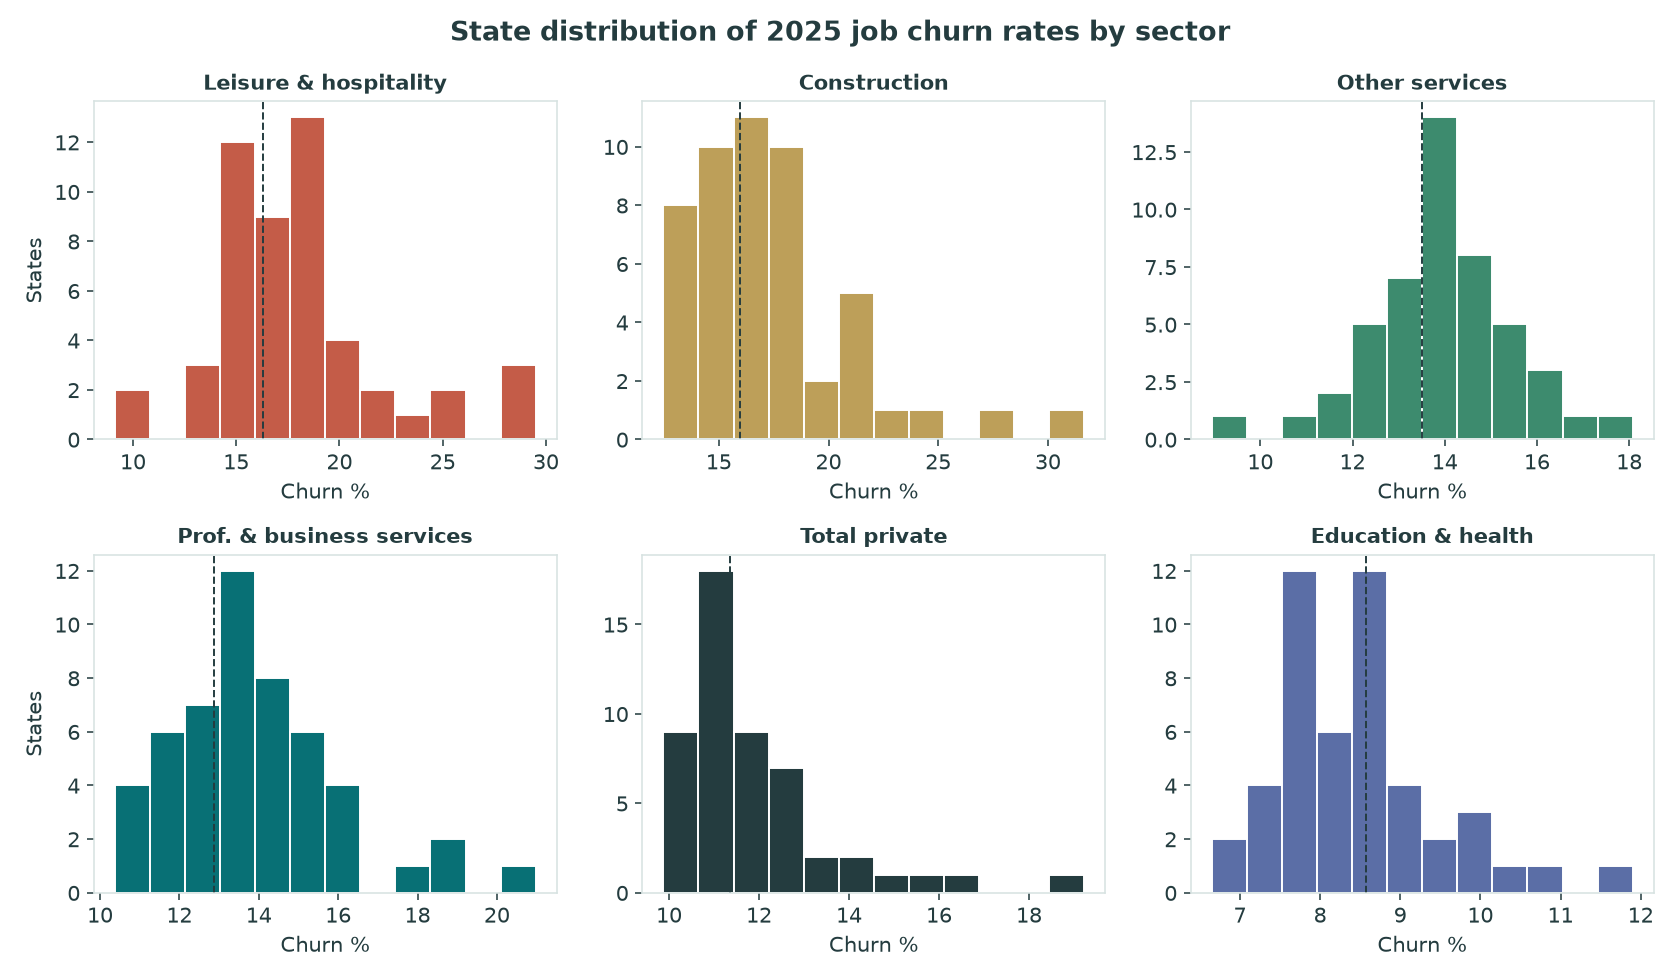
Professional & business services by state
PBS is the strongest BED sector match for many site industries (administrative & support lives here at this grain). Coverage: 51/51 jurisdictions. Filter or sort the table; download the CSV for construction, edu/health, leisure/hospitality, and other services rows.
| State | Job gains | Job losses | Churn | Net | Openings (emp) | Expansions (emp) | Openings share | Est. openings | Est. closings |
|---|---|---|---|---|---|---|---|---|---|
| Wyoming | 10.5% | 10.5% | 21.0% | -0.0% | 3.5% | 7.0% | 33.4% | 8.3% | 8.3% |
| Montana | 9.5% | 9.1% | 18.6% | +0.4% | 2.9% | 6.6% | 30.6% | 8.4% | 8.5% |
| Mississippi | 9.7% | 8.9% | 18.6% | +0.8% | 1.8% | 7.9% | 19.0% | 6.9% | 7.0% |
| Alaska | 8.8% | 9.4% | 18.2% | -0.7% | 1.9% | 6.9% | 21.4% | 6.2% | 7.5% |
| Vermont | 7.6% | 8.8% | 16.4% | -1.2% | 2.4% | 5.2% | 32.0% | 6.3% | 8.1% |
| North Dakota | 8.2% | 8.2% | 16.4% | +0.0% | 1.9% | 6.3% | 23.5% | 7.3% | 7.5% |
| Nevada | 8.5% | 7.8% | 16.3% | +0.7% | 1.6% | 7.0% | 17.9% | 5.2% | 6.6% |
| Utah | 8.3% | 7.6% | 15.8% | +0.7% | 2.3% | 6.0% | 28.1% | 9.8% | 8.9% |
| West Virginia | 7.7% | 8.0% | 15.6% | -0.3% | 1.9% | 5.8% | 24.6% | 6.5% | 8.2% |
| South Carolina | 7.7% | 7.9% | 15.6% | -0.2% | 1.7% | 6.0% | 22.3% | 6.9% | 7.1% |
| South Dakota | 7.7% | 7.7% | 15.4% | +0.0% | 1.9% | 5.8% | 24.8% | 7.0% | 6.6% |
| Rhode Island | 7.5% | 7.7% | 15.2% | -0.2% | 2.3% | 5.2% | 30.7% | 8.7% | 9.1% |
| Delaware | 7.5% | 7.5% | 14.9% | -0.1% | 2.5% | 5.0% | 33.1% | 8.3% | 7.6% |
| Idaho | 7.7% | 7.3% | 14.9% | +0.3% | 2.4% | 5.2% | 31.6% | 9.5% | 8.5% |
| Indiana | 7.4% | 7.2% | 14.7% | +0.1% | 1.4% | 6.0% | 18.1% | 6.8% | 7.0% |
| Louisiana | 7.0% | 7.5% | 14.6% | -0.5% | 1.7% | 5.3% | 23.5% | 7.0% | 6.7% |
| Kansas | 7.1% | 7.4% | 14.5% | -0.3% | 1.9% | 5.2% | 26.1% | 7.7% | 7.8% |
| Kentucky | 7.4% | 7.0% | 14.3% | +0.5% | 1.5% | 5.9% | 20.2% | 6.5% | 6.3% |
| New Hampshire | 7.1% | 7.2% | 14.3% | -0.2% | 1.9% | 5.2% | 26.7% | 7.0% | 7.3% |
| Oklahoma | 7.0% | 7.3% | 14.3% | -0.3% | 1.8% | 5.2% | 25.9% | 6.9% | 7.2% |
| Maine | 6.5% | 7.5% | 14.0% | -1.1% | 1.4% | 5.1% | 20.8% | 4.3% | 7.5% |
| Arkansas | 7.2% | 6.8% | 13.9% | +0.4% | 1.7% | 5.5% | 23.6% | 8.4% | 7.7% |
| Colorado | 6.7% | 7.2% | 13.9% | -0.5% | 1.8% | 4.9% | 26.8% | 7.1% | 8.5% |
| Iowa | 6.9% | 7.0% | 13.9% | -0.1% | 1.7% | 5.2% | 24.5% | 6.7% | 6.9% |
| Alabama | 6.8% | 6.8% | 13.6% | -0.1% | 1.4% | 5.4% | 20.1% | 6.7% | 5.3% |
| North Carolina | 6.8% | 6.8% | 13.6% | -0.1% | 1.5% | 5.2% | 22.4% | 7.3% | 7.2% |
| Georgia | 6.6% | 6.8% | 13.4% | -0.2% | 1.6% | 5.1% | 23.2% | 7.6% | 8.5% |
| Arizona | 6.5% | 6.9% | 13.3% | -0.5% | 1.2% | 5.2% | 18.8% | 5.9% | 8.3% |
| Tennessee | 6.6% | 6.8% | 13.3% | -0.1% | 1.3% | 5.3% | 19.2% | 5.9% | 6.4% |
| Florida | 6.6% | 6.6% | 13.2% | +0.0% | 1.9% | 4.8% | 28.0% | 7.5% | 7.5% |
| Maryland | 6.2% | 7.0% | 13.2% | -0.7% | 1.5% | 4.7% | 24.1% | 7.3% | 7.9% |
| Connecticut | 6.4% | 6.7% | 13.1% | -0.3% | 1.7% | 4.7% | 26.7% | 7.4% | 7.9% |
| Nebraska | 6.3% | 6.7% | 13.1% | -0.4% | 1.5% | 4.8% | 23.5% | 7.6% | 7.0% |
| Missouri | 6.4% | 6.7% | 13.0% | -0.3% | 1.5% | 4.9% | 23.5% | 7.3% | 7.2% |
| California | 6.4% | 6.3% | 12.8% | +0.1% | 1.5% | 4.9% | 23.9% | 8.0% | 7.6% |
| Oregon | 5.9% | 6.8% | 12.8% | -0.9% | 1.2% | 4.7% | 20.5% | 5.2% | 7.7% |
| Texas | 6.3% | 6.2% | 12.6% | +0.1% | 1.2% | 5.0% | 19.7% | 7.4% | 7.3% |
| Michigan | 6.1% | 6.3% | 12.4% | -0.2% | 1.2% | 4.9% | 19.5% | 7.3% | 7.1% |
| Illinois | 6.2% | 6.1% | 12.3% | +0.1% | 1.2% | 5.0% | 19.0% | 8.2% | 8.0% |
| Wisconsin | 6.2% | 6.0% | 12.2% | +0.2% | 1.3% | 4.9% | 21.0% | 7.0% | 6.7% |
| New Mexico | 5.8% | 6.4% | 12.2% | -0.6% | 1.1% | 4.7% | 19.9% | 6.7% | 7.6% |
| New York | 5.8% | 6.2% | 12.1% | -0.4% | 1.3% | 4.5% | 22.4% | 5.9% | 7.5% |
| New Jersey | 5.9% | 6.0% | 11.9% | -0.1% | 1.0% | 5.0% | 16.9% | 4.6% | 5.2% |
| Ohio | 5.9% | 6.0% | 11.9% | -0.1% | 1.1% | 4.9% | 17.4% | 6.9% | 6.9% |
| Pennsylvania | 5.8% | 6.0% | 11.8% | -0.2% | 1.0% | 4.8% | 16.7% | 5.7% | 6.2% |
| Minnesota | 5.7% | 6.0% | 11.7% | -0.3% | 1.1% | 4.5% | 20.6% | 7.2% | 7.8% |
| District of Columbia | 5.3% | 6.3% | 11.6% | -1.0% | 1.4% | 3.9% | 26.4% | 8.3% | 8.1% |
| Virginia | 5.4% | 5.7% | 11.1% | -0.3% | 1.2% | 4.2% | 22.0% | 7.0% | 7.0% |
| Massachusetts | 5.2% | 5.8% | 11.0% | -0.5% | 1.2% | 4.0% | 23.6% | 7.6% | 7.7% |
| Hawaii | 5.3% | 5.5% | 10.8% | -0.1% | 1.0% | 4.4% | 18.2% | 4.5% | 5.7% |
| Washington | 5.4% | 5.0% | 10.4% | +0.5% | 0.9% | 4.5% | 16.7% | 5.3% | 1.3% |
Job churn cross-walk by state
Same 2025 churn definition across sectors. Em dashes are unpublished/suppressed cells — not zeros. Sorted by PBS churn.
| State | PBS | Construction | Edu/health | Leisure/hosp | Other svc | Total private |
|---|---|---|---|---|---|---|
| Wyoming | 21.0% | 23.9% | — | 25.9% | — | 16.8% |
| Montana | 18.6% | 22.2% | 9.1% | 23.7% | 15.5% | 15.6% |
| Mississippi | 18.6% | 17.6% | 9.1% | 16.2% | 16.0% | 12.3% |
| Alaska | 18.2% | 31.6% | 7.9% | 29.5% | 18.1% | 19.2% |
| Vermont | 16.4% | 18.2% | 8.3% | 29.1% | — | 14.1% |
| North Dakota | 16.4% | 28.2% | — | 18.6% | — | 13.1% |
| Nevada | 16.3% | 17.4% | 9.1% | 9.7% | 13.8% | 11.9% |
| Utah | 15.8% | 16.4% | 9.8% | 19.1% | 14.8% | 12.9% |
| West Virginia | 15.6% | 21.1% | 7.8% | 17.4% | 16.3% | 11.9% |
| South Carolina | 15.6% | 13.9% | 9.8% | 17.2% | 15.1% | 12.2% |
| South Dakota | 15.4% | 20.9% | — | 21.5% | 13.8% | 12.1% |
| Rhode Island | 15.2% | 20.6% | 7.7% | 22.1% | 15.8% | 12.8% |
| Delaware | 14.9% | 13.1% | 7.9% | 19.1% | 15.4% | 11.4% |
| Idaho | 14.9% | 21.5% | 11.9% | 20.5% | 16.6% | 14.6% |
| Indiana | 14.7% | 14.9% | 8.5% | 16.8% | 12.8% | 10.5% |
| Louisiana | 14.6% | 18.7% | 8.1% | 15.9% | 13.0% | 11.7% |
| Kansas | 14.5% | 17.3% | 8.7% | 17.3% | 16.4% | 11.3% |
| Kentucky | 14.3% | 15.5% | 8.0% | 15.0% | 14.1% | 10.4% |
| New Hampshire | 14.3% | 16.7% | 7.6% | 25.5% | 14.7% | 12.5% |
| Oklahoma | 14.3% | 15.7% | 8.7% | 15.8% | 14.3% | 11.6% |
| Maine | 14.0% | 17.9% | 8.1% | 29.0% | 14.3% | 13.8% |
| Arkansas | 13.9% | 15.3% | 7.5% | 15.2% | 15.2% | 10.6% |
| Colorado | 13.9% | 15.2% | 10.6% | 19.0% | 14.4% | 13.0% |
| Iowa | 13.9% | 19.7% | 8.9% | 19.3% | 13.7% | 11.3% |
| Alabama | 13.6% | 15.3% | 10.1% | 15.9% | 13.8% | 11.1% |
| North Carolina | 13.6% | 13.0% | 8.8% | 16.2% | 14.8% | 11.0% |
| Georgia | 13.4% | 13.6% | 8.4% | 15.7% | 14.9% | 11.3% |
| Arizona | 13.3% | 14.8% | 8.1% | 14.5% | 13.0% | 11.3% |
| Tennessee | 13.3% | 14.6% | 8.8% | 15.5% | 12.8% | 10.9% |
| Florida | 13.2% | 15.2% | 8.8% | 14.1% | 14.1% | 11.6% |
| Maryland | 13.2% | 12.5% | 8.8% | 18.1% | 12.9% | 11.8% |
| Connecticut | 13.1% | 17.6% | 7.9% | 20.6% | 13.6% | 11.2% |
| Nebraska | 13.1% | 16.6% | 7.8% | 18.4% | 12.7% | 10.9% |
| Missouri | 13.0% | 15.6% | 9.6% | 17.9% | 14.2% | 11.3% |
| California | 12.8% | 17.1% | 10.9% | 14.1% | 13.9% | 12.7% |
| Oregon | 12.8% | 18.0% | 8.4% | 15.5% | 13.1% | 12.3% |
| Texas | 12.6% | 13.6% | 8.3% | 13.6% | 13.1% | 10.5% |
| Michigan | 12.4% | 16.8% | 7.1% | 18.4% | 13.6% | 10.9% |
| Illinois | 12.3% | 18.9% | 7.2% | 15.8% | 11.8% | 10.2% |
| Wisconsin | 12.2% | 15.7% | 7.9% | 20.2% | 13.0% | 10.5% |
| New Mexico | 12.2% | 18.3% | 8.5% | 14.8% | 14.0% | 11.9% |
| New York | 12.1% | 18.7% | 8.7% | 18.1% | 13.7% | 11.8% |
| New Jersey | 11.9% | 16.1% | 7.7% | 18.1% | 13.9% | 11.1% |
| Ohio | 11.9% | 16.1% | 7.6% | 17.4% | 12.7% | 10.4% |
| Pennsylvania | 11.8% | 14.7% | 6.7% | 18.2% | 12.0% | 9.9% |
| Minnesota | 11.7% | 21.4% | 7.7% | 19.2% | 14.6% | 11.0% |
| District of Columbia | 11.6% | — | 7.3% | 14.9% | 8.9% | 10.7% |
| Virginia | 11.1% | 12.7% | 9.6% | 16.2% | 13.0% | 11.3% |
| Massachusetts | 11.0% | 16.2% | 7.7% | 20.0% | 14.0% | 10.9% |
| Hawaii | 10.8% | 13.7% | 8.4% | 9.1% | 10.8% | 9.9% |
| Washington | 10.4% | 16.1% | 7.2% | 15.6% | 12.1% | 11.1% |
Coverage counts: construction 50/51 · PBS 51/51 · edu/health 48/51 · leisure/hosp 51/51 · other services 48/51 · total private 51/51.
Related research
- Business survival rates by state — cohort survival (still reporting employment at 1–30 years), not quarterly flows.
- Business formation statistics — Census BFS applications and formations.
- How big are service businesses? — employer size brackets.
- Service businesses without employees — nonemployers outside the BED payroll frame.
- Cleaning industry statistics and daycare industry statistics — niche market context (BED cannot isolate these NAICS alone).
- SBA loan statistics — approvals and charge-offs.
- Practical guides: start a cleaning service, start a daycare, start an HVAC business, start a landscaping business.
Methods & limits
Source: BLS Business Employment Dynamics via the public API (BD survey), pulled 2026-09-16 with observations through 2025 Q4. Series are seasonally adjusted. Job rates are percent of employment; establishment openings/closings rates are percent of establishments. Primary figures average Q1–Q4 2025 quarterly rates. Churn = gains rate + losses rate. Openings share of gains uses employment levels (openings ÷ gross job gains) when published.
Grain: state × BED sector/supersector (codes such as construction 100020, professional & business services 200070). Not 6-digit NAICS — janitorial, landscaping, HVAC, and daycare cannot be isolated here. Births are a subset of openings; deaths lag and revise; births/deaths are incomplete at state×sector in this API pull, so the page emphasizes openings/closings/gains/losses. Establishments ≠ companies. Suppressions are omitted, never treated as zero. Full notes: study folder METHODS.md.
Frequently asked
Is high churn bad?
Not by itself. Seasonal and fast-turnover sectors (leisure/hospitality, construction) show high churn even in healthy periods. Read churn with net job rates and with cohort survival rates.
Why can’t I see cleaning or daycare alone?
BLS BED’s public state industry detail stops at sector/supersector. Cleaning and landscaping employers typically fall inside professional & business services; daycare inside education & health. Inventing a 6-digit state table would not be official BED.
Openings vs births?
Openings include births plus reopenings of establishments that previously had employment. Births are the subset of brand-new establishments. Deaths are a lagged subset of closings and revise over time.
Download
Download the 2025 state × sector CSV (gains, losses, churn, openings/expansions/closings, establishment rates). Cite with a link to this page.