Fixed edition analyzed September 16, 2026. BEA Regional SARPP state regional price parities for 2022-2024 (API note: last updated February 19, 2026 — new 2024; revised 2008-2023), U.S. = 100. Paired with BLS OEWS May 2025 occupational medians (reused) and DOL Women’s Bureau NDCP center infant daycare prices (mostly 2022; Indiana and New Mexico missing). Purchasing-power / correlation check only — not a best-state ranking and not causation.
“High wage” and “expensive daycare” headlines usually quote nominal dollars. BEA regional price parities ask a different question: how do those figures look once you adjust for local price levels?
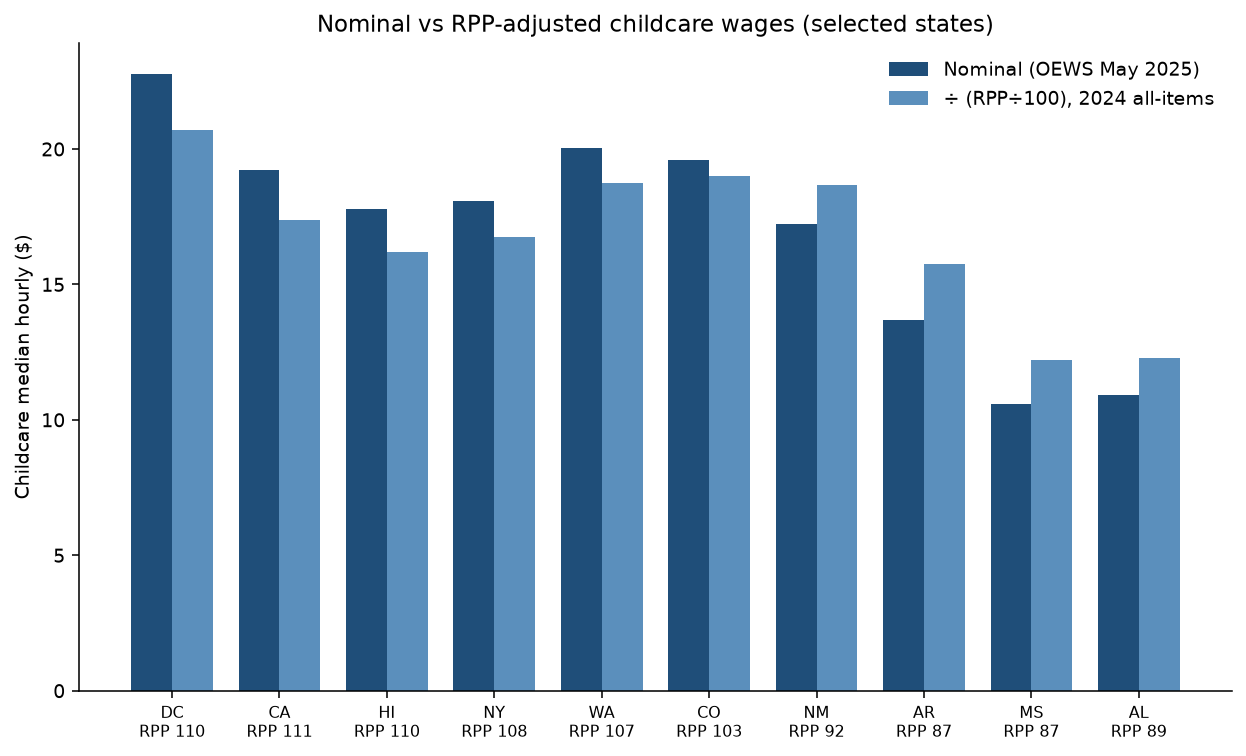
They look different — especially for wages. Across 50 states and D.C., 2024 all-items RPP correlates strongly with May 2025 childcare median hourly wages (Pearson r = 0.84, Spearman ρ = 0.85) and with NDCP center infant weekly prices (r = 0.82, ρ = 0.85, n = 49). Dividing by RPP still reshuffles wage ranks: Hawaii falls about 15 places; New Mexico and Arkansas climb about 13. Daycare price ranks barely move (nominal vs RPP-adjusted price r ≈ 0.99).
This page is deliberately different from our daycare wage vs price by state study (nominal dollars only), wages by state, and personal income vs business formation (BEA income growth × Census applications — not price levels).
What we compared
- Price levels: BEA table SARPP line 1 (all items), plus goods, rents, utilities, and other services. Primary year 2024 (U.S. = 100). RPP-adjusted value = nominal ÷ (RPP ÷ 100).
- Wages: OEWS May 2025 childcare workers (SOC 39-9011) median hourly/annual, plus an unweighted study composite of seven service occupations (labeled as such — not an official BLS average).
- Daycare prices: NDCP center-based infant weekly prices from the wage-vs-price study archive (mostly 2022).
- Year mismatch: 2024 RPP × May 2025 wages × ~2022 prices — disclosed, not interpolated.
Price levels track wages and daycare prices
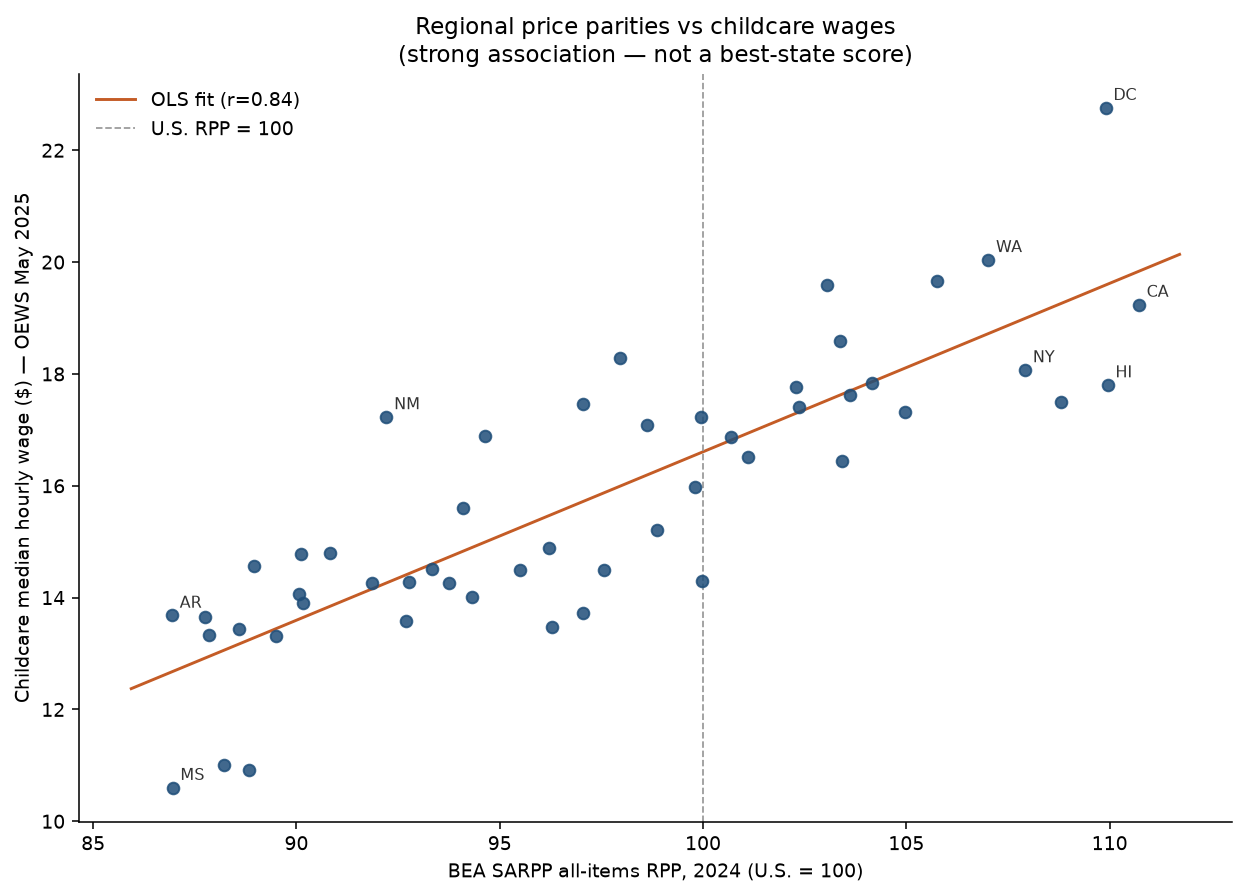
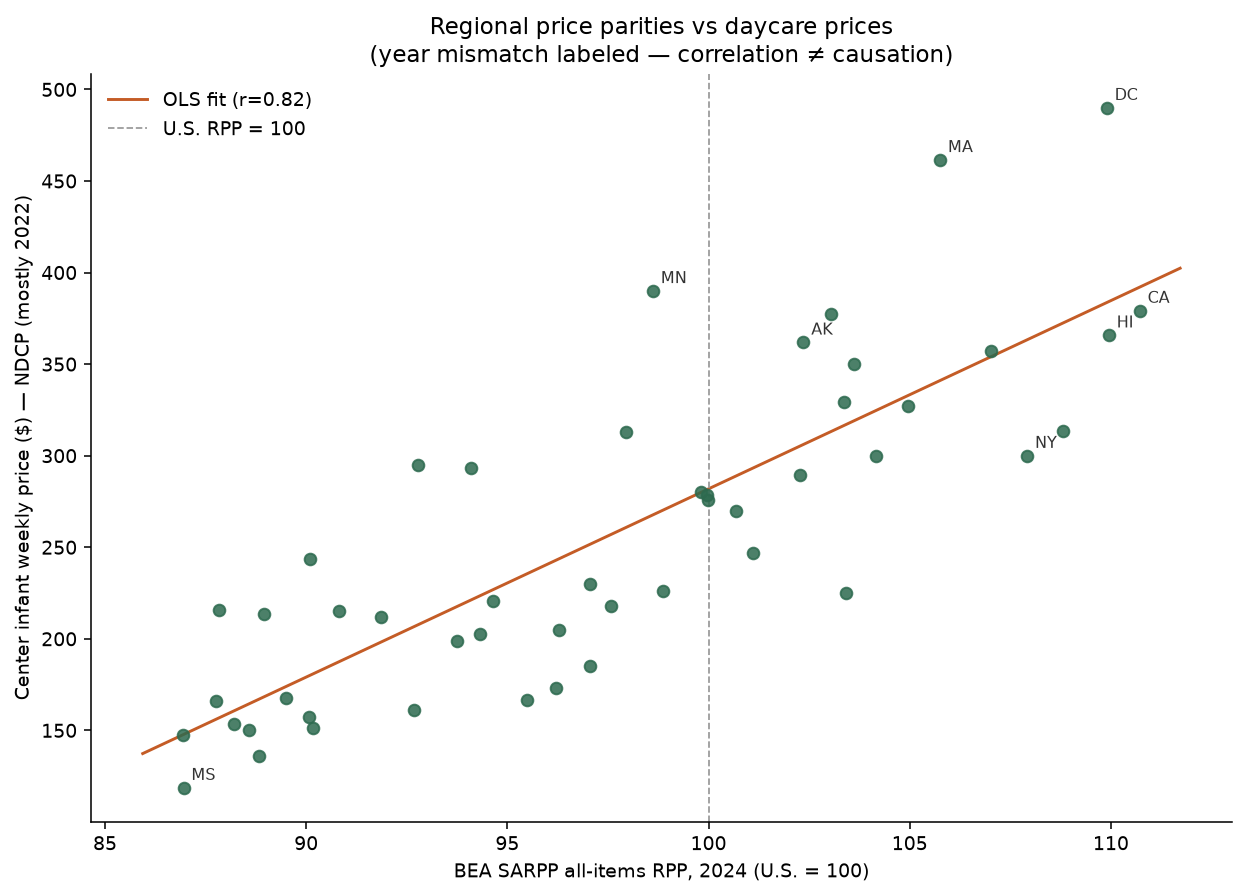
2024 all-items RPP ranges from about 86.9 (Arkansas) to 110.7 (California), median 97.0. Top five: California (110.7), Hawaii (110.0), District of Columbia (109.9), New Jersey (108.8), New York (107.9). Bottom five: Arkansas (86.9), Mississippi (87.0), Iowa (87.8), Oklahoma (87.8), Louisiana (88.2).
Where wage ranks flip after RPP
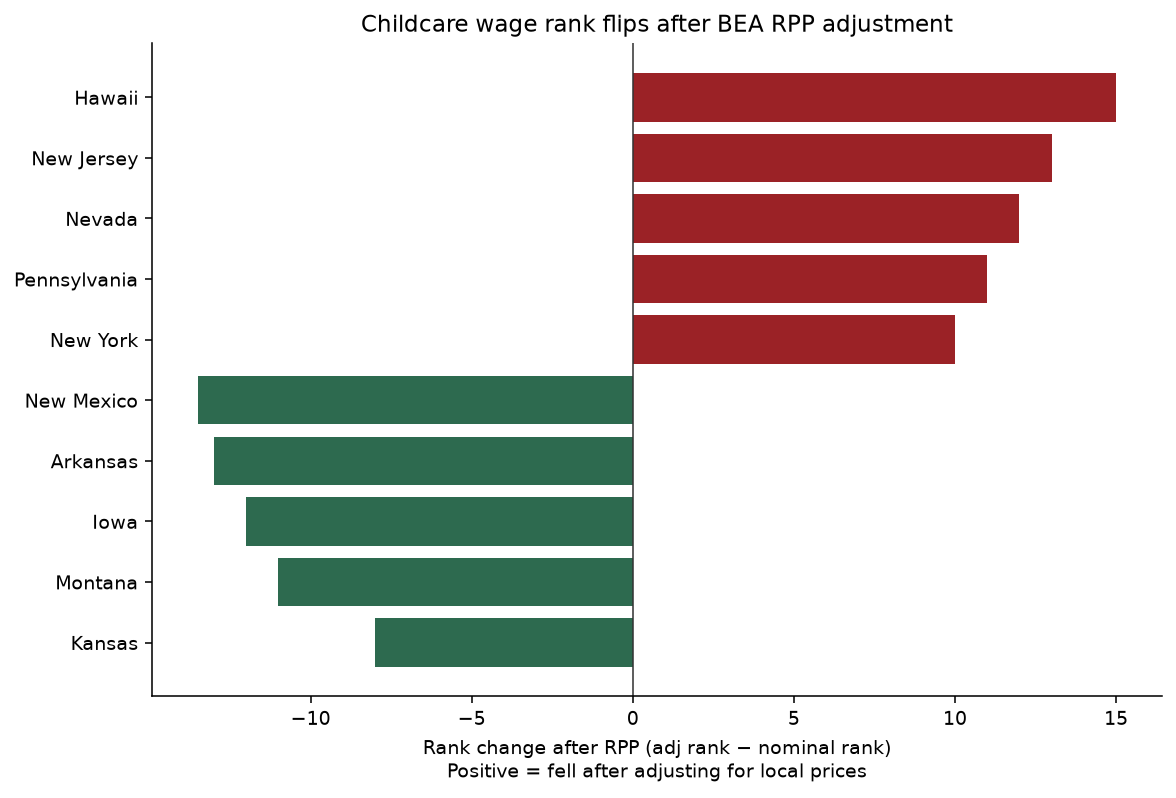
| Fell after RPP (high cost eats the wage) | RPP | Rank Δ |
|---|---|---|
| Hawaii | 110.0 | +15 |
| New Jersey | 108.8 | +13 |
| Nevada | 100.0 | +12 |
| Pennsylvania | 97.6 | +11 |
| New York | 107.9 | +10 |
| Utah | 98.9 | +10 |
| Rose after RPP (low prices lift the wage) | RPP | Rank Δ |
|---|---|---|
| New Mexico | 92.2 | -14 |
| Arkansas | 86.9 | -13 |
| Iowa | 87.8 | -12 |
| Montana | 94.6 | -11 |
| Kansas | 90.1 | -8 |
| Nebraska | 90.1 | -8 |
Example: Hawaii’s May 2025 childcare median (~$17.80/hr) ranks near the top tenth nominally, but with RPP ≈ 110 it falls roughly 15 places in RPP-adjusted terms. Arkansas (~$13.68/hr) climbs about 13 places once its RPP ≈ 87 is applied. D.C. stays #1 either way — its wage premium survives the price-level adjustment.
Daycare prices: expensive stays expensive
Nominal vs RPP-adjusted infant weekly prices still correlate at r ≈ 0.99. The largest price rank flips are only about six places (Florida and New York fall; North Dakota and Oklahoma rise). California drops out of the top-five RPP-adjusted infant prices; Alaska enters. Adjusting for overall price levels does not rewrite the expensive-daycare map the way it reshuffles wage ranks.
For the nominal wage-to-price ratio without RPP, see daycare wage vs price by state. For list prices alone, see childcare prices by state.
All 50 states and D.C.
Download the CSV: regional-price-parities-wages-daycare.csv. State names link to state hubs. Service mean is an unweighted study composite of seven OEWS occupations.
| State | RPP 2024 | CC wage $/hr | CC wage RPP-adj | Wage rank Δ | Svc mean $/hr | Svc RPP-adj | Infant $/wk | Infant RPP-adj |
|---|---|---|---|---|---|---|---|---|
| California | 110.7 | 19.24 | 17.38 | +5 | 22.35 | 20.19 | 379.2 | 342.5 |
| Hawaii | 110.0 | 17.80 | 16.19 | +15 | 21.85 | 19.88 | 365.8 | 332.7 |
| District of Columbia | 109.9 | 22.76 | 20.71 | +0 | 24.86 | 22.62 | 490.0 | 445.9 |
| New Jersey | 108.8 | 17.49 | 16.07 | +13 | 20.77 | 19.09 | 313.7 | 288.3 |
| New York | 107.9 | 18.07 | 16.74 | +10 | 21.97 | 20.36 | 300.0 | 278.0 |
| Washington | 107.0 | 20.04 | 18.73 | +1 | 24.61 | 23.00 | 357.3 | 333.9 |
| Massachusetts | 105.8 | 19.66 | 18.59 | +3 | 22.96 | 21.71 | 461.6 | 436.4 |
| Maryland | 105.0 | 17.32 | 16.50 | +4 | 20.04 | 19.10 | 327.4 | 311.9 |
| New Hampshire | 104.2 | 17.83 | 17.12 | +5 | 21.07 | 20.23 | 300.1 | 288.1 |
| Connecticut | 103.6 | 17.63 | 17.02 | +3 | 21.79 | 21.03 | 350.0 | 337.8 |
| Florida | 103.4 | 16.45 | 15.91 | +5 | 18.06 | 17.46 | 225.0 | 217.6 |
| Oregon | 103.4 | 18.58 | 17.98 | +2 | 22.27 | 21.54 | 329.4 | 318.7 |
| Colorado | 103.1 | 19.59 | 19.01 | -2 | 21.10 | 20.47 | 377.4 | 366.2 |
| Alaska | 102.4 | 17.40 | 17.00 | +1 | 21.40 | 20.90 | 361.9 | 353.6 |
| Rhode Island | 102.3 | 17.76 | 17.36 | +0 | 20.03 | 19.58 | 289.6 | 283.1 |
| Virginia | 101.1 | 16.51 | 16.33 | +1 | 19.09 | 18.88 | 246.7 | 244.0 |
| Arizona | 100.7 | 16.88 | 16.77 | -4 | 19.28 | 19.15 | 270.0 | 268.2 |
| Nevada | 100.0 | 14.30 | 14.30 | +12 | 19.68 | 19.68 | 275.6 | 275.7 |
| Illinois | 100.0 | 17.23 | 17.24 | -4 | 20.80 | 20.81 | 278.3 | 278.4 |
| Delaware | 99.8 | 15.97 | 16.00 | +3 | 18.86 | 18.89 | 280.3 | 280.8 |
| Utah | 98.9 | 15.21 | 15.38 | +10 | 18.63 | 18.84 | 226.3 | 228.9 |
| Minnesota | 98.6 | 17.08 | 17.32 | -7 | 21.52 | 21.82 | 390.0 | 395.5 |
| Vermont | 98.0 | 18.29 | 18.67 | -2 | 21.91 | 22.37 | 313.1 | 319.6 |
| Pennsylvania | 97.6 | 14.49 | 14.85 | +11 | 18.94 | 19.42 | 217.9 | 223.3 |
| Texas | 97.1 | 13.73 | 14.15 | +6 | 17.25 | 17.77 | 185.0 | 190.6 |
| Maine | 97.0 | 17.47 | 18.00 | -7 | 21.38 | 22.03 | 230.0 | 237.0 |
| Georgia | 96.3 | 13.47 | 13.99 | +3 | 17.65 | 18.33 | 205.0 | 212.9 |
| Michigan | 96.2 | 14.89 | 15.48 | +7 | 18.71 | 19.45 | 173.2 | 180.0 |
| Idaho | 95.5 | 14.50 | 15.18 | +7 | 18.59 | 19.46 | 166.4 | 174.3 |
| Montana | 94.6 | 16.89 | 17.85 | -11 | 19.93 | 21.06 | 220.8 | 233.3 |
| North Carolina | 94.3 | 14.01 | 14.85 | +4 | 18.13 | 19.22 | 202.5 | 214.7 |
| Wisconsin | 94.1 | 15.61 | 16.59 | -6 | 19.28 | 20.49 | 293.0 | 311.4 |
| South Carolina | 93.7 | 14.26 | 15.21 | +2 | 17.44 | 18.60 | 198.9 | 212.2 |
| Indiana | 93.3 | 14.51 | 15.55 | +1 | 18.17 | 19.47 | — | — |
| Ohio | 92.8 | 14.27 | 15.38 | +2 | 18.57 | 20.01 | 295.0 | 318.0 |
| Wyoming | 92.7 | 13.58 | 14.65 | +1 | 17.53 | 18.91 | 161.2 | 173.9 |
| New Mexico | 92.2 | 17.23 | 18.69 | -14 | 18.06 | 19.59 | — | — |
| Tennessee | 91.9 | 14.26 | 15.52 | -4 | 17.46 | 19.00 | 211.7 | 230.4 |
| Missouri | 90.8 | 14.80 | 16.30 | -4 | 18.30 | 20.16 | 214.9 | 236.7 |
| Kentucky | 90.2 | 13.90 | 15.42 | -5 | 17.30 | 19.19 | 151.3 | 167.8 |
| Nebraska | 90.1 | 14.78 | 16.40 | -8 | 18.62 | 20.67 | 243.8 | 270.5 |
| Kansas | 90.1 | 14.06 | 15.61 | -8 | 17.82 | 19.79 | 157.3 | 174.7 |
| West Virginia | 89.5 | 13.32 | 14.88 | -6 | 15.93 | 17.80 | 167.5 | 187.1 |
| North Dakota | 89.0 | 14.56 | 16.37 | -8 | 19.90 | 22.37 | 213.8 | 240.3 |
| Alabama | 88.8 | 10.92 | 12.29 | +0 | 15.53 | 17.49 | 136.0 | 153.1 |
| South Dakota | 88.6 | 13.43 | 15.16 | -5 | 18.97 | 21.41 | 150.0 | 169.3 |
| Louisiana | 88.2 | 11.01 | 12.48 | +0 | 15.59 | 17.68 | 153.3 | 173.8 |
| Oklahoma | 87.8 | 13.33 | 15.17 | -7 | 16.63 | 18.93 | 215.5 | 245.3 |
| Iowa | 87.8 | 13.66 | 15.56 | -12 | 18.36 | 20.93 | 166.0 | 189.1 |
| Mississippi | 87.0 | 10.60 | 12.19 | +0 | 14.64 | 16.84 | 118.7 | 136.5 |
| Arkansas | 86.9 | 13.68 | 15.74 | -13 | 15.73 | 18.10 | 147.5 | 169.7 |
What this can and cannot tell you
- Correlation is not cause. High RPP, high wages, and high daycare prices often travel with housing costs and labor markets.
- RPP is a price level, not inflation. U.S. = 100. Dividing by RPP is a purchasing-power lens, not after-tax take-home pay.
- Years do not line up perfectly. 2024 RPP, May 2025 wages, mostly-2022 daycare prices — labeled in every table and the CSV.
- Childcare wages ≠ owner income. And NDCP parent prices ≠ provider profit.
- Sibling affordability lenses: service wages vs fair market rent; BEA income growth in personal income vs business formation.
Industry context: daycare industry statistics and childcare availability by state.
Methods (short)
BEA API Regional / SARPP lines 1–5 for 2022–2024; primary all-items 2024. RPP-adjusted = nominal ÷ (RPP÷100). OEWS May 2025 medians reused from prior SBL wage work; NDCP center infant weekly prices reused from the daycare wage-vs-price study (IN/NM missing). Rank Δ = RPP-adjusted rank − nominal rank (1 = highest). Full documentation in the study work folder.
Sources
| Data | Source | Vintage |
|---|---|---|
| State regional price parities | BEA Regional SARPP (API) | 2022–2024; API note Feb 19, 2026 |
| Occupational median wages | BLS OEWS | May 2025 (reused archive) |
| Center infant daycare prices | DOL Women’s Bureau NDCP | Mostly 2022; IN/NM missing (reused) |