FHFA National Mortgage Database through Q2 2026 · Freddie Mac rate survey through Oct. 1, 2026 · Updated by StartBusinessByState
Short answer: Homeowners who bought or refinanced in 2020 and 2021 locked in rates under 4%. Selling usually means giving up that rate and taking a new loan at today’s rates, so many don’t sell. Fewer listings means fewer sales for agents, stagers, movers and inspectors. The effect is strongest in California, where 60.1% of mortgages are under 4%, and weakest in Oklahoma (38.7%).
Key facts for reporters
- 51.4 million mortgages were outstanding in Q2 2026. 19.2% had a rate below 3% and 29.9% were at 3% to 3.99% (FHFA NMDB).
- Highest share under 4%: California (60.1%), Utah (58.0%), Hawaii (57.3%), Washington (57.0%). Lowest: Oklahoma (38.7%), West Virginia (38.8%), Mississippi (40.4%), Arkansas (41.6%).
- Highest share at 6% or more: Mississippi (29.4%), Oklahoma (28.8%), Arkansas (28.4%), West Virginia (27.8%). Lowest: Hawaii (15.1%), California (15.7%), Massachusetts (17.8%).
- The average rate on all outstanding U.S. mortgages is 4.4%, against 7.28% for a new 30-year fixed loan (Oct. 1, 2026, Freddie Mac). A year earlier the new-loan rate was 6.34%. The 2026 low was 5.98% on Feb. 26, 2026.
- In every state the share of mortgages under 4% peaked in Q1 2022. Over the past year it fell between 2.1 and 4.2 points in every state.
- Average monthly mortgage payment (principal, interest and escrow): $2,044 nationally, from $1,189 in West Virginia to $2,996 in District of Columbia.
How the low-rate share has changed
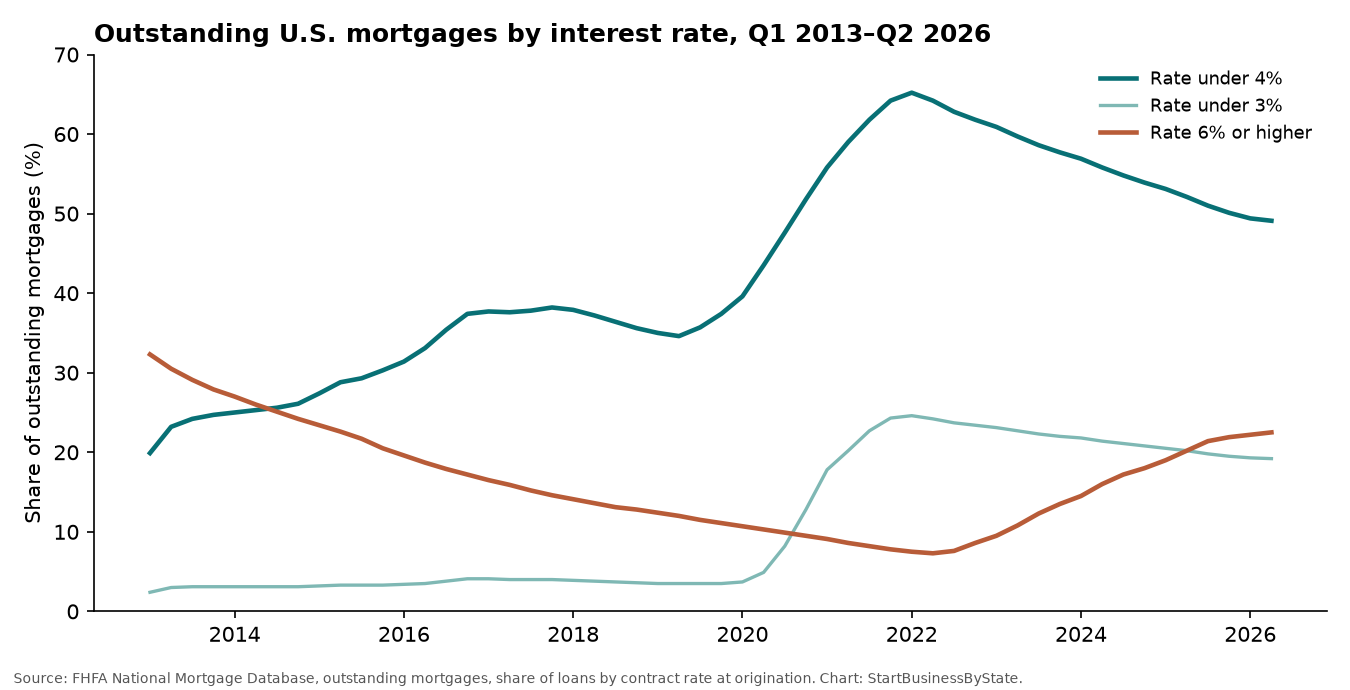
The share under 4% rose through 2020 and 2021, when new-loan rates hit record lows, and topped out in Q1 2022. Since then it has drifted down as owners sell, refinance or pay off loans, and as new loans at higher rates replace them. The pace is slow: about 3 points over the past year.
What moves mortgage rates
Thirty-year mortgage rates tend to follow the 10-year Treasury yield, which reflects inflation expectations, government borrowing and global demand for bonds. The 10-year yield averaged 5.26% in the week ending Oct. 2, 2026, up from 4.13% a year earlier (Federal Reserve data via FRED). The Federal Reserve raised its short-term policy rate by a quarter point on Sept. 16, 2026, citing elevated inflation. The Fed doesn’t set mortgage rates directly.
To see what the gap means: on a $300,000 30-year loan, principal and interest is about $1,265 a month at 3% and about $2,053 at 7.28%. That’s roughly $788 more each month before taxes and insurance.
States where the most owners have low rates
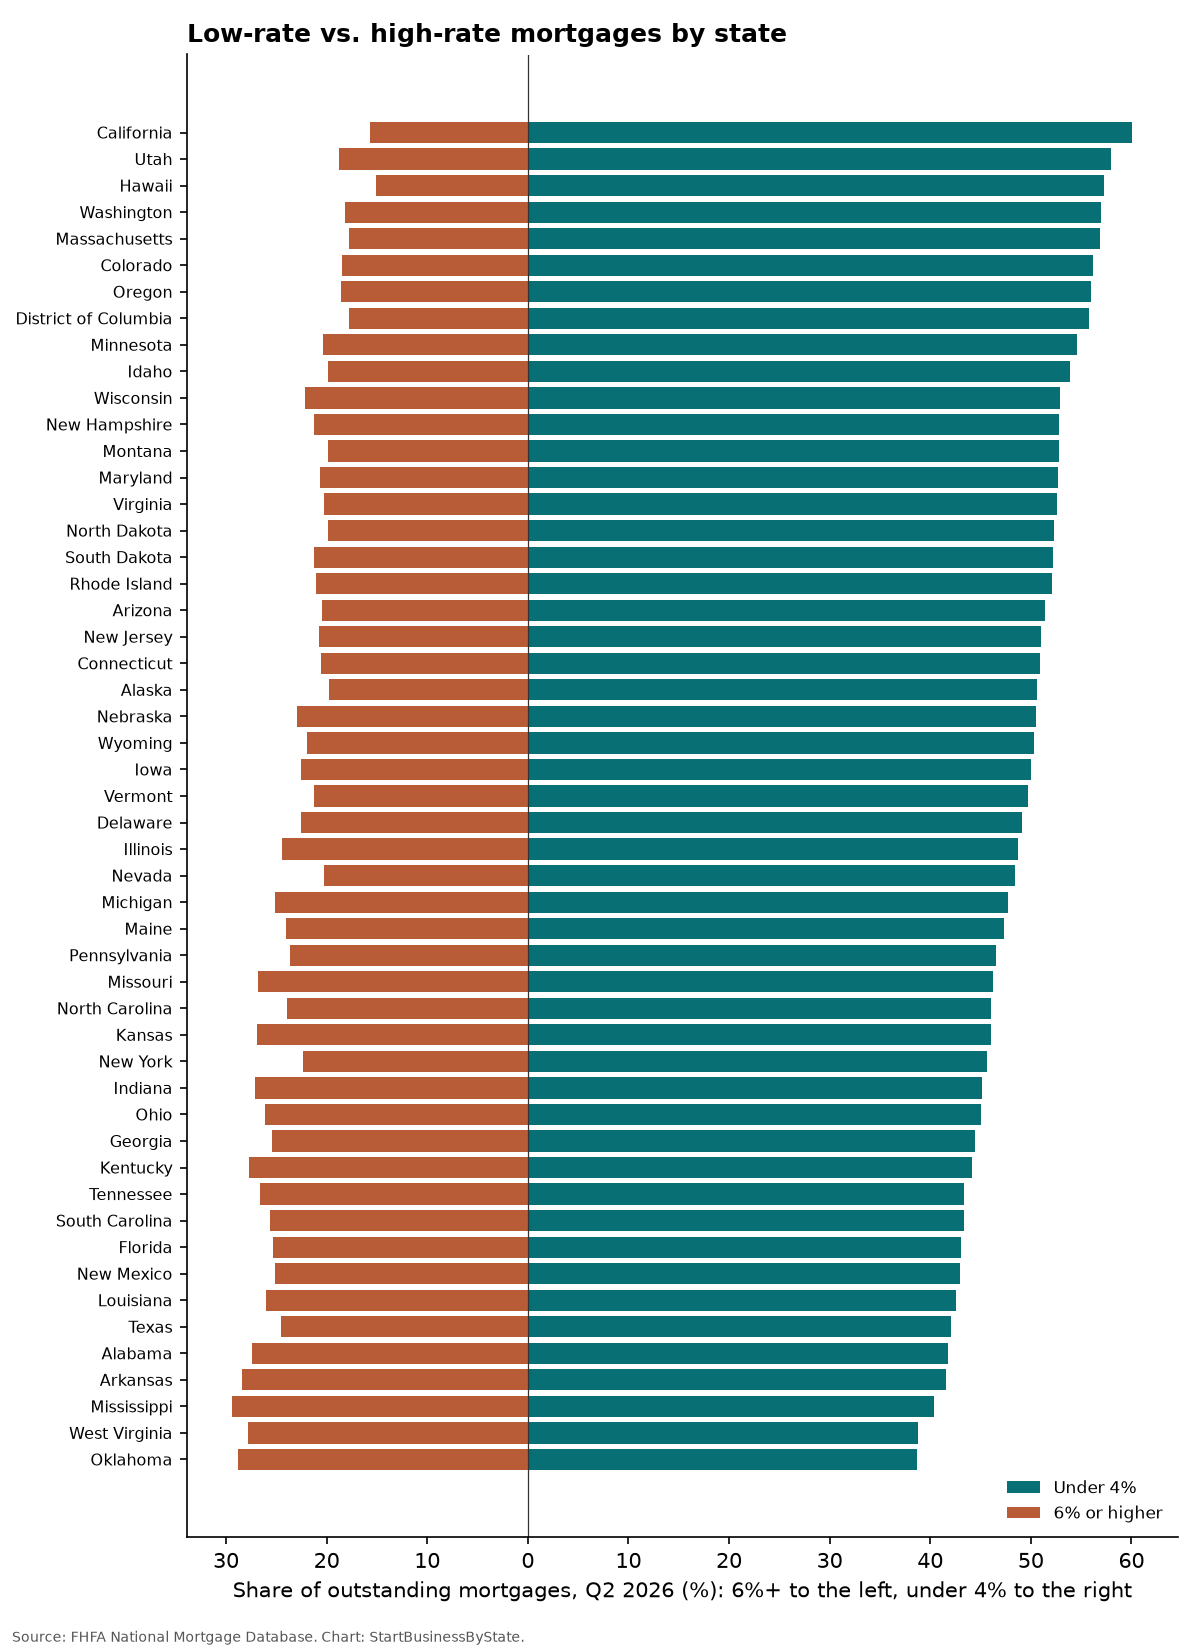
- California: 60.1% under 4% · average rate 4.0%
- Utah: 58.0% under 4% · average rate 4.1%
- Hawaii: 57.3% under 4% · average rate 4.1%
- Washington: 57.0% under 4% · average rate 4.2%
- Massachusetts: 56.9% under 4% · average rate 4.2%
- Colorado: 56.2% under 4% · average rate 4.2%
- Oregon: 56.0% under 4% · average rate 4.2%
- District of Columbia: 55.8% under 4% · average rate 4.2%
- Minnesota: 54.6% under 4% · average rate 4.3%
- Idaho: 53.9% under 4% · average rate 4.3%
Across states, a higher average mortgage payment goes with a larger low-rate share (correlation 0.67). A larger share of government-backed loans (FHA, VA and USDA) goes with more loans at 6% and up (0.65). The data shows where the lock-in is strongest. It doesn’t show how many owners would sell at a lower rate.
What it means for real estate businesses
For a new agent, market conditions also matter to personal cash planning. Use the agent startup and cash-reserve calculator to test a longer wait before commission income, then build a first-client plan for new agents with broker-supported outreach and follow-up. This study provides market context, not a forecast of your sales.
- Listing agents: where the low-rate share is high, expect fewer move-up listings. Owners with 6%+ loans may be more open to selling or refinancing if rates fall.
- Mortgage brokers and loan officers: the 6%+ column is a rough count of possible refinance candidates if rates drop.
- Contractors and remodelers: owners who stay put may renovate instead of moving. 74.1% of mortgaged homes have a loan-to-value of 60% or less, so many owners have equity to borrow against.
- Property managers: an owner who moves may keep a low-rate home as a rental instead of selling. The data doesn’t measure how often that happens.
Mortgage rates by state, Q2 2026
| State | Mortgages (thousands) | Under 3% | 3%–3.99% | Under 4% | Under 4%, change vs a year ago | 6% or higher | Avg rate | Avg monthly payment | Avg loan-to-value |
|---|---|---|---|---|---|---|---|---|---|
| U.S. total | 51,426 | 19.2% | 29.9% | 49.1% | -3.0 pts | 22.5% | 4.4% | $2,044 | 45.1% |
| Alabama | 723 | 14.9% | 26.9% | 41.8% | -3.2 pts | 27.4% | 4.7% | $1,502 | 49.7% |
| Alaska | 111 | 21.3% | 29.3% | 50.6% | -3.8 pts | 19.8% | 4.3% | $2,057 | 49.3% |
| Arizona | 1,302 | 19.8% | 31.6% | 51.4% | -3.2 pts | 20.5% | 4.3% | $1,855 | 47.6% |
| Arkansas | 409 | 15.1% | 26.5% | 41.6% | -3.6 pts | 28.4% | 4.7% | $1,450 | 48.9% |
| California | 5,663 | 27.0% | 33.1% | 60.1% | -2.2 pts | 15.7% | 4.0% | $2,701 | 40.7% |
| Colorado | 1,161 | 23.3% | 32.9% | 56.2% | -3.4 pts | 18.5% | 4.2% | $2,413 | 48.6% |
| Connecticut | 604 | 19.3% | 31.6% | 50.9% | -2.3 pts | 20.6% | 4.3% | $2,401 | 40.2% |
| Delaware | 204 | 18.7% | 30.4% | 49.1% | -2.5 pts | 22.6% | 4.4% | $1,799 | 45.3% |
| District of Columbia | 113 | 22.9% | 32.9% | 55.8% | -2.1 pts | 17.8% | 4.2% | $2,996 | 47.1% |
| Florida | 3,587 | 15.6% | 27.5% | 43.1% | -2.9 pts | 25.3% | 4.6% | $2,146 | 47.7% |
| Georgia | 1,742 | 16.6% | 27.8% | 44.4% | -3.0 pts | 25.4% | 4.6% | $1,917 | 47.3% |
| Hawaii | 186 | 26.0% | 31.3% | 57.3% | -2.4 pts | 15.1% | 4.1% | $2,764 | 39.1% |
| Idaho | 336 | 21.0% | 32.9% | 53.9% | -4.0 pts | 19.9% | 4.3% | $1,827 | 44.7% |
| Illinois | 2,005 | 19.1% | 29.6% | 48.7% | -3.0 pts | 24.4% | 4.5% | $1,891 | 44.1% |
| Indiana | 1,118 | 15.9% | 29.2% | 45.1% | -3.3 pts | 27.1% | 4.6% | $1,427 | 45.7% |
| Iowa | 512 | 21.0% | 29.0% | 50.0% | -4.0 pts | 22.6% | 4.4% | $1,499 | 46.9% |
| Kansas | 426 | 17.8% | 28.2% | 46.0% | -3.8 pts | 26.9% | 4.6% | $1,693 | 46.1% |
| Kentucky | 621 | 15.7% | 28.4% | 44.1% | -3.3 pts | 27.7% | 4.7% | $1,420 | 45.6% |
| Louisiana | 616 | 15.0% | 27.6% | 42.6% | -2.7 pts | 26.0% | 4.7% | $1,592 | 53.3% |
| Maine | 241 | 17.3% | 30.0% | 47.3% | -2.7 pts | 24.0% | 4.5% | $1,671 | 39.0% |
| Maryland | 1,171 | 21.9% | 30.8% | 52.7% | -2.5 pts | 20.7% | 4.3% | $2,286 | 48.9% |
| Massachusetts | 1,168 | 23.0% | 33.9% | 56.9% | -2.6 pts | 17.8% | 4.2% | $2,633 | 38.9% |
| Michigan | 1,641 | 17.5% | 30.2% | 47.7% | -3.1 pts | 25.1% | 4.5% | $1,502 | 42.6% |
| Minnesota | 1,026 | 21.4% | 33.2% | 54.6% | -3.4 pts | 20.4% | 4.3% | $1,918 | 46.4% |
| Mississippi | 340 | 13.4% | 27.0% | 40.4% | -2.7 pts | 29.4% | 4.8% | $1,442 | 50.6% |
| Missouri | 972 | 17.1% | 29.1% | 46.2% | -3.7 pts | 26.8% | 4.6% | $1,586 | 46.3% |
| Montana | 169 | 19.5% | 33.3% | 52.8% | -3.9 pts | 19.9% | 4.3% | $1,911 | 41.4% |
| Nebraska | 300 | 20.2% | 30.3% | 50.5% | -3.9 pts | 22.9% | 4.4% | $1,736 | 45.4% |
| Nevada | 543 | 18.7% | 29.7% | 48.4% | -2.8 pts | 20.3% | 4.4% | $1,981 | 47.9% |
| New Hampshire | 239 | 20.6% | 32.2% | 52.8% | -2.7 pts | 21.3% | 4.3% | $2,204 | 38.9% |
| New Jersey | 1,402 | 21.3% | 29.7% | 51.0% | -2.3 pts | 20.8% | 4.3% | $2,744 | 39.3% |
| New Mexico | 304 | 14.2% | 28.8% | 43.0% | -3.2 pts | 25.1% | 4.6% | $1,557 | 46.1% |
| New York | 2,224 | 15.4% | 30.2% | 45.6% | -2.3 pts | 22.4% | 4.5% | $2,562 | 38.4% |
| North Carolina | 1,823 | 17.6% | 28.4% | 46.0% | -3.3 pts | 23.9% | 4.5% | $1,779 | 45.6% |
| North Dakota | 111 | 24.5% | 27.8% | 52.3% | -4.2 pts | 19.9% | 4.3% | $1,638 | 49.0% |
| Ohio | 1,783 | 16.2% | 28.8% | 45.0% | -3.1 pts | 26.1% | 4.6% | $1,502 | 44.2% |
| Oklahoma | 523 | 12.7% | 26.0% | 38.7% | -3.3 pts | 28.8% | 4.8% | $1,567 | 50.1% |
| Oregon | 701 | 21.0% | 35.0% | 56.0% | -3.2 pts | 18.6% | 4.2% | $2,111 | 46.1% |
| Pennsylvania | 1,905 | 17.0% | 29.5% | 46.5% | -2.6 pts | 23.6% | 4.5% | $1,704 | 43.2% |
| Rhode Island | 179 | 18.9% | 33.2% | 52.1% | -2.7 pts | 21.1% | 4.3% | $2,171 | 40.7% |
| South Carolina | 917 | 15.8% | 27.6% | 43.4% | -3.5 pts | 25.6% | 4.6% | $1,666 | 46.3% |
| South Dakota | 128 | 24.3% | 27.9% | 52.2% | -3.7 pts | 21.3% | 4.3% | $1,743 | 45.5% |
| Tennessee | 1,071 | 16.5% | 26.9% | 43.4% | -3.4 pts | 26.6% | 4.6% | $1,735 | 46.7% |
| Texas | 4,196 | 15.9% | 26.2% | 42.1% | -3.3 pts | 24.5% | 4.6% | $2,067 | 51.1% |
| Utah | 600 | 25.3% | 32.7% | 58.0% | -3.4 pts | 18.8% | 4.1% | $2,135 | 46.3% |
| Vermont | 103 | 18.9% | 30.8% | 49.7% | -2.3 pts | 21.3% | 4.4% | $1,717 | 37.8% |
| Virginia | 1,587 | 22.6% | 30.0% | 52.6% | -3.1 pts | 20.3% | 4.3% | $2,168 | 46.1% |
| Washington | 1,323 | 23.3% | 33.7% | 57.0% | -3.0 pts | 18.2% | 4.2% | $2,559 | 44.7% |
| West Virginia | 224 | 12.8% | 26.0% | 38.8% | -2.8 pts | 27.8% | 4.8% | $1,189 | 46.7% |
| Wisconsin | 974 | 21.5% | 31.4% | 52.9% | -3.9 pts | 22.2% | 4.3% | $1,558 | 40.3% |
| Wyoming | 95 | 20.9% | 29.4% | 50.3% | -4.0 pts | 22.0% | 4.4% | $1,728 | 47.4% |
Shares are of the number of first-lien mortgages outstanding in each state. Rates are the contract rate when the loan was made. Shares may not add to exactly 100% because of rounding.
State-by-state takeaways
Alabama
41.8% of Alabama’s roughly 723,000 outstanding mortgages carry a rate under 4% (rank 47 of 51), down from 45.0% a year earlier and 60.7% at the Q1 2022 peak. 27.4% are at 6% or higher. The average rate on existing loans is 4.7%, about 2.6 points below the 7.28% national average for a new 30-year loan in early October 2026. The average monthly payment is $1,502.
Alaska
50.6% of Alaska’s roughly 111,000 outstanding mortgages carry a rate under 4% (rank 22 of 51), down from 54.4% a year earlier and 67.9% at the Q1 2022 peak. 19.8% are at 6% or higher. The average rate on existing loans is 4.3%, about 3.0 points below the 7.28% national average for a new 30-year loan in early October 2026. The average monthly payment is $2,057.
Arizona
51.4% of Arizona’s roughly 1,302,000 outstanding mortgages carry a rate under 4% (rank 19 of 51), down from 54.6% a year earlier and 70.4% at the Q1 2022 peak. 20.5% are at 6% or higher. The average rate on existing loans is 4.3%, about 3.0 points below the 7.28% national average for a new 30-year loan in early October 2026. The average monthly payment is $1,855.
Arkansas
41.6% of Arkansas’s roughly 409,000 outstanding mortgages carry a rate under 4% (rank 48 of 51), down from 45.2% a year earlier and 60.6% at the Q1 2022 peak. 28.4% are at 6% or higher. The average rate on existing loans is 4.7%, about 2.6 points below the 7.28% national average for a new 30-year loan in early October 2026. The average monthly payment is $1,450.
California
60.1% of California’s roughly 5,663,000 outstanding mortgages carry a rate under 4% (rank 1 of 51), down from 62.3% a year earlier and 71.8% at the Q1 2022 peak. 15.7% are at 6% or higher. The average rate on existing loans is 4.0%, about 3.3 points below the 7.28% national average for a new 30-year loan in early October 2026. The average monthly payment is $2,701.
Colorado
56.2% of Colorado’s roughly 1,161,000 outstanding mortgages carry a rate under 4% (rank 6 of 51), down from 59.6% a year earlier and 76.0% at the Q1 2022 peak. 18.5% are at 6% or higher. The average rate on existing loans is 4.2%, about 3.1 points below the 7.28% national average for a new 30-year loan in early October 2026. The average monthly payment is $2,413.
Connecticut
50.9% of Connecticut’s roughly 604,000 outstanding mortgages carry a rate under 4% (rank 21 of 51), down from 53.2% a year earlier and 63.3% at the Q1 2022 peak. 20.6% are at 6% or higher. The average rate on existing loans is 4.3%, about 3.0 points below the 7.28% national average for a new 30-year loan in early October 2026. The average monthly payment is $2,401.
Delaware
49.1% of Delaware’s roughly 204,000 outstanding mortgages carry a rate under 4% (rank 27 of 51), down from 51.6% a year earlier and 63.5% at the Q1 2022 peak. 22.6% are at 6% or higher. The average rate on existing loans is 4.4%, about 2.9 points below the 7.28% national average for a new 30-year loan in early October 2026. The average monthly payment is $1,799.
District of Columbia
55.8% of District of Columbia’s roughly 113,000 outstanding mortgages carry a rate under 4% (rank 8 of 51), down from 57.9% a year earlier and 68.7% at the Q1 2022 peak. 17.8% are at 6% or higher. The average rate on existing loans is 4.2%, about 3.1 points below the 7.28% national average for a new 30-year loan in early October 2026. The average monthly payment is $2,996.
Florida
43.1% of Florida’s roughly 3,587,000 outstanding mortgages carry a rate under 4% (rank 43 of 51), down from 46.0% a year earlier and 60.8% at the Q1 2022 peak. 25.3% are at 6% or higher. The average rate on existing loans is 4.6%, about 2.7 points below the 7.28% national average for a new 30-year loan in early October 2026. The average monthly payment is $2,146.
Georgia
44.4% of Georgia’s roughly 1,742,000 outstanding mortgages carry a rate under 4% (rank 39 of 51), down from 47.4% a year earlier and 62.4% at the Q1 2022 peak. 25.4% are at 6% or higher. The average rate on existing loans is 4.6%, about 2.7 points below the 7.28% national average for a new 30-year loan in early October 2026. The average monthly payment is $1,917.
Hawaii
57.3% of Hawaii’s roughly 186,000 outstanding mortgages carry a rate under 4% (rank 3 of 51), down from 59.7% a year earlier and 68.1% at the Q1 2022 peak. 15.1% are at 6% or higher. The average rate on existing loans is 4.1%, about 3.2 points below the 7.28% national average for a new 30-year loan in early October 2026. The average monthly payment is $2,764.
Idaho
53.9% of Idaho’s roughly 336,000 outstanding mortgages carry a rate under 4% (rank 10 of 51), down from 57.9% a year earlier and 75.1% at the Q1 2022 peak. 19.9% are at 6% or higher. The average rate on existing loans is 4.3%, about 3.0 points below the 7.28% national average for a new 30-year loan in early October 2026. The average monthly payment is $1,827.
Illinois
48.7% of Illinois’s roughly 2,005,000 outstanding mortgages carry a rate under 4% (rank 28 of 51), down from 51.7% a year earlier and 63.3% at the Q1 2022 peak. 24.4% are at 6% or higher. The average rate on existing loans is 4.5%, about 2.8 points below the 7.28% national average for a new 30-year loan in early October 2026. The average monthly payment is $1,891.
Indiana
45.1% of Indiana’s roughly 1,118,000 outstanding mortgages carry a rate under 4% (rank 37 of 51), down from 48.4% a year earlier and 63.1% at the Q1 2022 peak. 27.1% are at 6% or higher. The average rate on existing loans is 4.6%, about 2.7 points below the 7.28% national average for a new 30-year loan in early October 2026. The average monthly payment is $1,427.
Iowa
50.0% of Iowa’s roughly 512,000 outstanding mortgages carry a rate under 4% (rank 25 of 51), down from 54.0% a year earlier and 68.0% at the Q1 2022 peak. 22.6% are at 6% or higher. The average rate on existing loans is 4.4%, about 2.9 points below the 7.28% national average for a new 30-year loan in early October 2026. The average monthly payment is $1,499.
Kansas
46.0% of Kansas’s roughly 426,000 outstanding mortgages carry a rate under 4% (rank 34 of 51), down from 49.8% a year earlier and 64.7% at the Q1 2022 peak. 26.9% are at 6% or higher. The average rate on existing loans is 4.6%, about 2.7 points below the 7.28% national average for a new 30-year loan in early October 2026. The average monthly payment is $1,693.
Kentucky
44.1% of Kentucky’s roughly 621,000 outstanding mortgages carry a rate under 4% (rank 40 of 51), down from 47.4% a year earlier and 61.6% at the Q1 2022 peak. 27.7% are at 6% or higher. The average rate on existing loans is 4.7%, about 2.6 points below the 7.28% national average for a new 30-year loan in early October 2026. The average monthly payment is $1,420.
Louisiana
42.6% of Louisiana’s roughly 616,000 outstanding mortgages carry a rate under 4% (rank 45 of 51), down from 45.3% a year earlier and 56.7% at the Q1 2022 peak. 26.0% are at 6% or higher. The average rate on existing loans is 4.7%, about 2.6 points below the 7.28% national average for a new 30-year loan in early October 2026. The average monthly payment is $1,592.
Maine
47.3% of Maine’s roughly 241,000 outstanding mortgages carry a rate under 4% (rank 31 of 51), down from 50.0% a year earlier and 62.5% at the Q1 2022 peak. 24.0% are at 6% or higher. The average rate on existing loans is 4.5%, about 2.8 points below the 7.28% national average for a new 30-year loan in early October 2026. The average monthly payment is $1,671.
Maryland
52.7% of Maryland’s roughly 1,171,000 outstanding mortgages carry a rate under 4% (rank 14 of 51), down from 55.2% a year earlier and 66.2% at the Q1 2022 peak. 20.7% are at 6% or higher. The average rate on existing loans is 4.3%, about 3.0 points below the 7.28% national average for a new 30-year loan in early October 2026. The average monthly payment is $2,286.
Massachusetts
56.9% of Massachusetts’s roughly 1,168,000 outstanding mortgages carry a rate under 4% (rank 5 of 51), down from 59.5% a year earlier and 70.2% at the Q1 2022 peak. 17.8% are at 6% or higher. The average rate on existing loans is 4.2%, about 3.1 points below the 7.28% national average for a new 30-year loan in early October 2026. The average monthly payment is $2,633.
Michigan
47.7% of Michigan’s roughly 1,641,000 outstanding mortgages carry a rate under 4% (rank 30 of 51), down from 50.8% a year earlier and 63.8% at the Q1 2022 peak. 25.1% are at 6% or higher. The average rate on existing loans is 4.5%, about 2.8 points below the 7.28% national average for a new 30-year loan in early October 2026. The average monthly payment is $1,502.
Minnesota
54.6% of Minnesota’s roughly 1,026,000 outstanding mortgages carry a rate under 4% (rank 9 of 51), down from 58.0% a year earlier and 71.5% at the Q1 2022 peak. 20.4% are at 6% or higher. The average rate on existing loans is 4.3%, about 3.0 points below the 7.28% national average for a new 30-year loan in early October 2026. The average monthly payment is $1,918.
Mississippi
40.4% of Mississippi’s roughly 340,000 outstanding mortgages carry a rate under 4% (rank 49 of 51), down from 43.1% a year earlier and 56.2% at the Q1 2022 peak. 29.4% are at 6% or higher. The average rate on existing loans is 4.8%, about 2.5 points below the 7.28% national average for a new 30-year loan in early October 2026. The average monthly payment is $1,442.
Missouri
46.2% of Missouri’s roughly 972,000 outstanding mortgages carry a rate under 4% (rank 33 of 51), down from 49.9% a year earlier and 64.9% at the Q1 2022 peak. 26.8% are at 6% or higher. The average rate on existing loans is 4.6%, about 2.7 points below the 7.28% national average for a new 30-year loan in early October 2026. The average monthly payment is $1,586.
Montana
52.8% of Montana’s roughly 169,000 outstanding mortgages carry a rate under 4% (rank 12 of 51), down from 56.7% a year earlier and 71.5% at the Q1 2022 peak. 19.9% are at 6% or higher. The average rate on existing loans is 4.3%, about 3.0 points below the 7.28% national average for a new 30-year loan in early October 2026. The average monthly payment is $1,911.
Nebraska
50.5% of Nebraska’s roughly 300,000 outstanding mortgages carry a rate under 4% (rank 23 of 51), down from 54.4% a year earlier and 70.0% at the Q1 2022 peak. 22.9% are at 6% or higher. The average rate on existing loans is 4.4%, about 2.9 points below the 7.28% national average for a new 30-year loan in early October 2026. The average monthly payment is $1,736.
Nevada
48.4% of Nevada’s roughly 543,000 outstanding mortgages carry a rate under 4% (rank 29 of 51), down from 51.2% a year earlier and 66.8% at the Q1 2022 peak. 20.3% are at 6% or higher. The average rate on existing loans is 4.4%, about 2.9 points below the 7.28% national average for a new 30-year loan in early October 2026. The average monthly payment is $1,981.
New Hampshire
52.8% of New Hampshire’s roughly 239,000 outstanding mortgages carry a rate under 4% (rank 13 of 51), down from 55.5% a year earlier and 67.3% at the Q1 2022 peak. 21.3% are at 6% or higher. The average rate on existing loans is 4.3%, about 3.0 points below the 7.28% national average for a new 30-year loan in early October 2026. The average monthly payment is $2,204.
New Jersey
51.0% of New Jersey’s roughly 1,402,000 outstanding mortgages carry a rate under 4% (rank 20 of 51), down from 53.3% a year earlier and 63.9% at the Q1 2022 peak. 20.8% are at 6% or higher. The average rate on existing loans is 4.3%, about 3.0 points below the 7.28% national average for a new 30-year loan in early October 2026. The average monthly payment is $2,744.
New Mexico
43.0% of New Mexico’s roughly 304,000 outstanding mortgages carry a rate under 4% (rank 44 of 51), down from 46.2% a year earlier and 59.1% at the Q1 2022 peak. 25.1% are at 6% or higher. The average rate on existing loans is 4.6%, about 2.7 points below the 7.28% national average for a new 30-year loan in early October 2026. The average monthly payment is $1,557.
New York
45.6% of New York’s roughly 2,224,000 outstanding mortgages carry a rate under 4% (rank 36 of 51), down from 47.9% a year earlier and 56.4% at the Q1 2022 peak. 22.4% are at 6% or higher. The average rate on existing loans is 4.5%, about 2.8 points below the 7.28% national average for a new 30-year loan in early October 2026. The average monthly payment is $2,562.
North Carolina
46.0% of North Carolina’s roughly 1,823,000 outstanding mortgages carry a rate under 4% (rank 35 of 51), down from 49.3% a year earlier and 64.7% at the Q1 2022 peak. 23.9% are at 6% or higher. The average rate on existing loans is 4.5%, about 2.8 points below the 7.28% national average for a new 30-year loan in early October 2026. The average monthly payment is $1,779.
North Dakota
52.3% of North Dakota’s roughly 111,000 outstanding mortgages carry a rate under 4% (rank 16 of 51), down from 56.5% a year earlier and 72.3% at the Q1 2022 peak. 19.9% are at 6% or higher. The average rate on existing loans is 4.3%, about 3.0 points below the 7.28% national average for a new 30-year loan in early October 2026. The average monthly payment is $1,638.
Ohio
45.0% of Ohio’s roughly 1,783,000 outstanding mortgages carry a rate under 4% (rank 38 of 51), down from 48.1% a year earlier and 60.7% at the Q1 2022 peak. 26.1% are at 6% or higher. The average rate on existing loans is 4.6%, about 2.7 points below the 7.28% national average for a new 30-year loan in early October 2026. The average monthly payment is $1,502.
Oklahoma
38.7% of Oklahoma’s roughly 523,000 outstanding mortgages carry a rate under 4% (rank 51 of 51), down from 42.0% a year earlier and 57.0% at the Q1 2022 peak. 28.8% are at 6% or higher. The average rate on existing loans is 4.8%, about 2.5 points below the 7.28% national average for a new 30-year loan in early October 2026. The average monthly payment is $1,567.
Oregon
56.0% of Oregon’s roughly 701,000 outstanding mortgages carry a rate under 4% (rank 7 of 51), down from 59.2% a year earlier and 72.0% at the Q1 2022 peak. 18.6% are at 6% or higher. The average rate on existing loans is 4.2%, about 3.1 points below the 7.28% national average for a new 30-year loan in early October 2026. The average monthly payment is $2,111.
Pennsylvania
46.5% of Pennsylvania’s roughly 1,905,000 outstanding mortgages carry a rate under 4% (rank 32 of 51), down from 49.1% a year earlier and 60.3% at the Q1 2022 peak. 23.6% are at 6% or higher. The average rate on existing loans is 4.5%, about 2.8 points below the 7.28% national average for a new 30-year loan in early October 2026. The average monthly payment is $1,704.
Rhode Island
52.1% of Rhode Island’s roughly 179,000 outstanding mortgages carry a rate under 4% (rank 18 of 51), down from 54.8% a year earlier and 66.6% at the Q1 2022 peak. 21.1% are at 6% or higher. The average rate on existing loans is 4.3%, about 3.0 points below the 7.28% national average for a new 30-year loan in early October 2026. The average monthly payment is $2,171.
South Carolina
43.4% of South Carolina’s roughly 917,000 outstanding mortgages carry a rate under 4% (rank 41 of 51), down from 46.9% a year earlier and 63.0% at the Q1 2022 peak. 25.6% are at 6% or higher. The average rate on existing loans is 4.6%, about 2.7 points below the 7.28% national average for a new 30-year loan in early October 2026. The average monthly payment is $1,666.
South Dakota
52.2% of South Dakota’s roughly 128,000 outstanding mortgages carry a rate under 4% (rank 17 of 51), down from 55.9% a year earlier and 73.3% at the Q1 2022 peak. 21.3% are at 6% or higher. The average rate on existing loans is 4.3%, about 3.0 points below the 7.28% national average for a new 30-year loan in early October 2026. The average monthly payment is $1,743.
Tennessee
43.4% of Tennessee’s roughly 1,071,000 outstanding mortgages carry a rate under 4% (rank 42 of 51), down from 46.8% a year earlier and 64.0% at the Q1 2022 peak. 26.6% are at 6% or higher. The average rate on existing loans is 4.6%, about 2.7 points below the 7.28% national average for a new 30-year loan in early October 2026. The average monthly payment is $1,735.
Texas
42.1% of Texas’s roughly 4,196,000 outstanding mortgages carry a rate under 4% (rank 46 of 51), down from 45.4% a year earlier and 60.7% at the Q1 2022 peak. 24.5% are at 6% or higher. The average rate on existing loans is 4.6%, about 2.7 points below the 7.28% national average for a new 30-year loan in early October 2026. The average monthly payment is $2,067.
Utah
58.0% of Utah’s roughly 600,000 outstanding mortgages carry a rate under 4% (rank 2 of 51), down from 61.4% a year earlier and 79.3% at the Q1 2022 peak. 18.8% are at 6% or higher. The average rate on existing loans is 4.1%, about 3.2 points below the 7.28% national average for a new 30-year loan in early October 2026. The average monthly payment is $2,135.
Vermont
49.7% of Vermont’s roughly 103,000 outstanding mortgages carry a rate under 4% (rank 26 of 51), down from 52.0% a year earlier and 62.4% at the Q1 2022 peak. 21.3% are at 6% or higher. The average rate on existing loans is 4.4%, about 2.9 points below the 7.28% national average for a new 30-year loan in early October 2026. The average monthly payment is $1,717.
Virginia
52.6% of Virginia’s roughly 1,587,000 outstanding mortgages carry a rate under 4% (rank 15 of 51), down from 55.7% a year earlier and 69.0% at the Q1 2022 peak. 20.3% are at 6% or higher. The average rate on existing loans is 4.3%, about 3.0 points below the 7.28% national average for a new 30-year loan in early October 2026. The average monthly payment is $2,168.
Washington
57.0% of Washington’s roughly 1,323,000 outstanding mortgages carry a rate under 4% (rank 4 of 51), down from 60.0% a year earlier and 73.5% at the Q1 2022 peak. 18.2% are at 6% or higher. The average rate on existing loans is 4.2%, about 3.1 points below the 7.28% national average for a new 30-year loan in early October 2026. The average monthly payment is $2,559.
West Virginia
38.8% of West Virginia’s roughly 224,000 outstanding mortgages carry a rate under 4% (rank 50 of 51), down from 41.6% a year earlier and 53.0% at the Q1 2022 peak. 27.8% are at 6% or higher. The average rate on existing loans is 4.8%, about 2.5 points below the 7.28% national average for a new 30-year loan in early October 2026. The average monthly payment is $1,189.
Wisconsin
52.9% of Wisconsin’s roughly 974,000 outstanding mortgages carry a rate under 4% (rank 11 of 51), down from 56.8% a year earlier and 71.1% at the Q1 2022 peak. 22.2% are at 6% or higher. The average rate on existing loans is 4.3%, about 3.0 points below the 7.28% national average for a new 30-year loan in early October 2026. The average monthly payment is $1,558.
Wyoming
50.3% of Wyoming’s roughly 95,000 outstanding mortgages carry a rate under 4% (rank 24 of 51), down from 54.3% a year earlier and 71.8% at the Q1 2022 peak. 22.0% are at 6% or higher. The average rate on existing loans is 4.4%, about 2.9 points below the 7.28% national average for a new 30-year loan in early October 2026. The average monthly payment is $1,728.
Related data
See home prices vs. home services jobs, housing permits vs. builder jobs by state, property taxes by state and how rate hikes hit small businesses.
Methods and limits
- Source: FHFA National Mortgage Database (NMDB) outstanding mortgage statistics, quarterly, all mortgages, downloaded as FHFA’s official state and national files. We use the loan-count-weighted values (VALUE1). The U.S. row comes from FHFA’s national file, not a sum of states.
- NMDB is a nationally representative 5% sample of closed-end first-lien residential mortgages from Experian credit files, so each sample loan stands for about 20 loans. FHFA notes that loans on investor properties and manufactured homes are under-represented.
- “Rate” means the contract rate at origination. Adjustable-rate loans are classed by their starting rate.
- New-loan rates are Freddie Mac’s weekly Primary Mortgage Market Survey (30-year fixed), pulled from the St. Louis Fed’s FRED API. The 10-year Treasury yield is FRED series DGS10, weekly average.
- The $300,000 payment example uses the standard fixed-rate amortization formula and excludes taxes and insurance.
Sources
- FHFA National Mortgage Database aggregate statistics
- Freddie Mac 30-year fixed rate (MORTGAGE30US) via FRED
- 10-year Treasury yield (DGS10) via FRED
- Federal Reserve FOMC statement, Sept. 16, 2026
Cite this data
Reporters and bloggers may use these numbers and charts. Please credit StartBusinessByState and link to this page.
Source: StartBusinessByState, “Mortgage Rate Lock-In by State: Who Still Has a Rate Under 4%,” https://startbusinessbystate.com/mortgage-rate-lock-in-by-state/ (updated October 7, 2026).
FAQ
What is the mortgage rate lock-in effect?
It is when homeowners stay in their homes because selling would mean giving up a low mortgage rate and borrowing at a higher one. It reduces the number of homes listed for sale.
How many mortgages are below 4%?
49.1% of outstanding U.S. mortgages had a rate under 4% in Q2 2026, according to FHFA’s National Mortgage Database. 19.2% were under 3%.
Which state has the most low-rate mortgages?
California, where 60.1% of mortgages are under 4%. Utah (58.0%) and Hawaii (57.3%) follow. Oklahoma has the lowest share (38.7%).
What is the average mortgage rate on existing loans?
4.4% nationally in Q2 2026, compared with 7.28% for a new 30-year fixed loan in the week of Oct. 1, 2026.
Is the lock-in effect easing?
Slowly. The share of loans under 4% fell from 52.1% to 49.1% over the past year, and the share at 6% or more rose from 20.2% to 22.5%.
Last updated October 7, 2026 by StartBusinessByState.