HUD FY2027 Fair Market Rents, effective Oct. 1, 2026 · Compared with FY2026 · Updated by StartBusinessByState
Short answer: HUD’s Fair Market Rents set the ceiling for most Section 8 Housing Choice Voucher rents. The new FY2027 numbers took effect on October 1, 2026. Chicago (+12.9%), Washington, D.C. and St. Louis got large increases. Dallas, Phoenix, San Diego, Houston and much of Arizona went down. If you own or manage rentals with voucher tenants, check your area below. Your local housing authority sets its own payment standard, usually between 90% and 110% of the FMR.
Key facts for reporters
- FY2027 FMRs cover 2,588 areas: 638 metro FMR areas and 1,950 nonmetro counties. They took effect Oct. 1, 2026 (Federal Register, Sept. 1, 2026).
- 2-bedroom FMR: 2,120 areas up, 464 down, 4 unchanged. Median change across areas: +4.2%. Population-weighted: +2.0%.
- Metro areas: 431 up, 205 down. 40 areas, including 13 metros, fell the full 10%, the most HUD allows in one year.
- Biggest metro drops: Flagstaff, AZ (-10.0%), Lake Havasu City-Kingman, AZ (-10.0%), Yuma, AZ (-10.0%), Oxnard-Thousand Oaks-Ventura, CA (-10.0%), Salinas, CA (-10.0%).
- Biggest metro increases: St. James Parish, LA (+26.5%), Hattiesburg, MS (+25.7%), Joplin, MO (+21.8%), Pickens County, AL (+18.7%).
- By state (population-weighted): largest decreases in Arizona (-5.3%), Utah (-4.3%), Hawaii (-3.0%), Alaska (-2.9%); largest increases in Vermont (+10.4%), Illinois (+9.8%), Missouri (+9.6%), South Dakota (+9.2%).
The 25 largest FMR areas
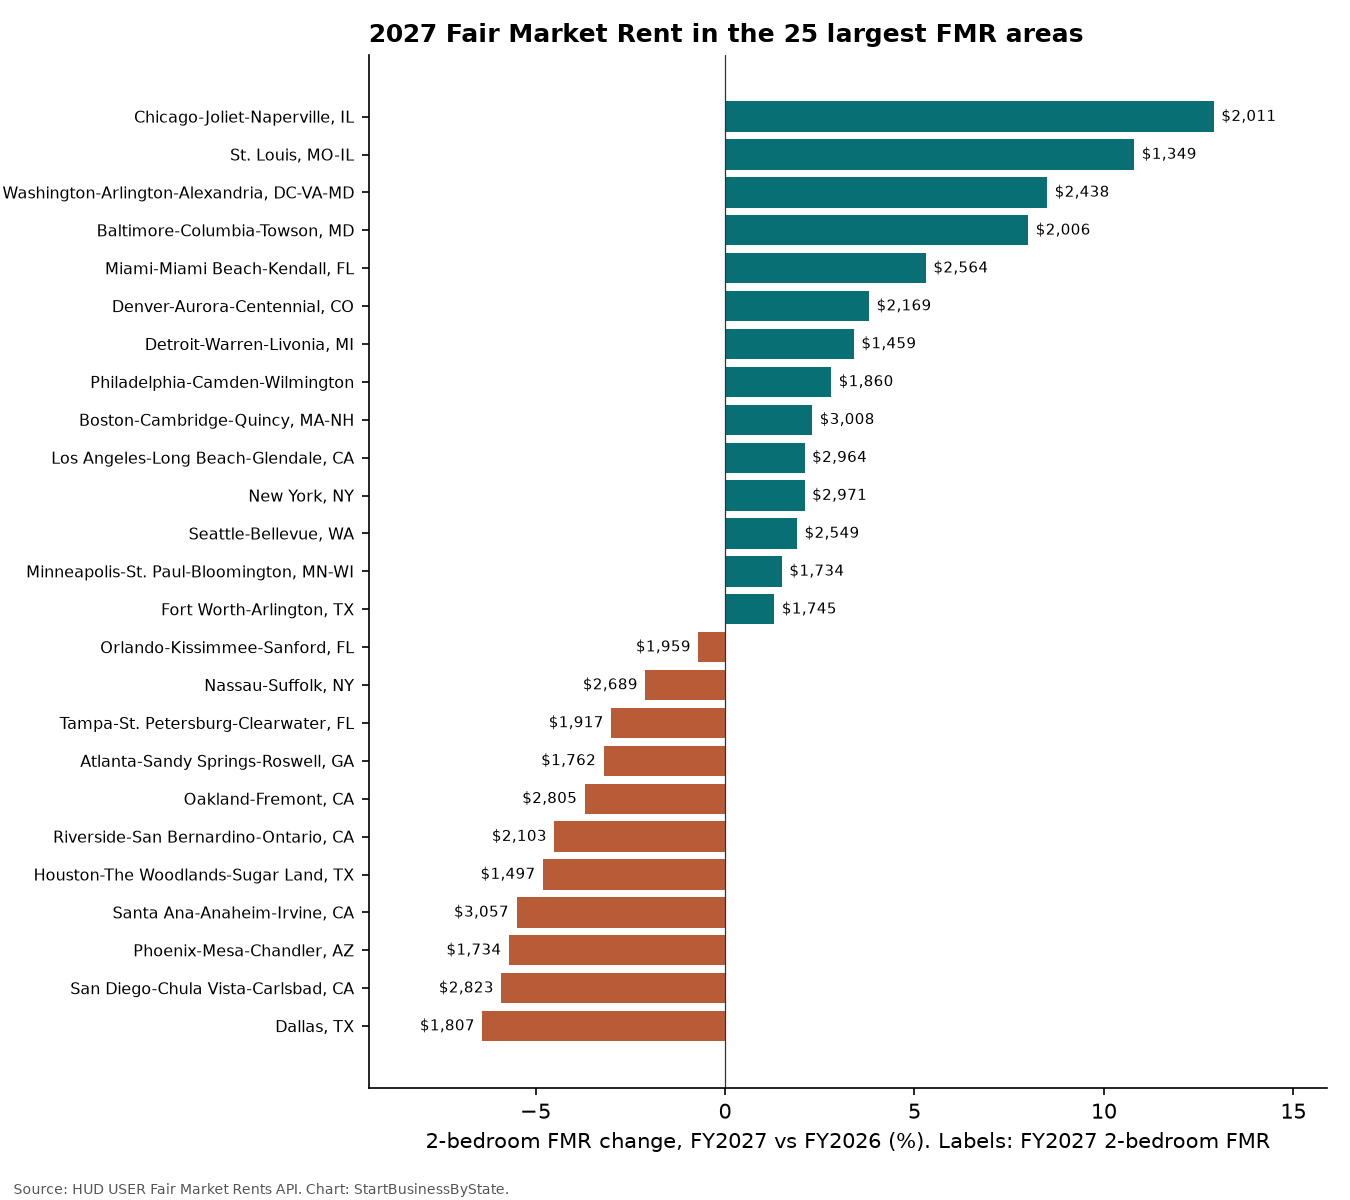
| FMR area | 1-BR FY2027 | 2-BR FY2026 | 2-BR FY2027 | 2-BR change | 3-BR FY2027 |
|---|---|---|---|---|---|
| New York, NY | $2,729 | $2,910 | $2,971 | +2.1% | $3,760 |
| Los Angeles-Long Beach-Glendale, CA | $2,402 | $2,903 | $2,964 | +2.1% | $3,760 |
| Chicago-Joliet-Naperville, IL | $1,780 | $1,781 | $2,011 | +12.9% | $2,586 |
| Houston-The Woodlands-Sugar Land, TX | $1,261 | $1,573 | $1,497 | -4.8% | $2,017 |
| Philadelphia-Camden-Wilmington, PA-NJ-DE-MD | $1,558 | $1,810 | $1,860 | +2.8% | $2,216 |
| Washington-Arlington-Alexandria, DC-VA-MD | $2,204 | $2,246 | $2,438 | +8.5% | $3,107 |
| Atlanta-Sandy Springs-Roswell, GA | $1,619 | $1,820 | $1,762 | -3.2% | $2,099 |
| Dallas, TX | $1,536 | $1,931 | $1,807 | -6.4% | $2,275 |
| Phoenix-Mesa-Chandler, AZ | $1,493 | $1,839 | $1,734 | -5.7% | $2,287 |
| Riverside-San Bernardino-Ontario, CA | $1,705 | $2,201 | $2,103 | -4.5% | $2,771 |
| Detroit-Warren-Livonia, MI | $1,167 | $1,411 | $1,459 | +3.4% | $1,777 |
| Minneapolis-St. Paul-Bloomington, MN-WI | $1,427 | $1,709 | $1,734 | +1.5% | $2,264 |
| Boston-Cambridge-Quincy, MA-NH | $2,518 | $2,941 | $3,008 | +2.3% | $3,584 |
| Tampa-St. Petersburg-Clearwater, FL | $1,648 | $1,977 | $1,917 | -3.0% | $2,448 |
| San Diego-Chula Vista-Carlsbad, CA | $2,335 | $3,001 | $2,823 | -5.9% | $3,743 |
| Santa Ana-Anaheim-Irvine, CA | $2,610 | $3,236 | $3,057 | -5.5% | $4,153 |
| Seattle-Bellevue, WA | $2,180 | $2,501 | $2,549 | +1.9% | $3,324 |
| Denver-Aurora-Centennial, CO | $1,831 | $2,089 | $2,169 | +3.8% | $2,846 |
| Nassau-Suffolk, NY | $2,285 | $2,747 | $2,689 | -2.1% | $3,458 |
| Baltimore-Columbia-Towson, MD | $1,625 | $1,857 | $2,006 | +8.0% | $2,509 |
| Oakland-Fremont, CA | $2,290 | $2,912 | $2,805 | -3.7% | $3,592 |
| Orlando-Kissimmee-Sanford, FL | $1,726 | $1,972 | $1,959 | -0.7% | $2,445 |
| St. Louis, MO-IL | $1,104 | $1,218 | $1,349 | +10.8% | $1,731 |
| Miami-Miami Beach-Kendall, FL | $2,121 | $2,436 | $2,564 | +5.3% | $3,277 |
| Fort Worth-Arlington, TX | $1,481 | $1,723 | $1,745 | +1.3% | $2,284 |
Change by state
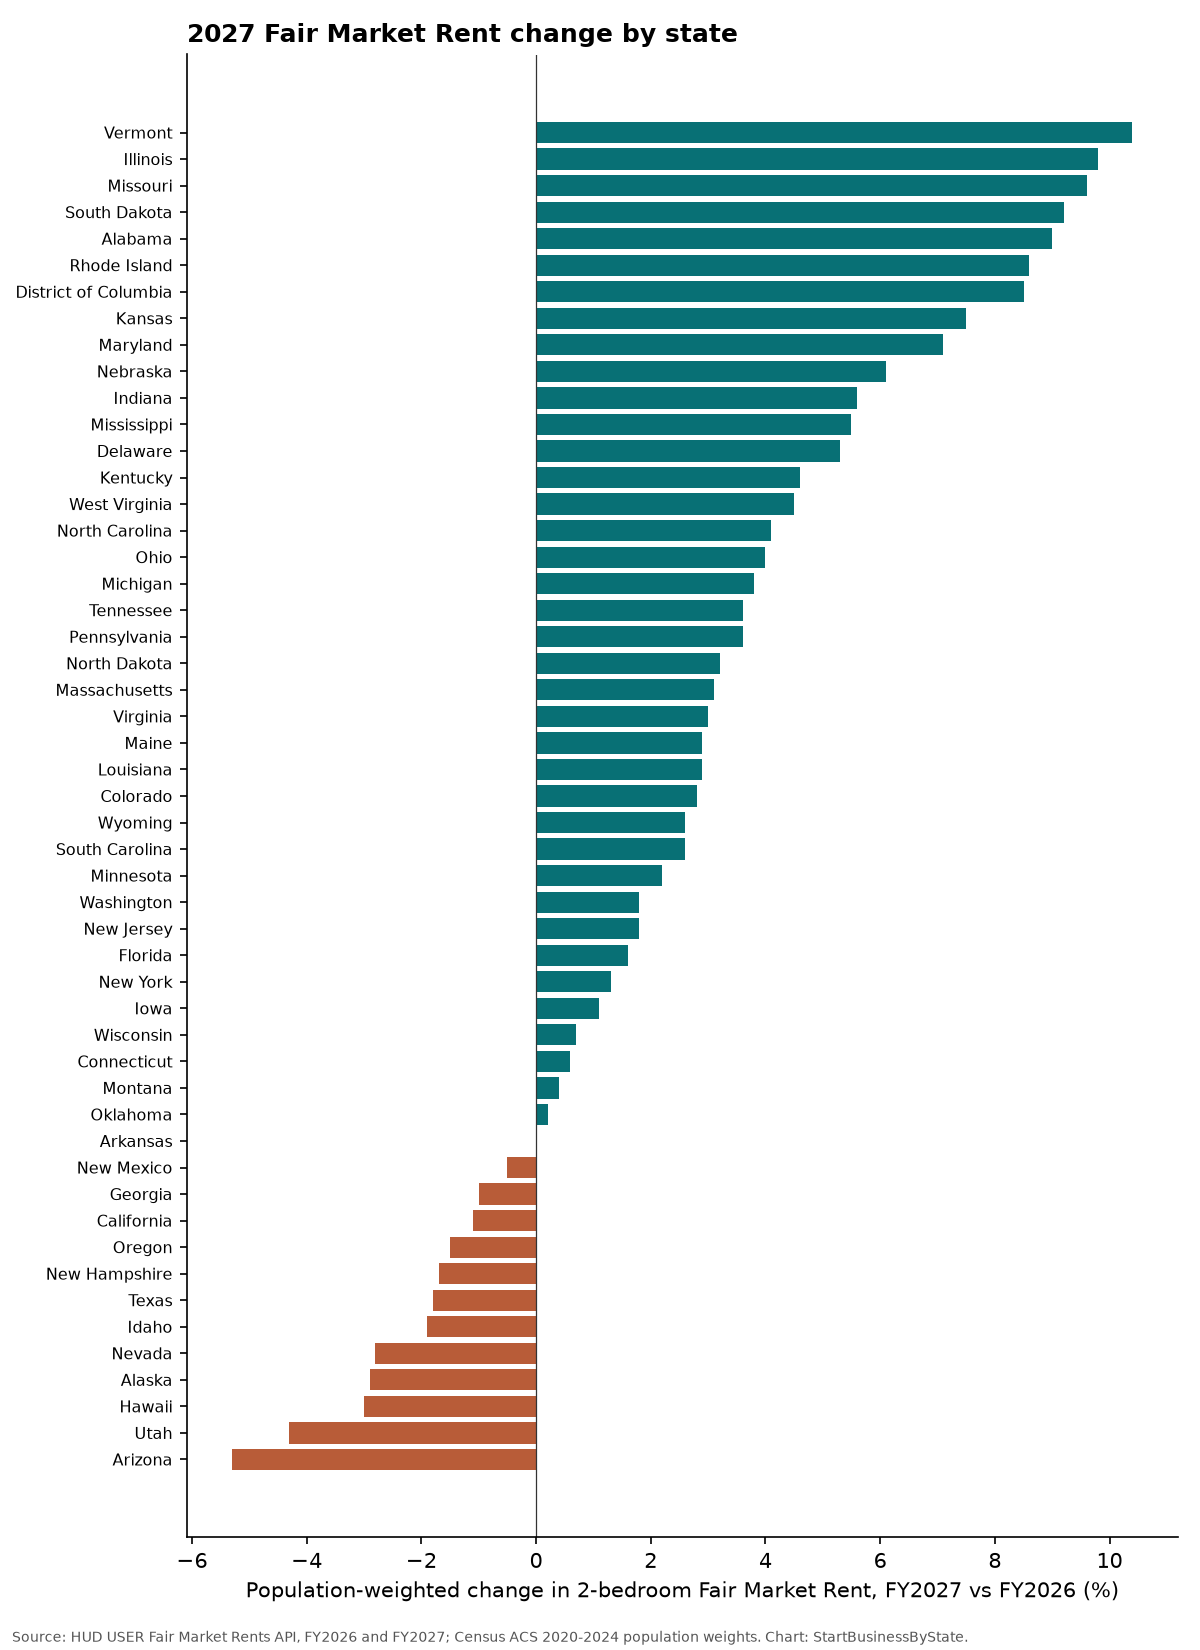
State figures weight each county (or New England town) by its population, so a big metro counts more than a rural county. The median-area change is higher than the weighted change because many small rural counties rose while several large Sun Belt metros fell.
2027 Fair Market Rent by state
| State | Avg 2-BR FMR, FY2026 | Avg 2-BR FMR, FY2027 | Change | Residents in areas that fell | FMR areas | Up | Down | Hit 10% floor |
|---|---|---|---|---|---|---|---|---|
| U.S. total | $1,735 | $1,760 | +2.0% | 36.6% | 2588 | 2120 | 464 | 40 |
| Alabama | $1,081 | $1,170 | +9.0% | 5.6% | 55 | 52 | 3 | 0 |
| Alaska | $1,567 | $1,519 | -2.9% | 69.5% | 30 | 24 | 6 | 0 |
| Arizona | $1,707 | $1,616 | -5.3% | 85.6% | 14 | 1 | 13 | 5 |
| Arkansas | $1,067 | $1,061 | +0.0% | 44.4% | 68 | 64 | 4 | 0 |
| California | $2,670 | $2,632 | -1.1% | 55.0% | 51 | 27 | 24 | 2 |
| Colorado | $1,865 | $1,916 | +2.8% | 21.7% | 55 | 50 | 5 | 0 |
| Connecticut | $2,027 | $2,033 | +0.6% | 44.7% | 8 | 3 | 5 | 0 |
| Delaware | $1,645 | $1,727 | +5.3% | 0.0% | 3 | 3 | 0 | 0 |
| District of Columbia | $2,246 | $2,438 | +8.5% | 0.0% | 1 | 1 | 0 | 0 |
| Florida | $1,930 | $1,962 | +1.6% | 50.8% | 52 | 17 | 35 | 19 |
| Georgia | $1,552 | $1,528 | -1.0% | 71.8% | 112 | 86 | 26 | 0 |
| Hawaii | $2,544 | $2,467 | -3.0% | 74.4% | 5 | 2 | 3 | 0 |
| Idaho | $1,406 | $1,367 | -1.9% | 62.1% | 40 | 32 | 7 | 2 |
| Illinois | $1,557 | $1,724 | +9.8% | 11.0% | 83 | 64 | 19 | 0 |
| Indiana | $1,235 | $1,302 | +5.6% | 4.0% | 73 | 72 | 1 | 0 |
| Iowa | $1,099 | $1,113 | +1.1% | 23.4% | 92 | 80 | 11 | 0 |
| Kansas | $1,124 | $1,212 | +7.5% | 22.2% | 94 | 91 | 3 | 0 |
| Kentucky | $1,106 | $1,155 | +4.6% | 5.8% | 101 | 95 | 6 | 0 |
| Louisiana | $1,128 | $1,161 | +2.9% | 38.8% | 45 | 38 | 7 | 0 |
| Maine | $1,651 | $1,714 | +2.9% | 40.1% | 19 | 8 | 11 | 0 |
| Maryland | $1,958 | $2,103 | +7.1% | 5.0% | 15 | 10 | 5 | 0 |
| Massachusetts | $2,494 | $2,565 | +3.1% | 8.8% | 20 | 18 | 2 | 0 |
| Michigan | $1,310 | $1,361 | +3.8% | 7.0% | 77 | 70 | 7 | 0 |
| Minnesota | $1,478 | $1,507 | +2.2% | 6.7% | 73 | 68 | 5 | 0 |
| Mississippi | $1,035 | $1,087 | +5.5% | 2.5% | 76 | 73 | 3 | 0 |
| Missouri | $1,138 | $1,250 | +9.6% | 3.2% | 95 | 93 | 2 | 0 |
| Montana | $1,525 | $1,529 | +0.4% | 21.0% | 55 | 53 | 2 | 0 |
| Nebraska | $1,188 | $1,260 | +6.1% | 3.5% | 90 | 88 | 2 | 0 |
| Nevada | $1,719 | $1,672 | -2.8% | 97.9% | 16 | 2 | 14 | 1 |
| New Hampshire | $2,038 | $2,010 | -1.7% | 54.4% | 14 | 6 | 8 | 3 |
| New Jersey | $2,230 | $2,268 | +1.8% | 29.8% | 11 | 9 | 2 | 0 |
| New Mexico | $1,295 | $1,282 | -0.5% | 43.5% | 30 | 29 | 1 | 0 |
| New York | $2,372 | $2,402 | +1.3% | 25.4% | 39 | 20 | 19 | 2 |
| North Carolina | $1,392 | $1,441 | +4.1% | 22.5% | 83 | 76 | 6 | 1 |
| North Dakota | $1,076 | $1,102 | +3.2% | 60.4% | 51 | 46 | 5 | 1 |
| Ohio | $1,221 | $1,273 | +4.0% | 34.6% | 68 | 63 | 5 | 0 |
| Oklahoma | $1,123 | $1,127 | +0.2% | 32.7% | 69 | 11 | 58 | 0 |
| Oregon | $1,715 | $1,691 | -1.5% | 72.2% | 31 | 10 | 21 | 0 |
| Pennsylvania | $1,475 | $1,528 | +3.6% | 13.9% | 52 | 43 | 9 | 2 |
| Rhode Island | $1,760 | $1,911 | +8.6% | 0.0% | 3 | 3 | 0 | 0 |
| South Carolina | $1,347 | $1,391 | +2.6% | 36.0% | 38 | 13 | 25 | 0 |
| South Dakota | $1,090 | $1,187 | +9.2% | 0.0% | 63 | 63 | 0 | 0 |
| Tennessee | $1,337 | $1,381 | +3.6% | 10.3% | 72 | 68 | 4 | 0 |
| Texas | $1,523 | $1,488 | -1.8% | 64.0% | 215 | 185 | 29 | 1 |
| Utah | $1,564 | $1,493 | -4.3% | 87.6% | 26 | 9 | 17 | 0 |
| Vermont | $1,629 | $1,773 | +10.4% | 0.0% | 12 | 12 | 0 | 0 |
| Virginia | $1,731 | $1,792 | +3.0% | 46.5% | 64 | 51 | 13 | 1 |
| Washington | $2,010 | $2,044 | +1.8% | 33.8% | 35 | 25 | 10 | 0 |
| West Virginia | $996 | $1,039 | +4.5% | 8.6% | 49 | 47 | 2 | 0 |
| Wisconsin | $1,251 | $1,251 | +0.7% | 39.0% | 65 | 59 | 6 | 0 |
| Wyoming | $1,066 | $1,094 | +2.6% | 14.1% | 23 | 21 | 2 | 0 |
Averages are population-weighted across counties (towns in New England). Multi-state metro areas count in each state they touch, so state area counts add to more than the U.S. total.
Every state and metro area
Open a state to see its takeaway and every metro FMR area. “10% floor” means HUD’s calculated rent fell further and the published FMR was held at 90% of last year’s. “State minimum” means the area is at HUD’s minimum 2-bedroom FMR for that state.
Alabama: +9.0%
About 94% of Alabama residents live where the 2-bedroom FMR went up for FY2027 and 6% live where it went down. Weighted by population, the 2-bedroom FMR moved +9.0% (from about $1,081 to $1,170), rank 5 of 51. Of 55 FMR areas, 52 rose and 3 fell. Largest rise: Talladega County, AL (+20.0%). Largest drop: Washington County, AL (-6.3%). 26 areas are set at the minimum FMR, so they move together.
| Metro FMR area | 1-BR FY2027 | 2-BR FY2026 | 2-BR FY2027 | 2-BR change | 3-BR FY2027 | Note |
|---|---|---|---|---|---|---|
| Anniston-Oxford, AL | $801 | $962 | $1,010 | +5.0% | $1,337 | |
| Auburn-Opelika, AL | $1,167 | $1,181 | $1,277 | +8.1% | $1,548 | |
| Birmingham-Hoover, AL | $1,263 | $1,266 | $1,375 | +8.6% | $1,727 | |
| Chilton County, AL | $793 | $970 | $1,038 | +7.0% | $1,309 | |
| Columbus, GA-AL | $1,053 | $1,088 | $1,212 | +11.4% | $1,611 | |
| Daphne-Fairhope-Foley, AL | $1,317 | $1,345 | $1,434 | +6.6% | $1,855 | |
| Decatur, AL | $835 | $961 | $1,023 | +6.5% | $1,315 | |
| Dothan, AL | $768 | $950 | $966 | +1.7% | $1,291 | |
| Florence-Muscle Shoals, AL | $834 | $1,000 | $1,085 | +8.5% | $1,348 | |
| Gadsden, AL | $830 | $927 | $975 | +5.2% | $1,235 | |
| Greene County, AL | $889 | $1,140 | $1,163 | +2.0% | $1,386 | |
| Henry County, AL | $704 | $878 | $921 | +4.9% | $1,105 | state minimum |
| Huntsville, AL | $1,177 | $1,310 | $1,341 | +2.4% | $1,735 | |
| Macon County, AL | $750 | $995 | $981 | -1.4% | $1,223 | |
| Mobile, AL | $981 | $1,083 | $1,139 | +5.2% | $1,474 | |
| Montgomery, AL | $1,003 | $1,016 | $1,150 | +13.2% | $1,476 | |
| Pickens County, AL | $704 | $776 | $921 | +18.7% | $1,133 | state minimum |
| Tuscaloosa, AL | $975 | $1,169 | $1,165 | -0.3% | $1,470 | |
| Walker County, AL | $776 | $886 | $949 | +7.1% | $1,314 |
Nonmetro areas: 36 (35 up, 1 down). 2-bedroom FY2027 FMRs range from $921 to $1,098. County-level figures are in the CSV.
Alaska: -2.9%
About 30% of Alaska residents live where the 2-bedroom FMR went up for FY2027 and 70% live where it went down. Weighted by population, the 2-bedroom FMR moved -2.9% (from about $1,567 to $1,519), rank 48 of 51. Of 30 FMR areas, 24 rose and 6 fell. Largest rise: Yakutat City and Borough, AK (+13.6%). Largest drop: Fairbanks-College, AK (-7.3%).
| Metro FMR area | 1-BR FY2027 | 2-BR FY2026 | 2-BR FY2027 | 2-BR change | 3-BR FY2027 | Note |
|---|---|---|---|---|---|---|
| Anchorage, AK | $1,169 | $1,631 | $1,529 | -6.3% | $2,117 | |
| Fairbanks-College, AK | $1,187 | $1,676 | $1,553 | -7.3% | $2,150 | |
| Matanuska-Susitna Borough, AK | $988 | $1,376 | $1,293 | -6.0% | $1,790 |
Nonmetro areas: 27 (24 up, 3 down). 2-bedroom FY2027 FMRs range from $1,030 to $2,394. County-level figures are in the CSV.
Arizona: -5.3%
About 14% of Arizona residents live where the 2-bedroom FMR went up for FY2027 and 86% live where it went down. Weighted by population, the 2-bedroom FMR moved -5.3% (from about $1,707 to $1,616), rank 51 of 51. Of 14 FMR areas, 1 rose and 13 fell. Largest rise: Tucson, AZ (+0.2%). Largest drop: Flagstaff, AZ (-10.0%). 5 areas hit HUD’s 10% limit on decreases.
| Metro FMR area | 1-BR FY2027 | 2-BR FY2026 | 2-BR FY2027 | 2-BR change | 3-BR FY2027 | Note |
|---|---|---|---|---|---|---|
| Flagstaff, AZ | $1,555 | $1,921 | $1,729 | -10.0% | $2,109 | 10% floor |
| Lake Havasu City-Kingman, AZ | $959 | $1,365 | $1,229 | -10.0% | $1,708 | 10% floor |
| Phoenix-Mesa-Chandler, AZ | $1,493 | $1,839 | $1,734 | -5.7% | $2,287 | |
| Prescott Valley-Prescott, AZ | $1,242 | $1,637 | $1,550 | -5.3% | $2,146 | |
| Sierra Vista-Douglas, AZ | $1,000 | $1,257 | $1,153 | -8.3% | $1,597 | |
| Tucson, AZ | $1,092 | $1,402 | $1,405 | +0.2% | $1,946 | |
| Yuma, AZ | $948 | $1,382 | $1,244 | -10.0% | $1,703 | 10% floor |
Nonmetro areas: 7 (0 up, 7 down). 2-bedroom FY2027 FMRs range from $1,038 to $1,380. County-level figures are in the CSV.
Arkansas: +0.0%
About 56% of Arkansas residents live where the 2-bedroom FMR went up for FY2027 and 44% live where it went down. Weighted by population, the 2-bedroom FMR moved +0.0% (from about $1,067 to $1,061), rank 39 of 51. Of 68 FMR areas, 64 rose and 4 fell. Largest rise: White County, AR (+7.7%). Largest drop: Fayetteville-Springdale-Rogers, AR (-6.8%). 43 areas are set at the minimum FMR, so they move together.
| Metro FMR area | 1-BR FY2027 | 2-BR FY2026 | 2-BR FY2027 | 2-BR change | 3-BR FY2027 | Note |
|---|---|---|---|---|---|---|
| Fayetteville-Springdale-Rogers, AR | $1,056 | $1,347 | $1,256 | -6.8% | $1,739 | |
| Fort Smith, AR-OK | $748 | $937 | $979 | +4.5% | $1,324 | |
| Grant County, AR | $805 | $968 | $909 | -6.1% | $1,196 | state minimum |
| Hot Springs, AR | $863 | $1,090 | $1,110 | +1.8% | $1,424 | |
| Jonesboro, AR | $895 | $1,040 | $1,079 | +3.8% | $1,418 | |
| Little River County, AR | $695 | $880 | $909 | +3.3% | $1,259 | state minimum |
| Little Rock-North Little Rock-Conway, AR | $969 | $1,147 | $1,121 | -2.3% | $1,504 | |
| Memphis, TN-MS-AR | $1,191 | $1,274 | $1,301 | +2.1% | $1,717 | |
| Poinsett County, AR | $695 | $880 | $909 | +3.3% | $1,190 | state minimum |
| Texarkana, TX-Texarkana, AR | $874 | $1,101 | $1,118 | +1.5% | $1,403 |
Nonmetro areas: 58 (57 up, 1 down). 2-bedroom FY2027 FMRs range from $909 to $1,084. County-level figures are in the CSV.
California: -1.1%
About 45% of California residents live where the 2-bedroom FMR went up for FY2027 and 55% live where it went down. Weighted by population, the 2-bedroom FMR moved -1.1% (from about $2,670 to $2,632), rank 42 of 51. Of 51 FMR areas, 27 rose and 24 fell. Largest rise: Stockton-Lodi, CA (+15.7%). Largest drop: Oxnard-Thousand Oaks-Ventura, CA (-10.0%). 2 areas hit HUD’s 10% limit on decreases.
| Metro FMR area | 1-BR FY2027 | 2-BR FY2026 | 2-BR FY2027 | 2-BR change | 3-BR FY2027 | Note |
|---|---|---|---|---|---|---|
| Bakersfield-Delano, CA | $1,273 | $1,483 | $1,656 | +11.7% | $2,293 | |
| Chico, CA | $1,190 | $1,625 | $1,509 | -7.1% | $2,090 | |
| El Centro, CA | $1,030 | $1,362 | $1,347 | -1.1% | $1,819 | |
| Fresno, CA | $1,363 | $1,664 | $1,685 | +1.3% | $2,333 | |
| Hanford-Corcoran, CA | $1,183 | $1,469 | $1,512 | +2.9% | $2,094 | |
| Los Angeles-Long Beach-Glendale, CA | $2,402 | $2,903 | $2,964 | +2.1% | $3,760 | |
| Madera County, CA | $1,272 | $1,376 | $1,460 | +6.1% | $2,022 | |
| Merced, CA | $1,262 | $1,503 | $1,517 | +0.9% | $2,087 | |
| Modesto, CA | $1,378 | $1,758 | $1,803 | +2.6% | $2,410 | |
| Napa, CA | $2,580 | $3,315 | $3,375 | +1.8% | $4,201 | |
| Oakland-Fremont, CA | $2,290 | $2,912 | $2,805 | -3.7% | $3,592 | |
| Oxnard-Thousand Oaks-Ventura, CA | $2,035 | $2,693 | $2,424 | -10.0% | $3,287 | 10% floor |
| Redding, CA | $1,209 | $1,590 | $1,581 | -0.6% | $2,189 | |
| Riverside-San Bernardino-Ontario, CA | $1,705 | $2,201 | $2,103 | -4.5% | $2,771 | |
| Sacramento–Roseville–Arden-Arcade, CA | $1,793 | $2,255 | $2,201 | -2.4% | $2,887 | |
| Salinas, CA | $2,009 | $2,684 | $2,416 | -10.0% | $3,261 | 10% floor |
| San Benito County, CA | $2,296 | $2,902 | $3,004 | +3.5% | $4,160 | |
| San Diego-Chula Vista-Carlsbad, CA | $2,335 | $3,001 | $2,823 | -5.9% | $3,743 | |
| San Francisco, CA | $3,003 | $3,604 | $3,697 | +2.6% | $4,832 | |
| San Jose-Sunnyvale-Santa Clara, CA | $2,778 | $3,483 | $3,272 | -6.1% | $4,396 | |
| San Luis Obispo-Paso Robles, CA | $2,079 | $2,671 | $2,720 | +1.8% | $3,634 | |
| Santa Ana-Anaheim-Irvine, CA | $2,610 | $3,236 | $3,057 | -5.5% | $4,153 | |
| Santa Cruz-Watsonville, CA | $3,390 | $4,214 | $4,254 | +0.9% | $5,531 | |
| Santa Maria-Santa Barbara, CA | $2,711 | $3,124 | $3,106 | -0.6% | $3,990 | |
| Santa Rosa-Petaluma, CA | $2,155 | $2,827 | $2,819 | -0.3% | $3,903 | |
| Stockton-Lodi, CA | $1,628 | $1,742 | $2,015 | +15.7% | $2,790 | |
| Vallejo, CA | $1,876 | $2,178 | $2,342 | +7.5% | $3,053 | |
| Visalia, CA | $1,108 | $1,474 | $1,450 | -1.6% | $1,995 | |
| Yolo, CA | $1,670 | $2,104 | $2,135 | +1.5% | $2,956 | |
| Yuba City, CA | $1,367 | $1,550 | $1,600 | +3.2% | $2,216 |
Nonmetro areas: 21 (11 up, 10 down). 2-bedroom FY2027 FMRs range from $1,084 to $1,927. County-level figures are in the CSV.
Colorado: +2.8%
About 78% of Colorado residents live where the 2-bedroom FMR went up for FY2027 and 22% live where it went down. Weighted by population, the 2-bedroom FMR moved +2.8% (from about $1,865 to $1,916), rank 26 of 51. Of 55 FMR areas, 50 rose and 5 fell. Largest rise: Jackson County, CO (+50.2%). Largest drop: Colorado Springs, CO (-6.6%). 4 areas are set at the minimum FMR, so they move together.
| Metro FMR area | 1-BR FY2027 | 2-BR FY2026 | 2-BR FY2027 | 2-BR change | 3-BR FY2027 | Note |
|---|---|---|---|---|---|---|
| Boulder, CO | $1,735 | $2,124 | $2,033 | -4.3% | $2,703 | |
| Colorado Springs, CO | $1,380 | $1,735 | $1,621 | -6.6% | $2,245 | |
| Denver-Aurora-Centennial, CO | $1,831 | $2,089 | $2,169 | +3.8% | $2,846 | |
| Fort Collins-Loveland, CO | $1,589 | $1,732 | $1,759 | +1.6% | $2,379 | |
| Grand Junction, CO | $1,017 | $1,249 | $1,282 | +2.6% | $1,775 | |
| Greeley, CO | $1,307 | $1,563 | $1,647 | +5.4% | $2,281 | |
| Pueblo, CO | $978 | $1,269 | $1,263 | -0.5% | $1,611 | |
| Teller County, CO | $1,354 | $1,493 | $1,474 | -1.3% | $2,041 |
Nonmetro areas: 47 (46 up, 1 down). 2-bedroom FY2027 FMRs range from $1,014 to $2,766. County-level figures are in the CSV.
Connecticut: +0.6%
About 55% of Connecticut residents live where the 2-bedroom FMR went up for FY2027 and 45% live where it went down. Weighted by population, the 2-bedroom FMR moved +0.6% (from about $2,027 to $2,033), rank 36 of 51. Of 8 FMR areas, 3 rose and 5 fell. Largest rise: New Haven, CT (+6.2%). Largest drop: Bridgeport-Stamford-Danbury, CT (-4.5%).
| Metro FMR area | 1-BR FY2027 | 2-BR FY2026 | 2-BR FY2027 | 2-BR change | 3-BR FY2027 | Note |
|---|---|---|---|---|---|---|
| Bridgeport-Stamford-Danbury, CT | $2,071 | $2,511 | $2,399 | -4.5% | $2,878 | |
| Hartford-West Hartford-East Hartford, CT | $1,543 | $1,865 | $1,933 | +3.6% | $2,303 | |
| New Haven, CT | $1,743 | $1,969 | $2,091 | +6.2% | $2,602 | |
| Norwich-New London-Willimantic, CT | $1,518 | $1,866 | $1,902 | +1.9% | $2,418 | |
| Waterbury-Shelton, CT | $1,336 | $1,788 | $1,745 | -2.4% | $2,184 |
Nonmetro areas: 3 (0 up, 3 down). 2-bedroom FY2027 FMRs range from $1,560 to $1,568. County-level figures are in the CSV.
Delaware: +5.3%
About 100% of Delaware residents live where the 2-bedroom FMR went up for FY2027 and 0% live where it went down. Weighted by population, the 2-bedroom FMR moved +5.3% (from about $1,645 to $1,727), rank 13 of 51. Of 3 FMR areas, 3 rose and 0 fell. Largest rise: Dover, DE (+10.8%). Largest drop: Philadelphia-Camden-Wilmington, PA-NJ-DE-MD (+2.8%).
| Metro FMR area | 1-BR FY2027 | 2-BR FY2026 | 2-BR FY2027 | 2-BR change | 3-BR FY2027 | Note |
|---|---|---|---|---|---|---|
| Dover, DE | $1,294 | $1,470 | $1,629 | +10.8% | $2,244 | |
| Philadelphia-Camden-Wilmington, PA-NJ-DE-MD | $1,558 | $1,810 | $1,860 | +2.8% | $2,216 |
Nonmetro areas: 1 (1 up, 0 down). 2-bedroom FY2027 FMRs range from $1,498 to $1,498. County-level figures are in the CSV.
District of Columbia: +8.5%
About 100% of District of Columbia residents live where the 2-bedroom FMR went up for FY2027 and 0% live where it went down. Weighted by population, the 2-bedroom FMR moved +8.5% (from about $2,246 to $2,438), rank 7 of 51. Of 1 FMR areas, 1 rose and 0 fell. Largest rise: Washington-Arlington-Alexandria, DC-VA-MD (+8.5%). Largest drop: Washington-Arlington-Alexandria, DC-VA-MD (+8.5%).
| Metro FMR area | 1-BR FY2027 | 2-BR FY2026 | 2-BR FY2027 | 2-BR change | 3-BR FY2027 | Note |
|---|---|---|---|---|---|---|
| Washington-Arlington-Alexandria, DC-VA-MD | $2,204 | $2,246 | $2,438 | +8.5% | $3,107 |
Florida: +1.6%
About 49% of Florida residents live where the 2-bedroom FMR went up for FY2027 and 51% live where it went down. Weighted by population, the 2-bedroom FMR moved +1.6% (from about $1,930 to $1,962), rank 32 of 51. Of 52 FMR areas, 17 rose and 35 fell. Largest rise: Port St. Lucie, FL (+17.8%). Largest drop: Bradford County, FL (-10.0%). 19 areas hit HUD’s 10% limit on decreases. 3 areas are set at the minimum FMR, so they move together.
| Metro FMR area | 1-BR FY2027 | 2-BR FY2026 | 2-BR FY2027 | 2-BR change | 3-BR FY2027 | Note |
|---|---|---|---|---|---|---|
| Baker County, FL | $933 | $1,103 | $1,110 | +0.6% | $1,537 | |
| Cape Coral-Fort Myers, FL | $1,564 | $1,961 | $1,835 | -6.4% | $2,373 | |
| Crestview-Fort Walton Beach-Destin, FL | $1,706 | $1,785 | $1,908 | +6.9% | $2,616 | |
| Deltona-Daytona Beach-Ormond Beach, FL | $1,363 | $1,700 | $1,673 | -1.6% | $2,204 | |
| Fort Lauderdale, FL | $1,902 | $2,333 | $2,321 | -0.5% | $3,172 | |
| Gainesville, FL | $1,241 | $1,493 | $1,471 | -1.5% | $1,806 | |
| Homosassa Springs, FL | $988 | $1,225 | $1,194 | -2.5% | $1,653 | |
| Jacksonville, FL | $1,421 | $1,658 | $1,694 | +2.2% | $2,077 | |
| Lakeland-Winter Haven, FL | $1,338 | $1,497 | $1,608 | +7.4% | $2,212 | |
| Levy County, FL | $824 | $974 | $954 | -2.1% | $1,176 | |
| Miami-Miami Beach-Kendall, FL | $2,121 | $2,436 | $2,564 | +5.3% | $3,277 | |
| Naples-Marco Island, FL | $1,870 | $1,986 | $2,036 | +2.5% | $2,584 | |
| North Port-Bradenton-Sarasota, FL | $1,876 | $1,958 | $2,188 | +11.7% | $2,775 | |
| Ocala, FL | $1,201 | $1,373 | $1,394 | +1.5% | $1,836 | |
| Orlando-Kissimmee-Sanford, FL | $1,726 | $1,972 | $1,959 | -0.7% | $2,445 | |
| Palm Bay-Melbourne-Titusville, FL | $1,525 | $1,709 | $1,779 | +4.1% | $2,382 | |
| Palm Coast, FL | $1,376 | $1,806 | $1,758 | -2.7% | $2,361 | |
| Panama City, FL | $1,517 | $1,682 | $1,651 | -1.8% | $2,101 | |
| Pensacola-Ferry Pass-Brent, FL | $1,359 | $1,471 | $1,548 | +5.2% | $2,034 | |
| Port St. Lucie, FL | $1,718 | $1,757 | $2,069 | +17.8% | $2,801 | |
| Punta Gorda, FL | $1,204 | $1,470 | $1,575 | +7.1% | $2,137 | |
| Sebastian-Vero Beach-West Vero Corridor, FL | $1,179 | $1,604 | $1,542 | -3.9% | $1,882 | |
| Sebring, FL | $1,022 | $1,271 | $1,259 | -0.9% | $1,500 | |
| Tallahassee, FL | $1,264 | $1,352 | $1,424 | +5.3% | $1,742 | |
| Tampa-St. Petersburg-Clearwater, FL | $1,648 | $1,977 | $1,917 | -3.0% | $2,448 | |
| Wakulla County, FL | $1,140 | $1,199 | $1,283 | +7.0% | $1,529 | |
| Walton County, FL | $1,354 | $1,364 | $1,474 | +8.1% | $2,041 | |
| Washington County, FL | $955 | $1,017 | $1,040 | +2.3% | $1,243 | |
| West Palm Beach-Boca Raton, FL | $2,008 | $2,254 | $2,349 | +4.2% | $3,052 | |
| Wildwood-The Villages, FL | $1,139 | $1,328 | $1,324 | -0.3% | $1,606 |
Nonmetro areas: 22 (0 up, 22 down). 2-bedroom FY2027 FMRs range from $953 to $2,254. County-level figures are in the CSV.
Georgia: -1.0%
About 28% of Georgia residents live where the 2-bedroom FMR went up for FY2027 and 72% live where it went down. Weighted by population, the 2-bedroom FMR moved -1.0% (from about $1,552 to $1,528), rank 41 of 51. Of 112 FMR areas, 86 rose and 26 fell. Largest rise: Charlton County, GA (+14.9%). Largest drop: Morgan County, GA (-8.0%). 66 areas are set at the minimum FMR, so they move together.
| Metro FMR area | 1-BR FY2027 | 2-BR FY2026 | 2-BR FY2027 | 2-BR change | 3-BR FY2027 | Note |
|---|---|---|---|---|---|---|
| Albany, GA | $972 | $1,129 | $1,103 | -2.3% | $1,482 | |
| Athens-Clarke County, GA | $1,103 | $1,331 | $1,285 | -3.5% | $1,610 | |
| Atlanta-Sandy Springs-Roswell, GA | $1,619 | $1,820 | $1,762 | -3.2% | $2,099 | |
| Augusta-Richmond County, GA-SC | $1,202 | $1,261 | $1,329 | +5.4% | $1,672 | |
| Brunswick-St. Simons, GA | $1,114 | $1,293 | $1,378 | +6.6% | $1,642 | |
| Butts County, GA | $920 | $1,075 | $1,002 | -6.8% | $1,376 | state minimum |
| Chattanooga, TN-GA | $1,231 | $1,390 | $1,340 | -3.6% | $1,657 | |
| Columbus, GA-AL | $1,053 | $1,088 | $1,212 | +11.4% | $1,611 | |
| Dalton, GA | $1,009 | $1,121 | $1,127 | +0.5% | $1,470 | |
| Gainesville, GA | $1,417 | $1,514 | $1,543 | +1.9% | $1,860 | |
| Haralson County, GA | $782 | $1,107 | $1,023 | -7.6% | $1,219 | |
| Hinesville, GA | $1,228 | $1,406 | $1,396 | -0.7% | $1,815 | |
| Lincoln County, GA | $784 | $995 | $1,026 | +3.1% | $1,343 | |
| Long County, GA | $1,067 | $1,133 | $1,163 | +2.6% | $1,395 | |
| Lumpkin County, GA | $1,055 | $1,245 | $1,148 | -7.8% | $1,445 | |
| Macon-Bibb County, GA | $1,162 | $1,307 | $1,309 | +0.2% | $1,560 | |
| Meriwether County, GA | $766 | $1,001 | $1,002 | +0.1% | $1,387 | state minimum |
| Monroe County, GA | $1,057 | $1,174 | $1,151 | -2.0% | $1,371 | |
| Morgan County, GA | $1,219 | $1,442 | $1,327 | -8.0% | $1,581 | |
| Murray County, GA | $784 | $1,009 | $1,006 | -0.3% | $1,385 | |
| Peach County, GA | $1,027 | $1,129 | $1,118 | -1.0% | $1,437 | |
| Rome, GA | $972 | $1,192 | $1,204 | +1.0% | $1,576 | |
| Savannah, GA | $1,542 | $1,680 | $1,679 | -0.1% | $2,185 | |
| Stewart County, GA | $875 | $973 | $1,002 | +3.0% | $1,334 | state minimum |
| Talbot County, GA | $875 | $973 | $1,002 | +3.0% | $1,387 | state minimum |
| Valdosta, GA | $904 | $1,192 | $1,179 | -1.1% | $1,575 | |
| Warner Robins, GA | $1,248 | $1,362 | $1,396 | +2.5% | $1,860 |
Nonmetro areas: 85 (73 up, 12 down). 2-bedroom FY2027 FMRs range from $1,002 to $1,300. County-level figures are in the CSV.
Hawaii: -3.0%
About 26% of Hawaii residents live where the 2-bedroom FMR went up for FY2027 and 74% live where it went down. Weighted by population, the 2-bedroom FMR moved -3.0% (from about $2,544 to $2,467), rank 49 of 51. Of 5 FMR areas, 2 rose and 3 fell. Largest rise: Kahului-Wailuku-Lahaina, HI (+1.2%). Largest drop: Kauai County, HI (-9.7%).
| Metro FMR area | 1-BR FY2027 | 2-BR FY2026 | 2-BR FY2027 | 2-BR change | 3-BR FY2027 | Note |
|---|---|---|---|---|---|---|
| Kahului-Wailuku-Lahaina, HI | $2,030 | $2,624 | $2,656 | +1.2% | $3,351 | |
| Kalawao County, HI | $1,778 | $2,492 | $2,326 | -6.7% | $2,932 | |
| Urban Honolulu, HI | $1,951 | $2,642 | $2,542 | -3.8% | $3,520 |
Nonmetro areas: 2 (1 up, 1 down). 2-bedroom FY2027 FMRs range from $2,081 to $2,105. County-level figures are in the CSV.
Idaho: -1.9%
About 36% of Idaho residents live where the 2-bedroom FMR went up for FY2027 and 62% live where it went down. Weighted by population, the 2-bedroom FMR moved -1.9% (from about $1,406 to $1,367), rank 46 of 51. Of 40 FMR areas, 32 rose and 7 fell. Largest rise: Bear Lake County, ID (+8.6%). Largest drop: Butte County, ID (-10.0%). 2 areas hit HUD’s 10% limit on decreases. 6 areas are set at the minimum FMR, so they move together.
| Metro FMR area | 1-BR FY2027 | 2-BR FY2026 | 2-BR FY2027 | 2-BR change | 3-BR FY2027 | Note |
|---|---|---|---|---|---|---|
| Boise City, ID | $1,295 | $1,655 | $1,540 | -6.9% | $2,132 | |
| Butte County, ID | $985 | $1,304 | $1,174 | -10.0% | $1,633 | 10% floor |
| Coeur d'Alene, ID | $1,290 | $1,547 | $1,507 | -2.6% | $2,087 | |
| Gem County, ID | $969 | $1,190 | $1,071 | -10.0% | $1,461 | 10% floor |
| Idaho Falls, ID | $1,064 | $1,305 | $1,274 | -2.4% | $1,764 | |
| Jerome County, ID | $913 | $1,186 | $1,166 | -1.7% | $1,605 | |
| Lewiston, ID-WA | $943 | $1,220 | $1,234 | +1.1% | $1,709 | |
| Logan, UT-ID | $967 | $1,241 | $1,265 | +1.9% | $1,752 | |
| Pocatello, ID | $956 | $1,173 | $1,251 | +6.6% | $1,732 | |
| Twin Falls County, ID | $982 | $1,284 | $1,285 | +0.1% | $1,779 |
Nonmetro areas: 30 (28 up, 1 down). 2-bedroom FY2027 FMRs range from $1,014 to $1,673. County-level figures are in the CSV.
Illinois: +9.8%
About 89% of Illinois residents live where the 2-bedroom FMR went up for FY2027 and 11% live where it went down. Weighted by population, the 2-bedroom FMR moved +9.8% (from about $1,557 to $1,724), rank 2 of 51. Of 83 FMR areas, 64 rose and 19 fell. Largest rise: Peoria, IL (+16.7%). Largest drop: Davenport-Moline-Rock Island, IA-IL (-7.6%). 41 areas are set at the minimum FMR, so they move together.
| Metro FMR area | 1-BR FY2027 | 2-BR FY2026 | 2-BR FY2027 | 2-BR change | 3-BR FY2027 | Note |
|---|---|---|---|---|---|---|
| Bloomington, IL | $996 | $1,302 | $1,287 | -1.2% | $1,685 | |
| Bond County, IL | $899 | $916 | $979 | +6.9% | $1,275 | |
| Cape Girardeau, MO-IL | $833 | $992 | $1,012 | +2.0% | $1,401 | |
| Champaign-Urbana, IL | $996 | $1,122 | $1,173 | +4.5% | $1,474 | |
| Chicago-Joliet-Naperville, IL | $1,780 | $1,781 | $2,011 | +12.9% | $2,586 | |
| Davenport-Moline-Rock Island, IA-IL | $852 | $1,143 | $1,056 | -7.6% | $1,396 | |
| DeKalb County, IL | $1,155 | $1,373 | $1,481 | +7.9% | $2,006 | |
| Decatur, IL | $857 | $1,063 | $1,091 | +2.6% | $1,407 | |
| Ford County, IL | $711 | $916 | $930 | +1.5% | $1,288 | state minimum |
| Grundy County, IL | $1,233 | $1,459 | $1,613 | +10.6% | $2,219 | |
| Kankakee, IL | $1,031 | $1,326 | $1,349 | +1.7% | $1,775 | |
| Kendall County, IL | $1,790 | $2,050 | $2,341 | +14.2% | $3,042 | |
| Macoupin County, IL | $748 | $916 | $978 | +6.8% | $1,191 | |
| Massac County, IL | $766 | $969 | $993 | +2.5% | $1,375 | |
| Peoria, IL | $961 | $1,039 | $1,212 | +16.7% | $1,557 | |
| Rockford, IL | $896 | $1,175 | $1,172 | -0.3% | $1,542 | |
| Springfield, IL | $977 | $1,203 | $1,237 | +2.8% | $1,631 | |
| St. Louis, MO-IL | $1,104 | $1,218 | $1,349 | +10.8% | $1,731 |
Nonmetro areas: 65 (49 up, 16 down). 2-bedroom FY2027 FMRs range from $930 to $1,095. County-level figures are in the CSV.
Indiana: +5.6%
About 96% of Indiana residents live where the 2-bedroom FMR went up for FY2027 and 4% live where it went down. Weighted by population, the 2-bedroom FMR moved +5.6% (from about $1,235 to $1,302), rank 11 of 51. Of 73 FMR areas, 72 rose and 1 fell. Largest rise: Jasper County, IN (+14.9%). Largest drop: South Bend-Mishawaka, IN (-1.2%). 30 areas are set at the minimum FMR, so they move together.
| Metro FMR area | 1-BR FY2027 | 2-BR FY2026 | 2-BR FY2027 | 2-BR change | 3-BR FY2027 | Note |
|---|---|---|---|---|---|---|
| Anderson, IN | $1,017 | $1,206 | $1,331 | +10.4% | $1,743 | |
| Bloomington, IN | $1,096 | $1,210 | $1,252 | +3.5% | $1,601 | |
| Carroll County, IN | $787 | $973 | $1,027 | +5.5% | $1,232 | |
| Cincinnati, OH-KY-IN | $1,128 | $1,353 | $1,442 | +6.6% | $1,897 | |
| Columbus, IN | $1,276 | $1,415 | $1,493 | +5.5% | $1,779 | |
| Elkhart-Goshen, IN | $1,048 | $1,183 | $1,253 | +5.9% | $1,653 | |
| Evansville, IN | $872 | $1,113 | $1,127 | +1.3% | $1,387 | |
| Fort Wayne, IN | $1,026 | $1,113 | $1,248 | +12.1% | $1,534 | |
| Franklin County, IN | $950 | $1,117 | $1,148 | +2.8% | $1,503 | |
| Gary, IN | $1,176 | $1,317 | $1,429 | +8.5% | $1,739 | |
| Indianapolis-Carmel, IN | $1,336 | $1,473 | $1,536 | +4.3% | $1,991 | |
| Jasper County, IN | $1,031 | $1,174 | $1,349 | +14.9% | $1,741 | |
| Kokomo, IN | $915 | $1,123 | $1,179 | +5.0% | $1,420 | |
| Lafayette-West Lafayette, IN | $1,070 | $1,242 | $1,273 | +2.5% | $1,517 | |
| Louisville, KY-IN | $1,058 | $1,272 | $1,276 | +0.3% | $1,629 | |
| Michigan City-La Porte, IN | $1,031 | $1,152 | $1,245 | +8.1% | $1,525 | |
| Muncie, IN | $913 | $1,043 | $1,145 | +9.8% | $1,438 | |
| Owen County, IN | $914 | $956 | $1,014 | +6.1% | $1,244 | state minimum |
| South Bend-Mishawaka, IN | $1,093 | $1,292 | $1,276 | -1.2% | $1,545 | |
| Sullivan County, IN | $816 | $1,028 | $1,067 | +3.8% | $1,370 | |
| Terre Haute, IN | $896 | $1,094 | $1,164 | +6.4% | $1,387 | |
| Tipton County, IN | $947 | $1,109 | $1,239 | +11.7% | $1,476 | |
| Warren County, IN | $892 | $956 | $1,014 | +6.1% | $1,328 | state minimum |
| Washington County, IN | $775 | $988 | $1,014 | +2.6% | $1,222 | state minimum |
| Wells County, IN | $842 | $991 | $1,102 | +11.2% | $1,342 |
Nonmetro areas: 48 (48 up, 0 down). 2-bedroom FY2027 FMRs range from $1,014 to $1,162. County-level figures are in the CSV.
Iowa: +1.1%
About 76% of Iowa residents live where the 2-bedroom FMR went up for FY2027 and 23% live where it went down. Weighted by population, the 2-bedroom FMR moved +1.1% (from about $1,099 to $1,113), rank 34 of 51. Of 92 FMR areas, 80 rose and 11 fell. Largest rise: Omaha-Council Bluffs, NE-IA (+6.0%). Largest drop: Ames, IA (-8.0%). 50 areas are set at the minimum FMR, so they move together.
| Metro FMR area | 1-BR FY2027 | 2-BR FY2026 | 2-BR FY2027 | 2-BR change | 3-BR FY2027 | Note |
|---|---|---|---|---|---|---|
| Ames, IA | $944 | $1,153 | $1,061 | -8.0% | $1,469 | |
| Benton County, IA | $751 | $956 | $982 | +2.7% | $1,267 | |
| Boone County, IA | $768 | $1,026 | $967 | -5.8% | $1,339 | |
| Bremer County, IA | $782 | $978 | $1,023 | +4.6% | $1,343 | |
| Cedar Rapids, IA | $806 | $1,071 | $1,054 | -1.6% | $1,459 | |
| Davenport-Moline-Rock Island, IA-IL | $852 | $1,143 | $1,056 | -7.6% | $1,396 | |
| Des Moines-West Des Moines, IA | $1,145 | $1,318 | $1,360 | +3.2% | $1,856 | |
| Dubuque, IA | $891 | $1,077 | $1,131 | +5.0% | $1,516 | |
| Iowa City, IA | $1,002 | $1,141 | $1,180 | +3.4% | $1,634 | |
| Jasper County, IA | $787 | $1,008 | $989 | -1.9% | $1,330 | |
| Jones County, IA | $734 | $919 | $927 | +0.9% | $1,214 | state minimum |
| Omaha-Council Bluffs, NE-IA | $1,219 | $1,368 | $1,450 | +6.0% | $1,924 | |
| Sioux City, IA-NE-SD | $965 | $1,154 | $1,194 | +3.5% | $1,447 | |
| Washington County, IA | $766 | $962 | $1,002 | +4.2% | $1,278 | |
| Waterloo-Cedar Falls, IA | $838 | $1,051 | $1,096 | +4.3% | $1,401 |
Nonmetro areas: 77 (70 up, 6 down). 2-bedroom FY2027 FMRs range from $927 to $1,104. County-level figures are in the CSV.
Kansas: +7.5%
About 78% of Kansas residents live where the 2-bedroom FMR went up for FY2027 and 22% live where it went down. Weighted by population, the 2-bedroom FMR moved +7.5% (from about $1,124 to $1,212), rank 8 of 51. Of 94 FMR areas, 91 rose and 3 fell. Largest rise: Dickinson County, KS (+16.3%). Largest drop: Wichita, KS (-5.1%). 64 areas are set at the minimum FMR, so they move together.
| Metro FMR area | 1-BR FY2027 | 2-BR FY2026 | 2-BR FY2027 | 2-BR change | 3-BR FY2027 | Note |
|---|---|---|---|---|---|---|
| Cherokee County, KS | $735 | $877 | $961 | +9.6% | $1,258 | state minimum |
| Geary County, KS | $945 | $1,048 | $1,096 | +4.6% | $1,518 | |
| Kansas City, MO-KS | $1,366 | $1,358 | $1,546 | +13.8% | $2,020 | |
| Lawrence, KS | $1,103 | $1,182 | $1,272 | +7.6% | $1,761 | |
| Manhattan, KS | $924 | $1,068 | $1,107 | +3.7% | $1,533 | |
| St. Joseph, MO-KS | $857 | $1,077 | $1,101 | +2.2% | $1,406 | |
| Sumner County, KS | $800 | $1,065 | $1,046 | -1.8% | $1,277 | |
| Topeka, KS | $913 | $1,057 | $1,172 | +10.9% | $1,564 | |
| Wichita, KS | $823 | $1,099 | $1,043 | -5.1% | $1,382 |
Nonmetro areas: 85 (84 up, 1 down). 2-bedroom FY2027 FMRs range from $961 to $1,530. County-level figures are in the CSV.
Kentucky: +4.6%
About 94% of Kentucky residents live where the 2-bedroom FMR went up for FY2027 and 6% live where it went down. Weighted by population, the 2-bedroom FMR moved +4.6% (from about $1,106 to $1,155), rank 14 of 51. Of 101 FMR areas, 95 rose and 6 fell. Largest rise: Trimble County, KY (+17.4%). Largest drop: Hancock County, KY (-5.3%). 55 areas are set at the minimum FMR, so they move together.
| Metro FMR area | 1-BR FY2027 | 2-BR FY2026 | 2-BR FY2027 | 2-BR change | 3-BR FY2027 | Note |
|---|---|---|---|---|---|---|
| Allen County, KY | $779 | $996 | $1,019 | +2.3% | $1,293 | |
| Ballard County, KY | $902 | $1,072 | $1,180 | +10.1% | $1,406 | |
| Bowling Green, KY | $1,020 | $1,153 | $1,199 | +4.0% | $1,438 | |
| Butler County, KY | $695 | $866 | $909 | +5.0% | $1,190 | state minimum |
| Carlisle County, KY | $798 | $915 | $932 | +1.9% | $1,272 | |
| Carter County, KY | $749 | $866 | $909 | +5.0% | $1,246 | state minimum |
| Cincinnati, OH-KY-IN | $1,128 | $1,353 | $1,442 | +6.6% | $1,897 | |
| Clarksville, TN-KY | $1,068 | $1,346 | $1,307 | -2.9% | $1,786 | |
| Elizabethtown, KY | $866 | $1,056 | $1,087 | +2.9% | $1,505 | |
| Grant County, KY | $899 | $1,155 | $1,146 | -0.8% | $1,365 | |
| Huntington-Ashland, WV-KY-OH | $864 | $973 | $1,006 | +3.4% | $1,287 | |
| Lawrence County, KY | $799 | $926 | $971 | +4.9% | $1,157 | |
| Lexington-Fayette, KY | $1,205 | $1,272 | $1,416 | +11.3% | $1,948 | |
| Livingston County, KY | $937 | $1,158 | $1,220 | +5.4% | $1,454 | |
| Louisville, KY-IN | $1,058 | $1,272 | $1,276 | +0.3% | $1,629 | |
| McCracken County, KY | $924 | $1,058 | $1,131 | +6.9% | $1,348 | |
| Meade County, KY | $804 | $1,075 | $1,052 | -2.1% | $1,443 | |
| Nelson County, KY | $781 | $1,016 | $1,022 | +0.6% | $1,302 | |
| Owensboro, KY | $870 | $1,110 | $1,138 | +2.5% | $1,507 | |
| Shelby County, KY | $998 | $1,143 | $1,149 | +0.5% | $1,369 |
Nonmetro areas: 81 (78 up, 3 down). 2-bedroom FY2027 FMRs range from $909 to $1,175. County-level figures are in the CSV.
Louisiana: +2.9%
About 61% of Louisiana residents live where the 2-bedroom FMR went up for FY2027 and 39% live where it went down. Weighted by population, the 2-bedroom FMR moved +2.9% (from about $1,128 to $1,161), rank 24 of 51. Of 45 FMR areas, 38 rose and 7 fell. Largest rise: St. James Parish, LA (+26.5%). Largest drop: Shreveport-Bossier City, LA (-5.9%). 20 areas are set at the minimum FMR, so they move together.
| Metro FMR area | 1-BR FY2027 | 2-BR FY2026 | 2-BR FY2027 | 2-BR change | 3-BR FY2027 | Note |
|---|---|---|---|---|---|---|
| Acadia Parish, LA | $690 | $880 | $902 | +2.5% | $1,075 | |
| Alexandria, LA | $796 | $994 | $995 | +0.1% | $1,341 | |
| Assumption Parish, LA | $762 | $967 | $932 | -3.6% | $1,242 | |
| Baton Rouge, LA | $1,014 | $1,204 | $1,149 | -4.6% | $1,456 | |
| Hammond, LA | $854 | $1,099 | $1,097 | -0.2% | $1,384 | |
| Houma-Bayou Cane-Thibodaux, LA | $903 | $1,102 | $1,098 | -0.4% | $1,335 | |
| Iberville Parish, LA | $819 | $866 | $892 | +3.0% | $1,235 | state minimum |
| Jefferson Davis Parish, LA | $704 | $871 | $921 | +5.7% | $1,217 | |
| Lafayette, LA | $971 | $1,019 | $1,092 | +7.2% | $1,375 | |
| Lake Charles, LA | $941 | $1,217 | $1,231 | +1.2% | $1,467 | |
| Monroe, LA | $794 | $1,026 | $1,017 | -0.9% | $1,314 | |
| Morehouse Parish, LA | $710 | $834 | $892 | +7.0% | $1,175 | state minimum |
| New Orleans-Metairie, LA | $1,229 | $1,331 | $1,480 | +11.2% | $1,900 | |
| Richland Parish, LA | $785 | $944 | $975 | +3.3% | $1,162 | |
| Shreveport-Bossier City, LA | $926 | $1,111 | $1,045 | -5.9% | $1,380 | |
| Slidell-Mandeville-Covington, LA | $1,164 | $1,331 | $1,354 | +1.7% | $1,745 | |
| St. James Parish, LA | $891 | $921 | $1,165 | +26.5% | $1,613 | |
| Vermilion Parish, LA | $826 | $834 | $899 | +7.8% | $1,177 |
Nonmetro areas: 27 (26 up, 1 down). 2-bedroom FY2027 FMRs range from $892 to $1,102. County-level figures are in the CSV.
Maine: +2.9%
About 60% of Maine residents live where the 2-bedroom FMR went up for FY2027 and 40% live where it went down. Weighted by population, the 2-bedroom FMR moved +2.9% (from about $1,651 to $1,714), rank 25 of 51. Of 19 FMR areas, 8 rose and 11 fell. Largest rise: Portland, ME (+10.5%). Largest drop: Lincoln County, ME (-6.8%).
| Metro FMR area | 1-BR FY2027 | 2-BR FY2026 | 2-BR FY2027 | 2-BR change | 3-BR FY2027 | Note |
|---|---|---|---|---|---|---|
| Bangor, ME | $1,380 | $1,659 | $1,722 | +3.8% | $2,203 | |
| Cumberland County, ME (part) | $1,561 | $1,833 | $1,941 | +5.9% | $2,425 | |
| Lewiston-Auburn, ME | $1,282 | $1,586 | $1,677 | +5.7% | $2,119 | |
| Penobscot County, ME (part) | $1,144 | $1,392 | $1,496 | +7.5% | $2,039 | |
| Portland, ME | $1,864 | $2,130 | $2,353 | +10.5% | $2,902 | |
| Sagadahoc County, ME | $1,332 | $1,577 | $1,659 | +5.2% | $2,297 | |
| York County, ME (part) | $1,500 | $1,716 | $1,792 | +4.4% | $2,464 | |
| York-Kittery-South Berwick, ME | $1,816 | $2,202 | $2,376 | +7.9% | $2,831 |
Nonmetro areas: 11 (0 up, 11 down). 2-bedroom FY2027 FMRs range from $1,175 to $1,503. County-level figures are in the CSV.
Maryland: +7.1%
About 95% of Maryland residents live where the 2-bedroom FMR went up for FY2027 and 5% live where it went down. Weighted by population, the 2-bedroom FMR moved +7.1% (from about $1,958 to $2,103), rank 9 of 51. Of 15 FMR areas, 10 rose and 5 fell. Largest rise: Washington-Arlington-Alexandria, DC-VA-MD (+8.5%). Largest drop: Calvert County, MD (-9.3%). 2 areas are set at the minimum FMR, so they move together.
| Metro FMR area | 1-BR FY2027 | 2-BR FY2026 | 2-BR FY2027 | 2-BR change | 3-BR FY2027 | Note |
|---|---|---|---|---|---|---|
| Baltimore-Columbia-Towson, MD | $1,625 | $1,857 | $2,006 | +8.0% | $2,509 | |
| Calvert County, MD | $1,666 | $2,083 | $1,890 | -9.3% | $2,617 | |
| Hagerstown, MD | $982 | $1,261 | $1,284 | +1.8% | $1,714 | |
| Philadelphia-Camden-Wilmington, PA-NJ-DE-MD | $1,558 | $1,810 | $1,860 | +2.8% | $2,216 | |
| Salisbury, MD | $1,102 | $1,378 | $1,428 | +3.6% | $1,870 | |
| Somerset County, MD | $910 | $1,167 | $1,144 | -2.0% | $1,498 | |
| St. Mary's County, MD | $1,642 | $1,833 | $1,787 | -2.5% | $2,242 | |
| Washington-Arlington-Alexandria, DC-VA-MD | $2,204 | $2,246 | $2,438 | +8.5% | $3,107 |
Nonmetro areas: 7 (5 up, 2 down). 2-bedroom FY2027 FMRs range from $1,014 to $1,421. County-level figures are in the CSV.
Massachusetts: +3.1%
About 91% of Massachusetts residents live where the 2-bedroom FMR went up for FY2027 and 9% live where it went down. Weighted by population, the 2-bedroom FMR moved +3.1% (from about $2,494 to $2,565), rank 22 of 51. Of 20 FMR areas, 18 rose and 2 fell. Largest rise: Eastern Worcester County, MA (+15.4%). Largest drop: Dukes County, MA (-6.2%).
| Metro FMR area | 1-BR FY2027 | 2-BR FY2026 | 2-BR FY2027 | 2-BR change | 3-BR FY2027 | Note |
|---|---|---|---|---|---|---|
| Amherst Town-Northampton, MA | $1,593 | $2,004 | $2,034 | +1.5% | $2,663 | |
| Barnstable Town, MA | $1,902 | $2,422 | $2,488 | +2.7% | $3,121 | |
| Berkshire County, MA (part) | $1,348 | $1,709 | $1,763 | +3.2% | $2,409 | |
| Boston-Cambridge-Quincy, MA-NH | $2,518 | $2,941 | $3,008 | +2.3% | $3,584 | |
| Brockton, MA | $1,842 | $2,311 | $2,409 | +4.2% | $3,015 | |
| Eastern Worcester County, MA | $1,910 | $2,166 | $2,499 | +15.4% | $3,424 | |
| Easton-Raynham, MA | $2,209 | $2,550 | $2,589 | +1.5% | $3,085 | |
| Fitchburg-Leominster, MA | $1,571 | $1,749 | $1,900 | +8.6% | $2,419 | |
| Lawrence, MA-NH | $1,809 | $2,270 | $2,367 | +4.3% | $2,820 | |
| Lowell, MA | $1,831 | $2,351 | $2,383 | +1.4% | $2,878 | |
| New Bedford, MA | $1,305 | $1,527 | $1,668 | +9.2% | $1,987 | |
| Pittsfield, MA | $1,324 | $1,626 | $1,704 | +4.8% | $2,231 | |
| Providence-Fall River, RI-MA | $1,509 | $1,729 | $1,879 | +8.7% | $2,302 | |
| Springfield, MA | $1,421 | $1,734 | $1,800 | +3.8% | $2,241 | |
| Taunton-Mansfield-Norton, MA | $1,666 | $2,078 | $2,179 | +4.9% | $2,596 | |
| Western Worcester County, MA | $1,288 | $1,532 | $1,659 | +8.3% | $2,297 | |
| Worcester, MA | $1,587 | $2,056 | $2,043 | -0.6% | $2,560 |
Nonmetro areas: 3 (2 up, 1 down). 2-bedroom FY2027 FMRs range from $1,882 to $3,583. County-level figures are in the CSV.
Michigan: +3.8%
About 93% of Michigan residents live where the 2-bedroom FMR went up for FY2027 and 7% live where it went down. Weighted by population, the 2-bedroom FMR moved +3.8% (from about $1,310 to $1,361), rank 18 of 51. Of 77 FMR areas, 70 rose and 7 fell. Largest rise: Branch County, MI (+12.3%). Largest drop: Niles, MI (-2.7%). 24 areas are set at the minimum FMR, so they move together.
| Metro FMR area | 1-BR FY2027 | 2-BR FY2026 | 2-BR FY2027 | 2-BR change | 3-BR FY2027 | Note |
|---|---|---|---|---|---|---|
| Ann Arbor, MI | $1,503 | $1,656 | $1,804 | +8.9% | $2,164 | |
| Barry County, MI | $1,041 | $1,334 | $1,362 | +2.1% | $1,704 | |
| Battle Creek, MI | $1,032 | $1,176 | $1,233 | +4.8% | $1,469 | |
| Bay City, MI | $835 | $1,030 | $1,055 | +2.4% | $1,429 | |
| Benzie County, MI | $943 | $1,224 | $1,234 | +0.8% | $1,635 | |
| Cass County, MI | $974 | $993 | $1,095 | +10.3% | $1,393 | |
| Detroit-Warren-Livonia, MI | $1,167 | $1,411 | $1,459 | +3.4% | $1,777 | |
| Flint, MI | $939 | $1,033 | $1,133 | +9.7% | $1,391 | |
| Grand Rapids-Wyoming, MI | $1,365 | $1,531 | $1,630 | +6.5% | $2,113 | |
| Grand Traverse County, MI | $1,188 | $1,357 | $1,436 | +5.8% | $1,883 | |
| Holland-Grand Haven, MI | $1,357 | $1,519 | $1,546 | +1.8% | $1,947 | |
| Ionia County, MI | $946 | $1,209 | $1,238 | +2.4% | $1,579 | |
| Jackson, MI | $984 | $1,165 | $1,201 | +3.1% | $1,576 | |
| Kalamazoo-Portage, MI | $1,013 | $1,162 | $1,158 | -0.3% | $1,545 | |
| Kalkaska County, MI | $818 | $973 | $1,014 | +4.2% | $1,404 | state minimum |
| Lansing-East Lansing, MI | $1,054 | $1,268 | $1,323 | +4.3% | $1,685 | |
| Leelanau County, MI | $1,316 | $1,497 | $1,500 | +0.2% | $1,787 | |
| Livingston County, MI | $1,291 | $1,457 | $1,477 | +1.4% | $2,045 | |
| Midland, MI | $936 | $1,193 | $1,205 | +1.0% | $1,498 | |
| Monroe, MI | $997 | $1,326 | $1,304 | -1.7% | $1,595 | |
| Montcalm County, MI | $1,001 | $1,203 | $1,181 | -1.8% | $1,450 | |
| Muskegon-Norton Shores, MI | $982 | $1,236 | $1,285 | +4.0% | $1,534 | |
| Niles, MI | $887 | $1,184 | $1,152 | -2.7% | $1,512 | |
| Saginaw, MI | $893 | $1,117 | $1,141 | +2.1% | $1,466 |
Nonmetro areas: 53 (50 up, 3 down). 2-bedroom FY2027 FMRs range from $1,014 to $1,336. County-level figures are in the CSV.
Minnesota: +2.2%
About 93% of Minnesota residents live where the 2-bedroom FMR went up for FY2027 and 7% live where it went down. Weighted by population, the 2-bedroom FMR moved +2.2% (from about $1,478 to $1,507), rank 29 of 51. Of 73 FMR areas, 68 rose and 5 fell. Largest rise: La Crosse-Onalaska, WI-MN (+15.2%). Largest drop: Grand Forks, ND-MN (-6.9%). 35 areas are set at the minimum FMR, so they move together.
| Metro FMR area | 1-BR FY2027 | 2-BR FY2026 | 2-BR FY2027 | 2-BR change | 3-BR FY2027 | Note |
|---|---|---|---|---|---|---|
| Duluth, MN-WI | $961 | $1,232 | $1,207 | -2.0% | $1,671 | |
| Fargo, ND-MN | $903 | $1,112 | $1,104 | -0.7% | $1,529 | |
| Fillmore County, MN | $775 | $1,022 | $1,014 | -0.8% | $1,328 | state minimum |
| Grand Forks, ND-MN | $821 | $1,089 | $1,014 | -6.9% | $1,404 | state minimum |
| La Crosse-Onalaska, WI-MN | $1,027 | $1,166 | $1,343 | +15.2% | $1,721 | |
| Le Sueur County, MN | $839 | $1,078 | $1,098 | +1.9% | $1,520 | |
| Mankato, MN | $1,023 | $1,171 | $1,230 | +5.0% | $1,703 | |
| Mille Lacs County, MN | $870 | $1,123 | $1,124 | +0.1% | $1,351 | |
| Minneapolis-St. Paul-Bloomington, MN-WI | $1,427 | $1,709 | $1,734 | +1.5% | $2,264 | |
| Rochester, MN | $1,226 | $1,407 | $1,422 | +1.1% | $1,969 | |
| Rock County, MN | $775 | $973 | $1,014 | +4.2% | $1,404 | state minimum |
| St. Cloud, MN | $961 | $1,206 | $1,233 | +2.2% | $1,656 | |
| Wabasha County, MN | $931 | $1,001 | $1,014 | +1.3% | $1,328 | state minimum |
Nonmetro areas: 60 (59 up, 1 down). 2-bedroom FY2027 FMRs range from $1,014 to $1,358. County-level figures are in the CSV.
Mississippi: +5.5%
About 98% of Mississippi residents live where the 2-bedroom FMR went up for FY2027 and 2% live where it went down. Weighted by population, the 2-bedroom FMR moved +5.5% (from about $1,035 to $1,087), rank 12 of 51. Of 76 FMR areas, 73 rose and 3 fell. Largest rise: Hattiesburg, MS (+25.7%). Largest drop: Tunica County, MS (-2.5%). 48 areas are set at the minimum FMR, so they move together.
| Metro FMR area | 1-BR FY2027 | 2-BR FY2026 | 2-BR FY2027 | 2-BR change | 3-BR FY2027 | Note |
|---|---|---|---|---|---|---|
| Benton County, MS | $827 | $842 | $905 | +7.5% | $1,127 | state minimum |
| Gulfport-Biloxi, MS | $982 | $1,140 | $1,185 | +3.9% | $1,525 | |
| Hattiesburg, MS | $1,117 | $1,047 | $1,316 | +25.7% | $1,676 | |
| Holmes County, MS | $831 | $842 | $905 | +7.5% | $1,253 | state minimum |
| Jackson, MS | $1,105 | $1,288 | $1,289 | +0.1% | $1,536 | |
| Marshall County, MS | $845 | $1,110 | $1,106 | -0.4% | $1,318 | |
| Memphis, TN-MS-AR | $1,191 | $1,274 | $1,301 | +2.1% | $1,717 | |
| Pascagoula, MS | $966 | $1,067 | $1,099 | +3.0% | $1,506 | |
| Scott County, MS | $849 | $952 | $1,026 | +7.8% | $1,222 | |
| Simpson County, MS | $831 | $858 | $905 | +5.5% | $1,253 | state minimum |
| Stone County, MS | $882 | $969 | $1,047 | +8.0% | $1,248 | |
| Tate County, MS | $842 | $1,089 | $1,101 | +1.1% | $1,322 | |
| Tunica County, MS | $1,062 | $1,186 | $1,156 | -2.5% | $1,377 | |
| Yazoo County, MS | $777 | $984 | $1,016 | +3.3% | $1,330 |
Nonmetro areas: 62 (61 up, 1 down). 2-bedroom FY2027 FMRs range from $905 to $1,255. County-level figures are in the CSV.
Missouri: +9.6%
About 97% of Missouri residents live where the 2-bedroom FMR went up for FY2027 and 3% live where it went down. Weighted by population, the 2-bedroom FMR moved +9.6% (from about $1,138 to $1,250), rank 3 of 51. Of 95 FMR areas, 93 rose and 2 fell. Largest rise: Joplin, MO (+21.8%). Largest drop: Columbia, MO (-7.2%). 58 areas are set at the minimum FMR, so they move together.
| Metro FMR area | 1-BR FY2027 | 2-BR FY2026 | 2-BR FY2027 | 2-BR change | 3-BR FY2027 | Note |
|---|---|---|---|---|---|---|
| Bates County, MO | $839 | $927 | $1,098 | +18.4% | $1,402 | |
| Callaway County, MO | $858 | $1,042 | $1,123 | +7.8% | $1,338 | |
| Cape Girardeau, MO-IL | $833 | $992 | $1,012 | +2.0% | $1,401 | |
| Columbia, MO | $959 | $1,160 | $1,076 | -7.2% | $1,459 | |
| Cooper County, MO | $735 | $958 | $962 | +0.4% | $1,278 | state minimum |
| Dallas County, MO | $845 | $888 | $962 | +8.3% | $1,332 | state minimum |
| Howard County, MO | $757 | $1,044 | $990 | -5.2% | $1,180 | |
| Jefferson City, MO | $735 | $910 | $962 | +5.7% | $1,332 | state minimum |
| Joplin, MO | $910 | $947 | $1,153 | +21.8% | $1,501 | |
| Kansas City, MO-KS | $1,366 | $1,358 | $1,546 | +13.8% | $2,020 | |
| Moniteau County, MO | $736 | $922 | $963 | +4.4% | $1,333 | |
| Polk County, MO | $778 | $888 | $962 | +8.3% | $1,330 | state minimum |
| Springfield, MO | $913 | $1,095 | $1,113 | +1.6% | $1,539 | |
| St. Joseph, MO-KS | $857 | $1,077 | $1,101 | +2.2% | $1,406 | |
| St. Louis, MO-IL | $1,104 | $1,218 | $1,349 | +10.8% | $1,731 |
Nonmetro areas: 80 (80 up, 0 down). 2-bedroom FY2027 FMRs range from $962 to $1,175. County-level figures are in the CSV.
Montana: +0.4%
About 79% of Montana residents live where the 2-bedroom FMR went up for FY2027 and 21% live where it went down. Weighted by population, the 2-bedroom FMR moved +0.4% (from about $1,525 to $1,529), rank 37 of 51. Of 55 FMR areas, 53 rose and 2 fell. Largest rise: Phillips County, MT (+4.2%). Largest drop: Bozeman, MT (-2.1%).
| Metro FMR area | 1-BR FY2027 | 2-BR FY2026 | 2-BR FY2027 | 2-BR change | 3-BR FY2027 | Note |
|---|---|---|---|---|---|---|
| Billings, MT | $1,132 | $1,417 | $1,432 | +1.1% | $1,983 | |
| Bozeman, MT | $1,612 | $2,154 | $2,109 | -2.1% | $2,920 | |
| Broadwater County, MT | $1,612 | $1,748 | $1,755 | +0.4% | $2,258 | |
| Great Falls, MT | $1,000 | $1,284 | $1,308 | +1.9% | $1,811 | |
| Jefferson County, MT | $1,078 | $1,404 | $1,410 | +0.4% | $1,847 | |
| Lewis and Clark County, MT | $1,320 | $1,647 | $1,653 | +0.4% | $2,289 | |
| Mineral County, MT | $1,173 | $1,361 | $1,390 | +2.1% | $1,679 | |
| Missoula, MT | $1,433 | $1,655 | $1,690 | +2.1% | $2,340 | |
| Stillwater County, MT | $972 | $1,257 | $1,271 | +1.1% | $1,760 |
Nonmetro areas: 46 (45 up, 1 down). 2-bedroom FY2027 FMRs range from $1,014 to $1,682. County-level figures are in the CSV.
Nebraska: +6.1%
About 96% of Nebraska residents live where the 2-bedroom FMR went up for FY2027 and 4% live where it went down. Weighted by population, the 2-bedroom FMR moved +6.1% (from about $1,188 to $1,260), rank 10 of 51. Of 90 FMR areas, 88 rose and 2 fell. Largest rise: Colfax County, NE (+14.0%). Largest drop: Howard County, NE (-3.3%). 66 areas are set at the minimum FMR, so they move together.
| Metro FMR area | 1-BR FY2027 | 2-BR FY2026 | 2-BR FY2027 | 2-BR change | 3-BR FY2027 | Note |
|---|---|---|---|---|---|---|
| Hall County, NE | $972 | $1,215 | $1,210 | -0.4% | $1,505 | |
| Howard County, NE | $924 | $1,049 | $1,014 | -3.3% | $1,260 | state minimum |
| Lincoln, NE | $1,009 | $1,141 | $1,230 | +7.8% | $1,703 | |
| Merrick County, NE | $775 | $961 | $1,014 | +5.5% | $1,404 | state minimum |
| Omaha-Council Bluffs, NE-IA | $1,219 | $1,368 | $1,450 | +6.0% | $1,924 | |
| Saunders County, NE | $1,014 | $1,089 | $1,153 | +5.9% | $1,546 | |
| Seward County, NE | $830 | $967 | $1,055 | +9.1% | $1,461 | |
| Sioux City, IA-NE-SD | $965 | $1,154 | $1,194 | +3.5% | $1,447 |
Nonmetro areas: 82 (82 up, 0 down). 2-bedroom FY2027 FMRs range from $1,014 to $1,247. County-level figures are in the CSV.
Nevada: -2.8%
About 2% of Nevada residents live where the 2-bedroom FMR went up for FY2027 and 98% live where it went down. Weighted by population, the 2-bedroom FMR moved -2.8% (from about $1,719 to $1,672), rank 47 of 51. Of 16 FMR areas, 2 rose and 14 fell. Largest rise: Pershing County, NV (+2.9%). Largest drop: Mineral County, NV (-10.0%). 1 area hit HUD’s 10% limit on decreases.
| Metro FMR area | 1-BR FY2027 | 2-BR FY2026 | 2-BR FY2027 | 2-BR change | 3-BR FY2027 | Note |
|---|---|---|---|---|---|---|
| Carson City, NV | $1,131 | $1,546 | $1,453 | -6.0% | $2,012 | |
| Las Vegas-Henderson-North Las Vegas, NV | $1,435 | $1,735 | $1,686 | -2.8% | $2,317 | |
| Lyon County, NV | $1,082 | $1,272 | $1,279 | +0.6% | $1,771 | |
| Reno, NV | $1,460 | $1,870 | $1,837 | -1.8% | $2,452 |
Nonmetro areas: 12 (1 up, 11 down). 2-bedroom FY2027 FMRs range from $1,014 to $1,594. County-level figures are in the CSV.
New Hampshire: -1.7%
About 46% of New Hampshire residents live where the 2-bedroom FMR went up for FY2027 and 54% live where it went down. Weighted by population, the 2-bedroom FMR moved -1.7% (from about $2,038 to $2,010), rank 44 of 51. Of 14 FMR areas, 6 rose and 8 fell. Largest rise: Hillsborough County, NH (part) (+8.0%). Largest drop: Grafton County, NH (-10.0%). 3 areas hit HUD’s 10% limit on decreases.
| Metro FMR area | 1-BR FY2027 | 2-BR FY2026 | 2-BR FY2027 | 2-BR change | 3-BR FY2027 | Note |
|---|---|---|---|---|---|---|
| Boston-Cambridge-Quincy, MA-NH | $2,518 | $2,941 | $3,008 | +2.3% | $3,584 | |
| Hillsborough County, NH (part) | $1,402 | $1,698 | $1,834 | +8.0% | $2,185 | |
| Lawrence, MA-NH | $1,809 | $2,270 | $2,367 | +4.3% | $2,820 | |
| Manchester, NH | $1,657 | $2,037 | $2,168 | +6.4% | $2,583 | |
| Nashua, NH | $1,804 | $2,127 | $2,239 | +5.3% | $2,899 | |
| Portsmouth-Rochester, NH | $1,600 | $2,194 | $2,093 | -4.6% | $2,494 | |
| Western Rockingham County, NH | $1,794 | $2,220 | $2,347 | +5.7% | $3,189 |
Nonmetro areas: 7 (0 up, 7 down). 2-bedroom FY2027 FMRs range from $1,195 to $1,800. County-level figures are in the CSV.
New Jersey: +1.8%
About 70% of New Jersey residents live where the 2-bedroom FMR went up for FY2027 and 30% live where it went down. Weighted by population, the 2-bedroom FMR moved +1.8% (from about $2,230 to $2,268), rank 30 of 51. Of 11 FMR areas, 9 rose and 2 fell. Largest rise: Trenton-Princeton, NJ (+15.0%). Largest drop: Monmouth-Ocean, NJ (-1.9%).
| Metro FMR area | 1-BR FY2027 | 2-BR FY2026 | 2-BR FY2027 | 2-BR change | 3-BR FY2027 | Note |
|---|---|---|---|---|---|---|
| Atlantic City-Hammonton, NJ | $1,567 | $1,867 | $1,899 | +1.7% | $2,578 | |
| Bergen-Passaic, NJ | $1,987 | $2,324 | $2,282 | -1.8% | $2,771 | |
| Cape May County, NJ | $1,521 | $1,792 | $1,857 | +3.6% | $2,431 | |
| Jersey City, NJ | $2,514 | $2,763 | $2,792 | +1.0% | $3,392 | |
| Middlesex-Somerset-Hunterdon, NJ | $2,103 | $2,486 | $2,623 | +5.5% | $3,125 | |
| Monmouth-Ocean, NJ | $1,847 | $2,328 | $2,283 | -1.9% | $2,927 | |
| Newark, NJ | $1,850 | $2,205 | $2,233 | +1.3% | $2,785 | |
| Philadelphia-Camden-Wilmington, PA-NJ-DE-MD | $1,558 | $1,810 | $1,860 | +2.8% | $2,216 | |
| Trenton-Princeton, NJ | $1,764 | $1,950 | $2,242 | +15.0% | $2,741 | |
| Vineland, NJ | $1,420 | $1,673 | $1,704 | +1.9% | $2,360 | |
| Warren County, NJ | $1,624 | $1,895 | $2,021 | +6.6% | $2,478 |
New Mexico: -0.5%
About 56% of New Mexico residents live where the 2-bedroom FMR went up for FY2027 and 44% live where it went down. Weighted by population, the 2-bedroom FMR moved -0.5% (from about $1,295 to $1,282), rank 40 of 51. Of 30 FMR areas, 29 rose and 1 fell. Largest rise: Los Alamos County, NM (+7.7%). Largest drop: Albuquerque, NM (-5.5%). 12 areas are set at the minimum FMR, so they move together.
| Metro FMR area | 1-BR FY2027 | 2-BR FY2026 | 2-BR FY2027 | 2-BR change | 3-BR FY2027 | Note |
|---|---|---|---|---|---|---|
| Albuquerque, NM | $1,112 | $1,464 | $1,384 | -5.5% | $1,902 | |
| Farmington, NM | $855 | $1,085 | $1,116 | +2.9% | $1,545 | |
| Las Cruces, NM | $975 | $1,042 | $1,073 | +3.0% | $1,461 | |
| Santa Fe, NM | $1,413 | $1,685 | $1,735 | +3.0% | $2,134 |
Nonmetro areas: 26 (26 up, 0 down). 2-bedroom FY2027 FMRs range from $1,014 to $1,874. County-level figures are in the CSV.
New York: +1.3%
About 75% of New York residents live where the 2-bedroom FMR went up for FY2027 and 25% live where it went down. Weighted by population, the 2-bedroom FMR moved +1.3% (from about $2,372 to $2,402), rank 33 of 51. Of 39 FMR areas, 20 rose and 19 fell. Largest rise: Binghamton, NY (+10.5%). Largest drop: Rochester, NY (-10.0%). 2 areas hit HUD’s 10% limit on decreases. 7 areas are set at the minimum FMR, so they move together.
| Metro FMR area | 1-BR FY2027 | 2-BR FY2026 | 2-BR FY2027 | 2-BR change | 3-BR FY2027 | Note |
|---|---|---|---|---|---|---|
| Albany-Schenectady-Troy, NY | $1,425 | $1,702 | $1,711 | +0.5% | $2,039 | |
| Binghamton, NY | $954 | $1,103 | $1,219 | +10.5% | $1,535 | |
| Buffalo-Cheektowaga, NY | $1,203 | $1,343 | $1,423 | +6.0% | $1,732 | |
| Elmira, NY | $1,030 | $1,283 | $1,348 | +5.1% | $1,643 | |
| Glens Falls, NY | $1,073 | $1,348 | $1,347 | -0.1% | $1,745 | |
| Ithaca, NY | $1,427 | $1,753 | $1,709 | -2.5% | $2,040 | |
| Kingston, NY | $1,436 | $1,818 | $1,878 | +3.3% | $2,282 | |
| Kiryas Joel-Poughkeepsie-Newburgh, NY | $1,659 | $1,979 | $2,131 | +7.7% | $2,685 | |
| Nassau-Suffolk, NY | $2,285 | $2,747 | $2,689 | -2.1% | $3,458 | |
| New York, NY | $2,729 | $2,910 | $2,971 | +2.1% | $3,760 | |
| Rochester, NY | $1,131 | $1,573 | $1,416 | -10.0% | $1,706 | 10% floor |
| Syracuse, NY | $1,196 | $1,392 | $1,493 | +7.3% | $1,808 | |
| Utica-Rome, NY | $946 | $1,172 | $1,210 | +3.2% | $1,442 | |
| Watertown-Fort Drum, NY | $1,111 | $1,405 | $1,453 | +3.4% | $1,995 |
Nonmetro areas: 25 (10 up, 15 down). 2-bedroom FY2027 FMRs range from $1,014 to $1,503. County-level figures are in the CSV.
North Carolina: +4.1%
About 76% of North Carolina residents live where the 2-bedroom FMR went up for FY2027 and 22% live where it went down. Weighted by population, the 2-bedroom FMR moved +4.1% (from about $1,392 to $1,441), rank 16 of 51. Of 83 FMR areas, 76 rose and 6 fell. Largest rise: Fayetteville, NC (+18.0%). Largest drop: Pinehurst-Southern Pines, NC (-9.9%). 1 area hit HUD’s 10% limit on decreases. 35 areas are set at the minimum FMR, so they move together.
| Metro FMR area | 1-BR FY2027 | 2-BR FY2026 | 2-BR FY2027 | 2-BR change | 3-BR FY2027 | Note |
|---|---|---|---|---|---|---|
| Anson County, NC | $895 | $1,138 | $1,143 | +0.4% | $1,362 | |
| Asheville, NC | $1,714 | $1,835 | $1,866 | +1.7% | $2,223 | |
| Brunswick County, NC | $1,446 | $1,426 | $1,574 | +10.4% | $2,062 | |
| Burlington, NC | $1,238 | $1,348 | $1,348 | +0.0% | $1,658 | |
| Camden County, NC | $1,220 | $1,287 | $1,364 | +6.0% | $1,889 | |
| Charlotte-Concord-Gastonia, NC-SC | $1,640 | $1,686 | $1,785 | +5.9% | $2,179 | |
| Davidson County, NC | $999 | $960 | $1,087 | +13.2% | $1,505 | |
| Durham-Chapel Hill, NC | $1,554 | $1,711 | $1,745 | +2.0% | $2,161 | |
| Fayetteville, NC | $1,334 | $1,251 | $1,476 | +18.0% | $1,937 | |
| Gates County, NC | $1,489 | $1,709 | $1,665 | -2.6% | $2,291 | |
| Goldsboro, NC | $964 | $1,244 | $1,261 | +1.4% | $1,516 | |
| Greensboro-High Point, NC | $1,168 | $1,330 | $1,271 | -4.4% | $1,644 | |
| Greenville, NC | $967 | $1,095 | $1,167 | +6.6% | $1,518 | |
| Hickory-Lenoir-Morganton, NC | $965 | $1,095 | $1,147 | +4.7% | $1,399 | |
| Hoke County, NC | $903 | $998 | $1,150 | +15.2% | $1,592 | |
| Iredell County, NC | $1,313 | $1,340 | $1,429 | +6.6% | $1,897 | |
| Jacksonville, NC | $1,073 | $1,173 | $1,319 | +12.4% | $1,826 | |
| Lincoln County, NC | $1,045 | $1,054 | $1,138 | +8.0% | $1,576 | |
| Pender County, NC | $1,101 | $1,166 | $1,199 | +2.8% | $1,660 | |
| Person County, NC | $805 | $948 | $1,012 | +6.8% | $1,401 | state minimum |
| Pinehurst-Southern Pines, NC | $1,116 | $1,358 | $1,223 | -9.9% | $1,701 | 10% floor |
| Raleigh-Cary, NC | $1,552 | $1,750 | $1,689 | -3.5% | $2,103 | |
| Rockingham County, NC | $774 | $1,040 | $1,012 | -2.7% | $1,236 | state minimum |
| Rocky Mount, NC | $972 | $1,143 | $1,167 | +2.1% | $1,567 | |
| Rowan County, NC | $1,012 | $1,196 | $1,262 | +5.5% | $1,604 | |
| Virginia Beach-Norfolk-Newport News, VA-NC | $1,488 | $1,713 | $1,667 | -2.7% | $2,298 | |
| Wilmington, NC | $1,566 | $1,659 | $1,705 | +2.8% | $2,238 | |
| Winston-Salem, NC | $1,224 | $1,232 | $1,332 | +8.1% | $1,754 |
Nonmetro areas: 55 (55 up, 0 down). 2-bedroom FY2027 FMRs range from $1,012 to $1,510. County-level figures are in the CSV.
North Dakota: +3.2%
About 40% of North Dakota residents live where the 2-bedroom FMR went up for FY2027 and 60% live where it went down. Weighted by population, the 2-bedroom FMR moved +3.2% (from about $1,076 to $1,102), rank 21 of 51. Of 51 FMR areas, 46 rose and 5 fell. Largest rise: Mountrail County, ND (+26.6%). Largest drop: Ward County, ND (-10.0%). 1 area hit HUD’s 10% limit on decreases. 31 areas are set at the minimum FMR, so they move together.
| Metro FMR area | 1-BR FY2027 | 2-BR FY2026 | 2-BR FY2027 | 2-BR change | 3-BR FY2027 | Note |
|---|---|---|---|---|---|---|
| Bismarck, ND | $927 | $1,175 | $1,067 | -9.2% | $1,477 | |
| Fargo, ND-MN | $903 | $1,112 | $1,104 | -0.7% | $1,529 | |
| Grand Forks, ND-MN | $821 | $1,089 | $1,014 | -6.9% | $1,404 | state minimum |
| McHenry County, ND | $834 | $1,000 | $1,014 | +1.4% | $1,404 | state minimum |
| Renville County, ND | $775 | $1,081 | $1,014 | -6.2% | $1,404 | state minimum |
| Ward County, ND | $864 | $1,165 | $1,049 | -10.0% | $1,458 | 10% floor |
Nonmetro areas: 45 (45 up, 0 down). 2-bedroom FY2027 FMRs range from $1,014 to $1,858. County-level figures are in the CSV.
Ohio: +4.0%
About 65% of Ohio residents live where the 2-bedroom FMR went up for FY2027 and 35% live where it went down. Weighted by population, the 2-bedroom FMR moved +4.0% (from about $1,221 to $1,273), rank 17 of 51. Of 68 FMR areas, 63 rose and 5 fell. Largest rise: Union County, OH (+12.1%). Largest drop: Canton-Massillon, OH (-3.4%). 29 areas are set at the minimum FMR, so they move together.
| Metro FMR area | 1-BR FY2027 | 2-BR FY2026 | 2-BR FY2027 | 2-BR change | 3-BR FY2027 | Note |
|---|---|---|---|---|---|---|
| Akron, OH | $952 | $1,268 | $1,231 | -2.9% | $1,474 | |
| Ashtabula County, OH | $810 | $1,037 | $1,003 | -3.3% | $1,225 | state minimum |
| Brown County, OH | $849 | $1,008 | $1,030 | +2.2% | $1,425 | |
| Canton-Massillon, OH | $827 | $1,086 | $1,049 | -3.4% | $1,327 | |
| Cincinnati, OH-KY-IN | $1,128 | $1,353 | $1,442 | +6.6% | $1,897 | |
| Cleveland, OH | $1,050 | $1,279 | $1,274 | -0.4% | $1,628 | |
| Columbus, OH | $1,346 | $1,430 | $1,602 | +12.0% | $1,909 | |
| Dayton-Kettering-Beavercreek, OH | $1,008 | $1,273 | $1,248 | -2.0% | $1,623 | |
| Erie County, OH | $977 | $1,106 | $1,221 | +10.4% | $1,531 | |
| Hocking County, OH | $848 | $973 | $1,018 | +4.6% | $1,386 | |
| Huntington-Ashland, WV-KY-OH | $864 | $973 | $1,006 | +3.4% | $1,287 | |
| Lima, OH | $901 | $1,108 | $1,179 | +6.4% | $1,418 | |
| Mansfield, OH | $822 | $973 | $1,035 | +6.4% | $1,370 | |
| Ottawa County, OH | $924 | $1,106 | $1,209 | +9.3% | $1,441 | |
| Perry County, OH | $859 | $973 | $1,006 | +3.4% | $1,267 | |
| Springfield, OH | $887 | $1,106 | $1,160 | +4.9% | $1,434 | |
| Toledo, OH | $875 | $1,076 | $1,145 | +6.4% | $1,461 | |
| Union County, OH | $1,228 | $1,433 | $1,607 | +12.1% | $1,915 | |
| Weirton-Steubenville, WV-OH | $776 | $973 | $1,007 | +3.5% | $1,298 | |
| Wheeling, WV-OH | $822 | $991 | $1,009 | +1.8% | $1,300 | |
| Youngstown-Warren, OH | $801 | $973 | $1,003 | +3.1% | $1,295 | state minimum |
Nonmetro areas: 47 (47 up, 0 down). 2-bedroom FY2027 FMRs range from $1,003 to $1,189. County-level figures are in the CSV.
Oklahoma: +0.2%
About 67% of Oklahoma residents live where the 2-bedroom FMR went up for FY2027 and 33% live where it went down. Weighted by population, the 2-bedroom FMR moved +0.2% (from about $1,123 to $1,127), rank 38 of 51. Of 69 FMR areas, 11 rose and 58 fell. Largest rise: Fort Smith, AR-OK (+4.5%). Largest drop: Woodward County, OK (-5.7%). 41 areas are set at the minimum FMR, so they move together.
| Metro FMR area | 1-BR FY2027 | 2-BR FY2026 | 2-BR FY2027 | 2-BR change | 3-BR FY2027 | Note |
|---|---|---|---|---|---|---|
| Cotton County, OK | $700 | $962 | $916 | -4.8% | $1,091 | state minimum |
| Enid, OK | $818 | $1,027 | $997 | -2.9% | $1,305 | |
| Fort Smith, AR-OK | $748 | $937 | $979 | +4.5% | $1,324 | |
| Grady County, OK | $773 | $1,004 | $1,011 | +0.7% | $1,363 | |
| Lawton, OK | $763 | $1,001 | $974 | -2.7% | $1,338 | |
| Lincoln County, OK | $822 | $937 | $916 | -2.2% | $1,217 | state minimum |
| Oklahoma City, OK | $1,040 | $1,244 | $1,264 | +1.6% | $1,713 | |
| Okmulgee County, OK | $745 | $937 | $921 | -1.7% | $1,275 | |
| Pawnee County, OK | $805 | $1,006 | $972 | -3.4% | $1,304 | |
| Tulsa, OK | $1,007 | $1,217 | $1,229 | +1.0% | $1,611 |
Nonmetro areas: 59 (7 up, 52 down). 2-bedroom FY2027 FMRs range from $916 to $1,101. County-level figures are in the CSV.
Oregon: -1.5%
About 28% of Oregon residents live where the 2-bedroom FMR went up for FY2027 and 72% live where it went down. Weighted by population, the 2-bedroom FMR moved -1.5% (from about $1,715 to $1,691), rank 43 of 51. Of 31 FMR areas, 10 rose and 21 fell. Largest rise: Salem, OR (+8.5%). Largest drop: Sherman County, OR (-9.8%). 6 areas are set at the minimum FMR, so they move together.
| Metro FMR area | 1-BR FY2027 | 2-BR FY2026 | 2-BR FY2027 | 2-BR change | 3-BR FY2027 | Note |
|---|---|---|---|---|---|---|
| Albany, OR | $1,413 | $1,695 | $1,726 | +1.8% | $2,380 | |
| Bend-Redmond, OR | $1,447 | $1,784 | $1,893 | +6.1% | $2,621 | |
| Corvallis, OR | $1,487 | $1,824 | $1,857 | +1.8% | $2,571 | |
| Crook County, OR | $1,063 | $1,385 | $1,390 | +0.4% | $1,925 | |
| Eugene-Springfield, OR | $1,182 | $1,688 | $1,546 | -8.4% | $2,141 | |
| Grants Pass, OR | $1,017 | $1,363 | $1,331 | -2.3% | $1,843 | |
| Jefferson County, OR | $927 | $1,229 | $1,213 | -1.3% | $1,680 | |
| Medford, OR | $1,243 | $1,530 | $1,539 | +0.6% | $2,131 | |
| Portland-Vancouver-Hillsboro, OR-WA | $1,633 | $1,922 | $1,878 | -2.3% | $2,550 | |
| Salem, OR | $1,294 | $1,560 | $1,692 | +8.5% | $2,341 |
Nonmetro areas: 21 (4 up, 17 down). 2-bedroom FY2027 FMRs range from $1,014 to $1,888. County-level figures are in the CSV.
Pennsylvania: +3.6%
About 86% of Pennsylvania residents live where the 2-bedroom FMR went up for FY2027 and 14% live where it went down. Weighted by population, the 2-bedroom FMR moved +3.6% (from about $1,475 to $1,528), rank 19 of 51. Of 52 FMR areas, 43 rose and 9 fell. Largest rise: Allentown-Bethlehem-Easton, PA (+12.5%). Largest drop: Erie, PA (-10.0%). 2 areas hit HUD’s 10% limit on decreases. 22 areas are set at the minimum FMR, so they move together.
| Metro FMR area | 1-BR FY2027 | 2-BR FY2026 | 2-BR FY2027 | 2-BR change | 3-BR FY2027 | Note |
|---|---|---|---|---|---|---|
| Allentown-Bethlehem-Easton, PA | $1,519 | $1,634 | $1,839 | +12.5% | $2,306 | |
| Altoona, PA | $959 | $1,138 | $1,151 | +1.1% | $1,477 | |
| Armstrong County, PA | $816 | $1,002 | $1,043 | +4.1% | $1,366 | |
| Chambersburg, PA | $1,071 | $1,379 | $1,325 | -3.9% | $1,770 | |
| Erie, PA | $851 | $1,212 | $1,091 | -10.0% | $1,350 | 10% floor |
| Gettysburg, PA | $1,063 | $1,374 | $1,354 | -1.5% | $1,830 | |
| Harrisburg-Carlisle, PA | $1,285 | $1,493 | $1,598 | +7.0% | $2,055 | |
| Johnstown, PA | $837 | $1,035 | $1,014 | -2.0% | $1,404 | state minimum |
| Lancaster, PA | $1,256 | $1,526 | $1,553 | +1.8% | $1,978 | |
| Lawrence County, PA | $844 | $1,023 | $1,095 | +7.0% | $1,516 | |
| Lebanon, PA | $1,071 | $1,411 | $1,353 | -4.1% | $1,742 | |
| Philadelphia-Camden-Wilmington, PA-NJ-DE-MD | $1,558 | $1,810 | $1,860 | +2.8% | $2,216 | |
| Pittsburgh, PA | $1,146 | $1,299 | $1,389 | +6.9% | $1,773 | |
| Reading, PA | $1,114 | $1,575 | $1,418 | -10.0% | $1,744 | 10% floor |
| Scranton–Wilkes-Barre, PA | $1,106 | $1,252 | $1,363 | +8.9% | $1,786 | |
| State College, PA | $1,282 | $1,406 | $1,537 | +9.3% | $1,977 | |
| Williamsport, PA | $1,005 | $1,195 | $1,217 | +1.8% | $1,623 | |
| York-Hanover, PA | $1,042 | $1,335 | $1,327 | -0.6% | $1,757 |
Nonmetro areas: 34 (32 up, 2 down). 2-bedroom FY2027 FMRs range from $1,014 to $1,550. County-level figures are in the CSV.
Rhode Island: +8.6%
About 100% of Rhode Island residents live where the 2-bedroom FMR went up for FY2027 and 0% live where it went down. Weighted by population, the 2-bedroom FMR moved +8.6% (from about $1,760 to $1,911), rank 6 of 51. Of 3 FMR areas, 3 rose and 0 fell. Largest rise: Providence-Fall River, RI-MA (+8.7%). Largest drop: Westerly-Hopkinton-New Shoreham, RI (+6.4%).
| Metro FMR area | 1-BR FY2027 | 2-BR FY2026 | 2-BR FY2027 | 2-BR change | 3-BR FY2027 | Note |
|---|---|---|---|---|---|---|
| Newport-Middleton-Portsmouth, RI | $1,916 | $2,314 | $2,507 | +8.3% | $3,327 | |
| Providence-Fall River, RI-MA | $1,509 | $1,729 | $1,879 | +8.7% | $2,302 | |
| Westerly-Hopkinton-New Shoreham, RI | $1,400 | $1,721 | $1,832 | +6.4% | $2,325 |
South Carolina: +2.6%
About 64% of South Carolina residents live where the 2-bedroom FMR went up for FY2027 and 36% live where it went down. Weighted by population, the 2-bedroom FMR moved +2.6% (from about $1,347 to $1,391), rank 27 of 51. Of 38 FMR areas, 13 rose and 25 fell. Largest rise: Greenville-Mauldin-Easley, SC (+12.5%). Largest drop: McCormick County, SC (-7.4%). 13 areas are set at the minimum FMR, so they move together.
| Metro FMR area | 1-BR FY2027 | 2-BR FY2026 | 2-BR FY2027 | 2-BR change | 3-BR FY2027 | Note |
|---|---|---|---|---|---|---|
| Anderson, SC | $1,012 | $1,173 | $1,102 | -6.1% | $1,444 | |
| Augusta-Richmond County, GA-SC | $1,202 | $1,261 | $1,329 | +5.4% | $1,672 | |
| Beaufort County, SC | $1,844 | $1,816 | $2,010 | +10.7% | $2,395 | |
| Charleston-North Charleston, SC | $1,731 | $1,787 | $1,884 | +5.4% | $2,336 | |
| Charlotte-Concord-Gastonia, NC-SC | $1,640 | $1,686 | $1,785 | +5.9% | $2,179 | |
| Chester County, SC | $850 | $1,056 | $1,103 | +4.5% | $1,515 | |
| Columbia, SC | $1,126 | $1,276 | $1,226 | -3.9% | $1,546 | |
| Darlington County, SC | $874 | $1,098 | $1,093 | -0.5% | $1,302 | |
| Florence, SC | $987 | $1,117 | $1,121 | +0.4% | $1,444 | |
| Greenville-Mauldin-Easley, SC | $1,384 | $1,339 | $1,507 | +12.5% | $1,801 | |
| Jasper County, SC | $1,450 | $1,542 | $1,579 | +2.4% | $1,896 | |
| Kershaw County, SC | $843 | $1,009 | $954 | -5.5% | $1,156 | |
| Lancaster County, SC | $982 | $1,011 | $1,069 | +5.7% | $1,466 | |
| Laurens County, SC | $924 | $1,133 | $1,119 | -1.2% | $1,333 | |
| Myrtle Beach-North Myrtle Beach-Conway, SC | $1,258 | $1,465 | $1,504 | +2.7% | $1,823 | |
| Spartanburg, SC | $1,099 | $1,187 | $1,196 | +0.8% | $1,457 | |
| Sumter, SC | $1,023 | $1,276 | $1,338 | +4.9% | $1,594 | |
| Union County, SC | $767 | $1,038 | $1,003 | -3.4% | $1,286 |
Nonmetro areas: 20 (1 up, 19 down). 2-bedroom FY2027 FMRs range from $885 to $1,158. County-level figures are in the CSV.
South Dakota: +9.2%
About 100% of South Dakota residents live where the 2-bedroom FMR went up for FY2027 and 0% live where it went down. Weighted by population, the 2-bedroom FMR moved +9.2% (from about $1,090 to $1,187), rank 4 of 51. Of 63 FMR areas, 63 rose and 0 fell. Largest rise: Grant County, SD (+26.9%). Largest drop: Sioux City, IA-NE-SD (+3.5%). 29 areas are set at the minimum FMR, so they move together.
| Metro FMR area | 1-BR FY2027 | 2-BR FY2026 | 2-BR FY2027 | 2-BR change | 3-BR FY2027 | Note |
|---|---|---|---|---|---|---|
| Custer County, SD | $949 | $1,173 | $1,242 | +5.9% | $1,720 | |
| Meade County, SD | $1,037 | $1,273 | $1,357 | +6.6% | $1,879 | |
| Rapid City, SD | $1,093 | $1,336 | $1,430 | +7.0% | $1,833 | |
| Sioux City, IA-NE-SD | $965 | $1,154 | $1,194 | +3.5% | $1,447 | |
| Sioux Falls, SD | $1,044 | $1,156 | $1,228 | +6.2% | $1,694 |
Nonmetro areas: 58 (58 up, 0 down). 2-bedroom FY2027 FMRs range from $1,014 to $1,409. County-level figures are in the CSV.
Tennessee: +3.6%
About 90% of Tennessee residents live where the 2-bedroom FMR went up for FY2027 and 10% live where it went down. Weighted by population, the 2-bedroom FMR moved +3.6% (from about $1,337 to $1,381), rank 20 of 51. Of 72 FMR areas, 68 rose and 4 fell. Largest rise: Rhea County, TN (+14.5%). Largest drop: Roane County, TN (-4.0%). 40 areas are set at the minimum FMR, so they move together.
| Metro FMR area | 1-BR FY2027 | 2-BR FY2026 | 2-BR FY2027 | 2-BR change | 3-BR FY2027 | Note |
|---|---|---|---|---|---|---|
| Campbell County, TN | $761 | $947 | $995 | +5.1% | $1,303 | state minimum |
| Chattanooga, TN-GA | $1,231 | $1,390 | $1,340 | -3.6% | $1,657 | |
| Clarksville, TN-KY | $1,068 | $1,346 | $1,307 | -2.9% | $1,786 | |
| Cleveland, TN | $971 | $1,233 | $1,270 | +3.0% | $1,593 | |
| Crockett County, TN | $843 | $1,083 | $1,093 | +0.9% | $1,441 | |
| Gibson County, TN | $761 | $927 | $995 | +7.3% | $1,378 | state minimum |
| Grainger County, TN | $761 | $941 | $995 | +5.7% | $1,378 | state minimum |
| Hickman County, TN | $786 | $992 | $1,028 | +3.6% | $1,312 | |
| Jackson, TN | $1,051 | $1,260 | $1,375 | +9.1% | $1,730 | |
| Johnson City, TN | $948 | $1,132 | $1,211 | +7.0% | $1,461 | |
| Kingsport-Bristol, TN-VA | $845 | $1,044 | $1,091 | +4.5% | $1,375 | |
| Knoxville, TN | $1,178 | $1,471 | $1,475 | +0.3% | $1,844 | |
| Macon County, TN | $914 | $972 | $995 | +2.4% | $1,319 | state minimum |
| Maury County, TN | $1,330 | $1,349 | $1,474 | +9.3% | $1,877 | |
| Memphis, TN-MS-AR | $1,191 | $1,274 | $1,301 | +2.1% | $1,717 | |
| Morgan County, TN | $761 | $988 | $995 | +0.7% | $1,378 | state minimum |
| Morristown, TN | $912 | $1,135 | $1,153 | +1.6% | $1,405 | |
| Nashville-Davidson–Murfreesboro–Franklin, TN | $1,650 | $1,730 | $1,798 | +3.9% | $2,309 | |
| Roane County, TN | $862 | $1,092 | $1,048 | -4.0% | $1,395 | |
| Smith County, TN | $876 | $1,051 | $1,146 | +9.0% | $1,407 | |
| Stewart County, TN | $812 | $1,004 | $995 | -0.9% | $1,378 | state minimum |
Nonmetro areas: 51 (51 up, 0 down). 2-bedroom FY2027 FMRs range from $995 to $1,213. County-level figures are in the CSV.
Texas: -1.8%
About 36% of Texas residents live where the 2-bedroom FMR went up for FY2027 and 64% live where it went down. Weighted by population, the 2-bedroom FMR moved -1.8% (from about $1,523 to $1,488), rank 45 of 51. Of 215 FMR areas, 185 rose and 29 fell. Largest rise: Dallam County, TX (+18.0%). Largest drop: Karnes County, TX (-10.0%). 1 area hit HUD’s 10% limit on decreases. 62 areas are set at the minimum FMR, so they move together.
| Metro FMR area | 1-BR FY2027 | 2-BR FY2026 | 2-BR FY2027 | 2-BR change | 3-BR FY2027 | Note |
|---|---|---|---|---|---|---|
| Abilene, TX | $1,047 | $1,276 | $1,310 | +2.7% | $1,702 | |
| Amarillo, TX | $904 | $1,106 | $1,107 | +0.1% | $1,512 | |
| Aransas County, TX | $1,073 | $1,407 | $1,404 | -0.2% | $1,944 | |
| Atascosa County, TX | $982 | $1,098 | $1,069 | -2.6% | $1,404 | |
| Austin County, TX | $817 | $1,095 | $1,069 | -2.4% | $1,480 | |
| Austin-Round Rock-San Marcos, TX | $1,530 | $1,852 | $1,817 | -1.9% | $2,292 | |
| Beaumont-Port Arthur, TX | $986 | $1,103 | $1,218 | +10.4% | $1,588 | |
| Bosque County, TX | $804 | $973 | $1,014 | +4.2% | $1,347 | state minimum |
| Brazoria County, TX | $1,212 | $1,359 | $1,319 | -2.9% | $1,790 | |
| Brownsville-Harlingen, TX | $884 | $1,047 | $1,042 | -0.5% | $1,393 | |
| Cochran County, TX | $858 | $973 | $1,014 | +4.2% | $1,224 | state minimum |
| College Station-Bryan, TX | $1,057 | $1,186 | $1,151 | -3.0% | $1,594 | |
| Corpus Christi, TX | $1,176 | $1,366 | $1,421 | +4.0% | $1,855 | |
| Dallas, TX | $1,536 | $1,931 | $1,807 | -6.4% | $2,275 | |
| Eagle Pass, TX | $931 | $973 | $1,014 | +4.2% | $1,404 | state minimum |
| El Paso, TX | $969 | $1,191 | $1,146 | -3.8% | $1,559 | |
| Falls County, TX | $775 | $973 | $1,014 | +4.2% | $1,404 | state minimum |
| Fort Worth-Arlington, TX | $1,481 | $1,723 | $1,745 | +1.3% | $2,284 | |
| Garza County, TX | $917 | $973 | $1,084 | +11.4% | $1,501 | |
| Harrison County, TX | $951 | $1,260 | $1,244 | -1.3% | $1,482 | |
| Hockley County, TX | $868 | $973 | $1,014 | +4.2% | $1,404 | state minimum |
| Houston-The Woodlands-Sugar Land, TX | $1,261 | $1,573 | $1,497 | -4.8% | $2,017 | |
| Hudspeth County, TX | $858 | $973 | $1,014 | +4.2% | $1,208 | state minimum |
| Kendall County, TX | $1,285 | $1,650 | $1,650 | +0.0% | $2,285 | |
| Killeen-Temple, TX | $927 | $1,233 | $1,138 | -7.7% | $1,576 | |
| Lampasas County, TX | $775 | $1,067 | $1,014 | -5.0% | $1,404 | state minimum |
| Laredo, TX | $955 | $1,161 | $1,157 | -0.3% | $1,512 | |
| Longview, TX | $1,041 | $1,199 | $1,232 | +2.8% | $1,611 | |
| Lubbock, TX | $1,050 | $1,175 | $1,241 | +5.6% | $1,718 | |
| Lynn County, TX | $784 | $1,007 | $1,025 | +1.8% | $1,253 | |
| Martin County, TX | $1,402 | $1,772 | $1,781 | +0.5% | $2,149 | |
| McAllen-Edinburg-Mission, TX | $806 | $1,060 | $1,017 | -4.1% | $1,305 | |
| Medina County, TX | $941 | $1,196 | $1,231 | +2.9% | $1,600 | |
| Midland, TX | $1,408 | $1,780 | $1,794 | +0.8% | $2,223 | |
| Odessa, TX | $1,229 | $1,595 | $1,522 | -4.6% | $1,813 | |
| Oldham County, TX | $870 | $1,101 | $1,065 | -3.3% | $1,475 | |
| Rusk County, TX | $921 | $1,175 | $1,205 | +2.6% | $1,448 | |
| San Angelo, TX | $1,032 | $1,339 | $1,350 | +0.8% | $1,810 | |
| San Antonio-New Braunfels, TX | $1,196 | $1,426 | $1,441 | +1.1% | $1,864 | |
| San Jacinto County, TX | $1,068 | $1,149 | $1,163 | +1.2% | $1,448 | |
| Sherman-Denison, TX | $1,126 | $1,351 | $1,395 | +3.3% | $1,932 | |
| Texarkana, TX-Texarkana, AR | $874 | $1,101 | $1,118 | +1.5% | $1,403 | |
| Tyler, TX | $1,041 | $1,338 | $1,277 | -4.6% | $1,718 | |
| Victoria, TX | $1,146 | $1,442 | $1,428 | -1.0% | $1,701 | |
| Waco, TX | $1,029 | $1,240 | $1,297 | +4.6% | $1,693 | |
| Wichita Falls, TX | $949 | $1,136 | $1,145 | +0.8% | $1,542 | |
| Wise County, TX | $892 | $1,205 | $1,164 | -3.4% | $1,612 |
Nonmetro areas: 168 (159 up, 9 down). 2-bedroom FY2027 FMRs range from $1,014 to $1,591. County-level figures are in the CSV.
Utah: -4.3%
About 12% of Utah residents live where the 2-bedroom FMR went up for FY2027 and 88% live where it went down. Weighted by population, the 2-bedroom FMR moved -4.3% (from about $1,564 to $1,493), rank 50 of 51. Of 26 FMR areas, 9 rose and 17 fell. Largest rise: Rich County, UT (+19.0%). Largest drop: San Juan County, UT (-8.9%). 4 areas are set at the minimum FMR, so they move together.
| Metro FMR area | 1-BR FY2027 | 2-BR FY2026 | 2-BR FY2027 | 2-BR change | 3-BR FY2027 | Note |
|---|---|---|---|---|---|---|
| Logan, UT-ID | $967 | $1,241 | $1,265 | +1.9% | $1,752 | |
| Ogden, UT | $1,251 | $1,614 | $1,591 | -1.4% | $2,132 | |
| Provo-Orem-Lehi, UT | $1,192 | $1,460 | $1,363 | -6.6% | $1,887 | |
| Salt Lake City, UT | $1,349 | $1,747 | $1,615 | -7.6% | $2,143 | |
| St. George, UT | $1,267 | $1,575 | $1,657 | +5.2% | $2,172 | |
| Tooele County, UT | $878 | $1,241 | $1,149 | -7.4% | $1,514 |
Nonmetro areas: 20 (7 up, 13 down). 2-bedroom FY2027 FMRs range from $1,014 to $2,153. County-level figures are in the CSV.
Vermont: +10.4%
About 100% of Vermont residents live where the 2-bedroom FMR went up for FY2027 and 0% live where it went down. Weighted by population, the 2-bedroom FMR moved +10.4% (from about $1,629 to $1,773), rank 1 of 51. Of 12 FMR areas, 12 rose and 0 fell. Largest rise: Washington County, VT (+20.3%). Largest drop: Burlington-South Burlington, VT (+1.2%).
| Metro FMR area | 1-BR FY2027 | 2-BR FY2026 | 2-BR FY2027 | 2-BR change | 3-BR FY2027 | Note |
|---|---|---|---|---|---|---|
| Burlington-South Burlington, VT | $1,719 | $2,140 | $2,165 | +1.2% | $2,733 |
Nonmetro areas: 11 (11 up, 0 down). 2-bedroom FY2027 FMRs range from $1,167 to $1,783. County-level figures are in the CSV.
Virginia: +3.0%
About 54% of Virginia residents live where the 2-bedroom FMR went up for FY2027 and 46% live where it went down. Weighted by population, the 2-bedroom FMR moved +3.0% (from about $1,731 to $1,792), rank 23 of 51. Of 64 FMR areas, 51 rose and 13 fell. Largest rise: Roanoke, VA (+16.7%). Largest drop: Charlottesville, VA (-10.0%). 1 area hit HUD’s 10% limit on decreases. 21 areas are set at the minimum FMR, so they move together.
| Metro FMR area | 1-BR FY2027 | 2-BR FY2026 | 2-BR FY2027 | 2-BR change | 3-BR FY2027 | Note |
|---|---|---|---|---|---|---|
| Blacksburg-Christiansburg-Radford, VA | $1,050 | $1,271 | $1,340 | +5.4% | $1,783 | |
| Charlottesville, VA | $1,442 | $1,824 | $1,642 | -10.0% | $1,997 | 10% floor |
| Culpeper County, VA | $1,299 | $1,423 | $1,596 | +12.2% | $2,187 | |
| Floyd County, VA | $833 | $1,094 | $1,090 | -0.4% | $1,299 | |
| Franklin County, VA | $987 | $944 | $1,080 | +14.4% | $1,495 | |
| Giles County, VA | $918 | $984 | $999 | +1.5% | $1,190 | |
| Harrisonburg, VA | $1,044 | $1,322 | $1,264 | -4.4% | $1,728 | |
| King and Queen County, VA | $1,075 | $1,250 | $1,170 | -6.4% | $1,435 | |
| Kingsport-Bristol, TN-VA | $845 | $1,044 | $1,091 | +4.5% | $1,375 | |
| Lynchburg, VA | $971 | $1,187 | $1,117 | -5.9% | $1,547 | |
| Pulaski County, VA | $873 | $921 | $952 | +3.4% | $1,267 | |
| Rappahannock County, VA | $1,428 | $1,375 | $1,555 | +13.1% | $1,853 | |
| Richmond, VA | $1,517 | $1,655 | $1,651 | -0.2% | $2,039 | |
| Roanoke, VA | $1,250 | $1,254 | $1,464 | +16.7% | $2,022 | |
| Staunton-Stuarts Draft, VA | $1,047 | $1,261 | $1,199 | -4.9% | $1,634 | |
| Surry County, VA | $952 | $1,039 | $1,064 | +2.4% | $1,473 | |
| Virginia Beach-Norfolk-Newport News, VA-NC | $1,488 | $1,713 | $1,667 | -2.7% | $2,298 | |
| Warren County, VA | $1,108 | $1,315 | $1,449 | +10.2% | $1,930 | |
| Washington-Arlington-Alexandria, DC-VA-MD | $2,204 | $2,246 | $2,438 | +8.5% | $3,107 | |
| Winchester, VA-WV | $1,180 | $1,573 | $1,505 | -4.3% | $1,895 |
Nonmetro areas: 44 (40 up, 4 down). 2-bedroom FY2027 FMRs range from $943 to $1,520. County-level figures are in the CSV.
Washington: +1.8%
About 66% of Washington residents live where the 2-bedroom FMR went up for FY2027 and 34% live where it went down. Weighted by population, the 2-bedroom FMR moved +1.8% (from about $2,010 to $2,044), rank 31 of 51. Of 35 FMR areas, 25 rose and 10 fell. Largest rise: Pend Oreille County, WA (+18.1%). Largest drop: Yakima, WA (-4.4%).
| Metro FMR area | 1-BR FY2027 | 2-BR FY2026 | 2-BR FY2027 | 2-BR change | 3-BR FY2027 | Note |
|---|---|---|---|---|---|---|
| Bellingham, WA | $1,529 | $1,794 | $1,872 | +4.3% | $2,545 | |
| Bremerton-Silverdale-Port Orchard, WA | $1,535 | $2,031 | $1,967 | -3.2% | $2,637 | |
| Kennewick-Richland, WA | $1,230 | $1,538 | $1,487 | -3.3% | $2,051 | |
| Lewiston, ID-WA | $943 | $1,220 | $1,234 | +1.1% | $1,709 | |
| Longview-Kelso, WA | $1,124 | $1,451 | $1,398 | -3.7% | $1,936 | |
| Mount Vernon-Anacortes, WA | $1,275 | $1,720 | $1,668 | -3.0% | $2,310 | |
| Olympia-Lacey-Tumwater, WA | $1,656 | $1,960 | $1,946 | -0.7% | $2,541 | |
| Portland-Vancouver-Hillsboro, OR-WA | $1,633 | $1,922 | $1,878 | -2.3% | $2,550 | |
| Seattle-Bellevue, WA | $2,180 | $2,501 | $2,549 | +1.9% | $3,324 | |
| Spokane, WA | $1,173 | $1,531 | $1,494 | -2.4% | $2,047 | |
| Stevens County, WA | $878 | $1,131 | $1,121 | -0.9% | $1,552 | |
| Tacoma, WA | $1,682 | $1,971 | $2,064 | +4.7% | $2,849 | |
| Walla Walla, WA | $1,193 | $1,550 | $1,561 | +0.7% | $2,154 | |
| Wenatchee-East Wenatchee, WA | $1,121 | $1,500 | $1,467 | -2.2% | $1,989 | |
| Yakima, WA | $1,004 | $1,374 | $1,313 | -4.4% | $1,818 |
Nonmetro areas: 20 (20 up, 0 down). 2-bedroom FY2027 FMRs range from $1,058 to $2,022. County-level figures are in the CSV.
West Virginia: +4.5%
About 91% of West Virginia residents live where the 2-bedroom FMR went up for FY2027 and 9% live where it went down. Weighted by population, the 2-bedroom FMR moved +4.5% (from about $996 to $1,039), rank 15 of 51. Of 49 FMR areas, 47 rose and 2 fell. Largest rise: Jefferson County, WV (+10.0%). Largest drop: Winchester, VA-WV (-4.3%). 26 areas are set at the minimum FMR, so they move together.
| Metro FMR area | 1-BR FY2027 | 2-BR FY2026 | 2-BR FY2027 | 2-BR change | 3-BR FY2027 | Note |
|---|---|---|---|---|---|---|
| Boone County, WV | $722 | $869 | $944 | +8.6% | $1,251 | state minimum |
| Charleston, WV | $844 | $1,036 | $1,048 | +1.2% | $1,324 | |
| Fayette County, WV | $735 | $915 | $961 | +5.0% | $1,258 | |
| Huntington-Ashland, WV-KY-OH | $864 | $973 | $1,006 | +3.4% | $1,287 | |
| Jefferson County, WV | $1,052 | $1,251 | $1,376 | +10.0% | $1,879 | |
| Martinsburg, WV | $949 | $1,233 | $1,215 | -1.5% | $1,682 | |
| Morgan County, WV | $866 | $961 | $979 | +1.9% | $1,243 | |
| Morgantown, WV | $902 | $1,099 | $1,143 | +4.0% | $1,404 | |
| Parkersburg-Vienna, WV | $798 | $928 | $974 | +5.0% | $1,214 | |
| Putnam County, WV | $834 | $1,054 | $1,091 | +3.5% | $1,500 | |
| Raleigh County, WV | $760 | $944 | $972 | +3.0% | $1,346 | |
| Weirton-Steubenville, WV-OH | $776 | $973 | $1,007 | +3.5% | $1,298 | |
| Wheeling, WV-OH | $822 | $991 | $1,009 | +1.8% | $1,300 | |
| Winchester, VA-WV | $1,180 | $1,573 | $1,505 | -4.3% | $1,895 |
Nonmetro areas: 35 (35 up, 0 down). 2-bedroom FY2027 FMRs range from $944 to $1,071. County-level figures are in the CSV.
Wisconsin: +0.7%
About 61% of Wisconsin residents live where the 2-bedroom FMR went up for FY2027 and 39% live where it went down. Weighted by population, the 2-bedroom FMR moved +0.7% (from about $1,251 to $1,251), rank 35 of 51. Of 65 FMR areas, 59 rose and 6 fell. Largest rise: La Crosse-Onalaska, WI-MN (+15.2%). Largest drop: Madison, WI (-7.6%). 29 areas are set at the minimum FMR, so they move together.
| Metro FMR area | 1-BR FY2027 | 2-BR FY2026 | 2-BR FY2027 | 2-BR change | 3-BR FY2027 | Note |
|---|---|---|---|---|---|---|
| Appleton, WI | $986 | $1,236 | $1,256 | +1.6% | $1,739 | |
| Columbia County, WI | $868 | $1,195 | $1,136 | -4.9% | $1,573 | |
| Duluth, MN-WI | $961 | $1,232 | $1,207 | -2.0% | $1,671 | |
| Eau Claire, WI | $1,017 | $1,181 | $1,259 | +6.6% | $1,695 | |
| Fond du Lac, WI | $983 | $1,176 | $1,224 | +4.1% | $1,560 | |
| Green Bay, WI | $1,028 | $1,164 | $1,287 | +10.6% | $1,697 | |
| Green County, WI | $806 | $1,097 | $1,016 | -7.4% | $1,211 | |
| Iowa County, WI | $836 | $1,168 | $1,093 | -6.4% | $1,460 | |
| Janesville-Beloit, WI | $998 | $1,246 | $1,280 | +2.7% | $1,621 | |
| Kenosha, WI | $1,144 | $1,402 | $1,441 | +2.8% | $1,956 | |
| La Crosse-Onalaska, WI-MN | $1,027 | $1,166 | $1,343 | +15.2% | $1,721 | |
| Madison, WI | $1,375 | $1,694 | $1,565 | -7.6% | $2,047 | |
| Milwaukee-Waukesha, WI | $1,060 | $1,338 | $1,263 | -5.6% | $1,553 | |
| Minneapolis-St. Paul-Bloomington, MN-WI | $1,427 | $1,709 | $1,734 | +1.5% | $2,264 | |
| Oconto County, WI | $844 | $973 | $1,014 | +4.2% | $1,375 | state minimum |
| Oshkosh-Neenah, WI | $936 | $1,149 | $1,195 | +4.0% | $1,609 | |
| Racine-Mount Pleasant, WI | $1,036 | $1,235 | $1,283 | +3.9% | $1,639 | |
| Sheboygan, WI | $918 | $1,116 | $1,168 | +4.7% | $1,392 | |
| Vernon County, WI | $856 | $973 | $1,097 | +12.7% | $1,364 | |
| Wausau, WI | $940 | $1,147 | $1,217 | +6.1% | $1,590 |
Nonmetro areas: 45 (45 up, 0 down). 2-bedroom FY2027 FMRs range from $1,014 to $1,300. County-level figures are in the CSV.
Wyoming: +2.6%
About 86% of Wyoming residents live where the 2-bedroom FMR went up for FY2027 and 14% live where it went down. Weighted by population, the 2-bedroom FMR moved +2.6% (from about $1,066 to $1,094), rank 28 of 51. Of 23 FMR areas, 21 rose and 2 fell. Largest rise: Sublette County, WY (+7.3%). Largest drop: Casper, WY (-3.4%). 11 areas are set at the minimum FMR, so they move together.
| Metro FMR area | 1-BR FY2027 | 2-BR FY2026 | 2-BR FY2027 | 2-BR change | 3-BR FY2027 | Note |
|---|---|---|---|---|---|---|
| Casper, WY | $804 | $1,082 | $1,045 | -3.4% | $1,447 | |
| Cheyenne, WY | $963 | $1,174 | $1,228 | +4.6% | $1,700 |
Nonmetro areas: 21 (20 up, 1 down). 2-bedroom FY2027 FMRs range from $999 to $1,683. County-level figures are in the CSV.
Why Fair Market Rents changed
HUD starts with Census American Community Survey rents (the 2020–2024 five-year data for FY2027). It adjusts them toward what recent movers paid using 2024 one-year survey data, updates them with rent and utility inflation factors, and adds a forecast so the numbers hold up through September 2027. The target is the 40th percentile rent, including utilities, that recent movers paid for a standard-quality unit. So FMRs follow local rent trends, which move with new apartment supply, job and population growth, and household incomes.
Two HUD rules also shape the numbers. FMRs can’t fall more than 10% in one year, and no area can go below a minimum 2-bedroom rent based on state and national nonmetro rents (the national figure is $1,014 for FY2027). That minimum is why dozens of rural counties in states like Alabama, Kansas and North Dakota jumped by the same amount. Housing authorities in areas held up by the 10% limit may set payment standards below the usual range.
What it means for landlords and property managers
- Each housing authority adopts new payment standards on its own schedule. Ask your local PHA when it will use the FY2027 numbers.
- Where FMRs fell, the housing authority may lower its payment standard. HUD rules limit how quickly a lower standard applies to current tenants, so ask your PHA how it will handle existing leases.
- Some large metros use Small Area FMRs by ZIP code. Those can differ from the metro figures here. Check HUD USER for ZIP-level numbers.
- FMRs are also used in HOME program rent limits and other HUD programs, and they are a handy benchmark for a rental business plan.
Related data
See minimum wage vs. rent by state, service wages vs. Fair Market Rent, metro service wages vs. Fair Market Rent and property taxes by state.
Methods and limits
- Source: HUD USER Fair Market Rents API (statedata endpoint), FY2026 and FY2027, all 50 states and D.C. FY2027 uses the same metro area definitions as FY2026, so areas line up one-to-one.
- Areas: metro FMR areas plus nonmetro counties (nonmetro towns in New England, grouped by HUD area). A metro that crosses state lines is listed under each state.
- Population weights: Census ACS 2020–2024 five-year population (table B01003) for counties and New England towns. Seven small towns or county parts without a matching Census population are left out of the weights but included in the CSV.
- 10% floor: flagged when the FY2027 2-bedroom FMR is within $1 of 90% of the FY2026 figure.
- State minimum: flagged when two or more areas in a state share the state’s lowest 2-bedroom FMR and it is at or below $1,014.
- HUD can revise individual FMRs after reevaluation requests. We will update this page if it does.
Sources
- HUD USER, Fair Market Rents (API)
- Federal Register, “Fair Market Rents for the Housing Choice Voucher Program… Fiscal Year 2027,” Vol. 91, No. 168, Sept. 1, 2026
- U.S. Census Bureau, American Community Survey 2020–2024 five-year estimates (API)
Cite this data
Reporters and bloggers may use these numbers and charts. Please credit StartBusinessByState and link to this page.
Source: StartBusinessByState, “2027 Fair Market Rents by State and Metro: What Changed for Section 8,” https://startbusinessbystate.com/fair-market-rent-2027-by-state/ (updated October 7, 2026).
FAQ
When do the 2027 Fair Market Rents take effect?
HUD’s FY2027 Fair Market Rents took effect on October 1, 2026. Local housing authorities then update their voucher payment standards on their own schedules.
Did Fair Market Rents go up or down for 2027?
Both. 2,120 of 2,588 FMR areas went up and 464 went down. Weighted by population the 2-bedroom FMR rose 2.0%, but 36.6% of Americans live in an area where it fell.
Which areas had the biggest Fair Market Rent cuts?
40 areas fell 10%, the maximum one-year drop. Metros at the limit include Flagstaff, AZ, Lake Havasu City-Kingman, AZ, Yuma, AZ, Oxnard-Thousand Oaks-Ventura, CA, Salinas, CA.
What is the 2027 Fair Market Rent in Chicago?
The FY2027 2-bedroom FMR for the Chicago-Joliet-Naperville HUD Metro FMR Area is $2,011, up 12.9% from $1,781.
How is Fair Market Rent calculated?
HUD uses Census rent data for standard-quality units, updates it with recent local rent changes and adds a forecast. The FMR is the 40th percentile rent, including utilities, paid by recent movers for a standard-quality unit in the area.
Last updated October 7, 2026 by StartBusinessByState.