Census County Business Patterns 2023 and BLS jobs data through August 2026 · Updated by StartBusinessByState
Short answer: Most stores on Main Street are small. 84% of U.S. retail locations have fewer than 20 employees, and together they employ about 30% of retail workers. Retail jobs usually climb from October to December as stores hire for the holidays. Last year the U.S. bump was +2.3%, ranging from +5.0% in Hawaii to -1.5% in Alaska.
Key facts for reporters
- Small retail locations (under 20 employees): 877,627 of 1,043,373 retail establishments in 2023 (Census County Business Patterns, NAICS 44-45).
- Most small retail stores per 10,000 residents: Wyoming (40.0), Vermont (38.9), Maine (36.8), South Dakota (35.8), Montana (35.1). Fewest: Arizona (19.3), District of Columbia (20.5), Washington (21.9).
- Holiday hiring, October to December 2025 (BLS, not seasonally adjusted): U.S. retail jobs +2.3% (+362,600). Largest bumps: Hawaii (+5.0%), Minnesota (+4.0%), Indiana (+3.5%), California (+3.3%), Texas (+3.3%). Smallest: Alaska (-1.5%), North Dakota (-0.2%), South Dakota (+0.0%).
- The 2021–2025 average U.S. holiday bump was +2.5%. In 2019 it was +3.2%.
- Going into this season: U.S. retail jobs were +0.2% from a year earlier in September 2026. In August 2026, the latest state month, retail jobs were down from a year earlier in 26 states.
Where small shops are most common
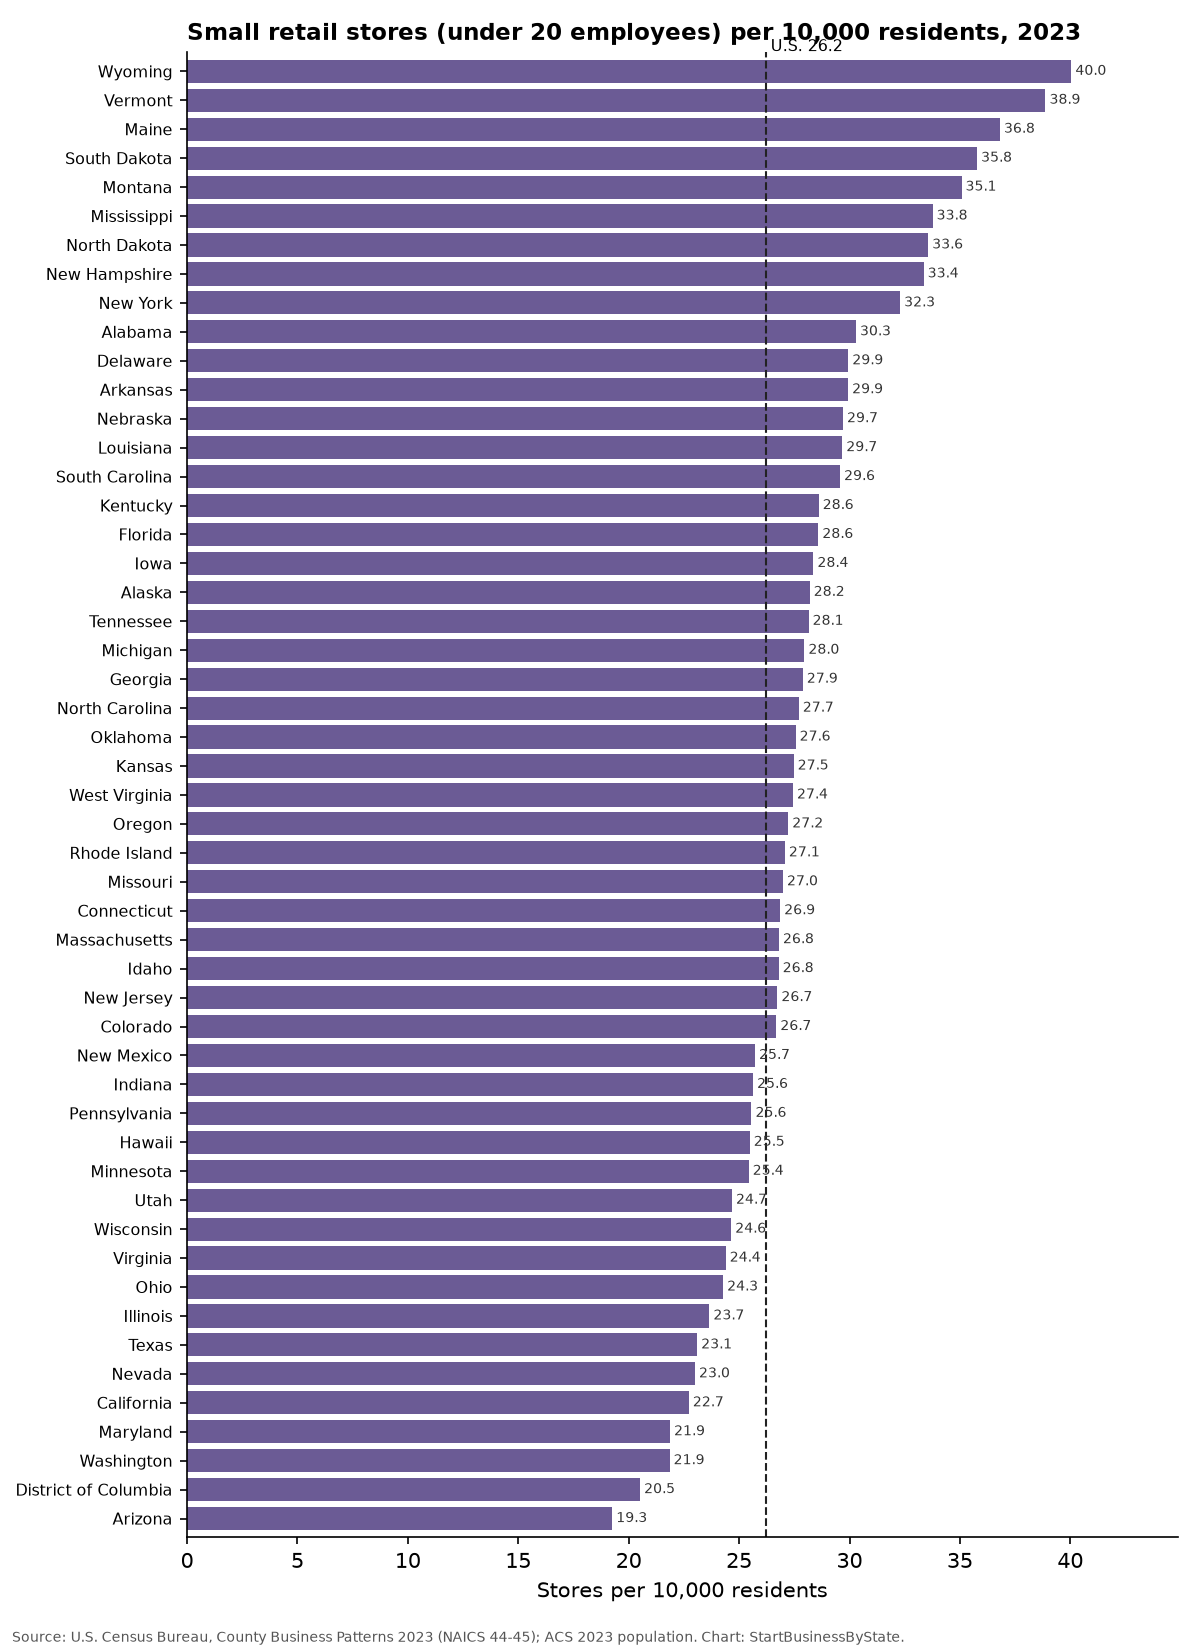
- Wyoming: 40.0 small stores per 10,000 residents (2,339 stores)
- Vermont: 38.9 small stores per 10,000 residents (2,517 stores)
- Maine: 36.8 small stores per 10,000 residents (5,138 stores)
- South Dakota: 35.8 small stores per 10,000 residents (3,289 stores)
- Montana: 35.1 small stores per 10,000 residents (3,973 stores)
- Mississippi: 33.8 small stores per 10,000 residents (9,925 stores)
- North Dakota: 33.6 small stores per 10,000 residents (2,631 stores)
- New Hampshire: 33.4 small stores per 10,000 residents (4,677 stores)
- New York: 32.3 small stores per 10,000 residents (63,198 stores)
- Alabama: 30.3 small stores per 10,000 residents (15,474 stores)
Most of the states at the top are rural or get a lot of tourists, or both. New York is an exception, with dense shopping streets in its cities. California (22.7) and Texas (23.1) have the most small stores in total but are below average per resident. A “small store” here is a single location with fewer than 20 employees. Some of those locations belong to chains.
Holiday hiring by state
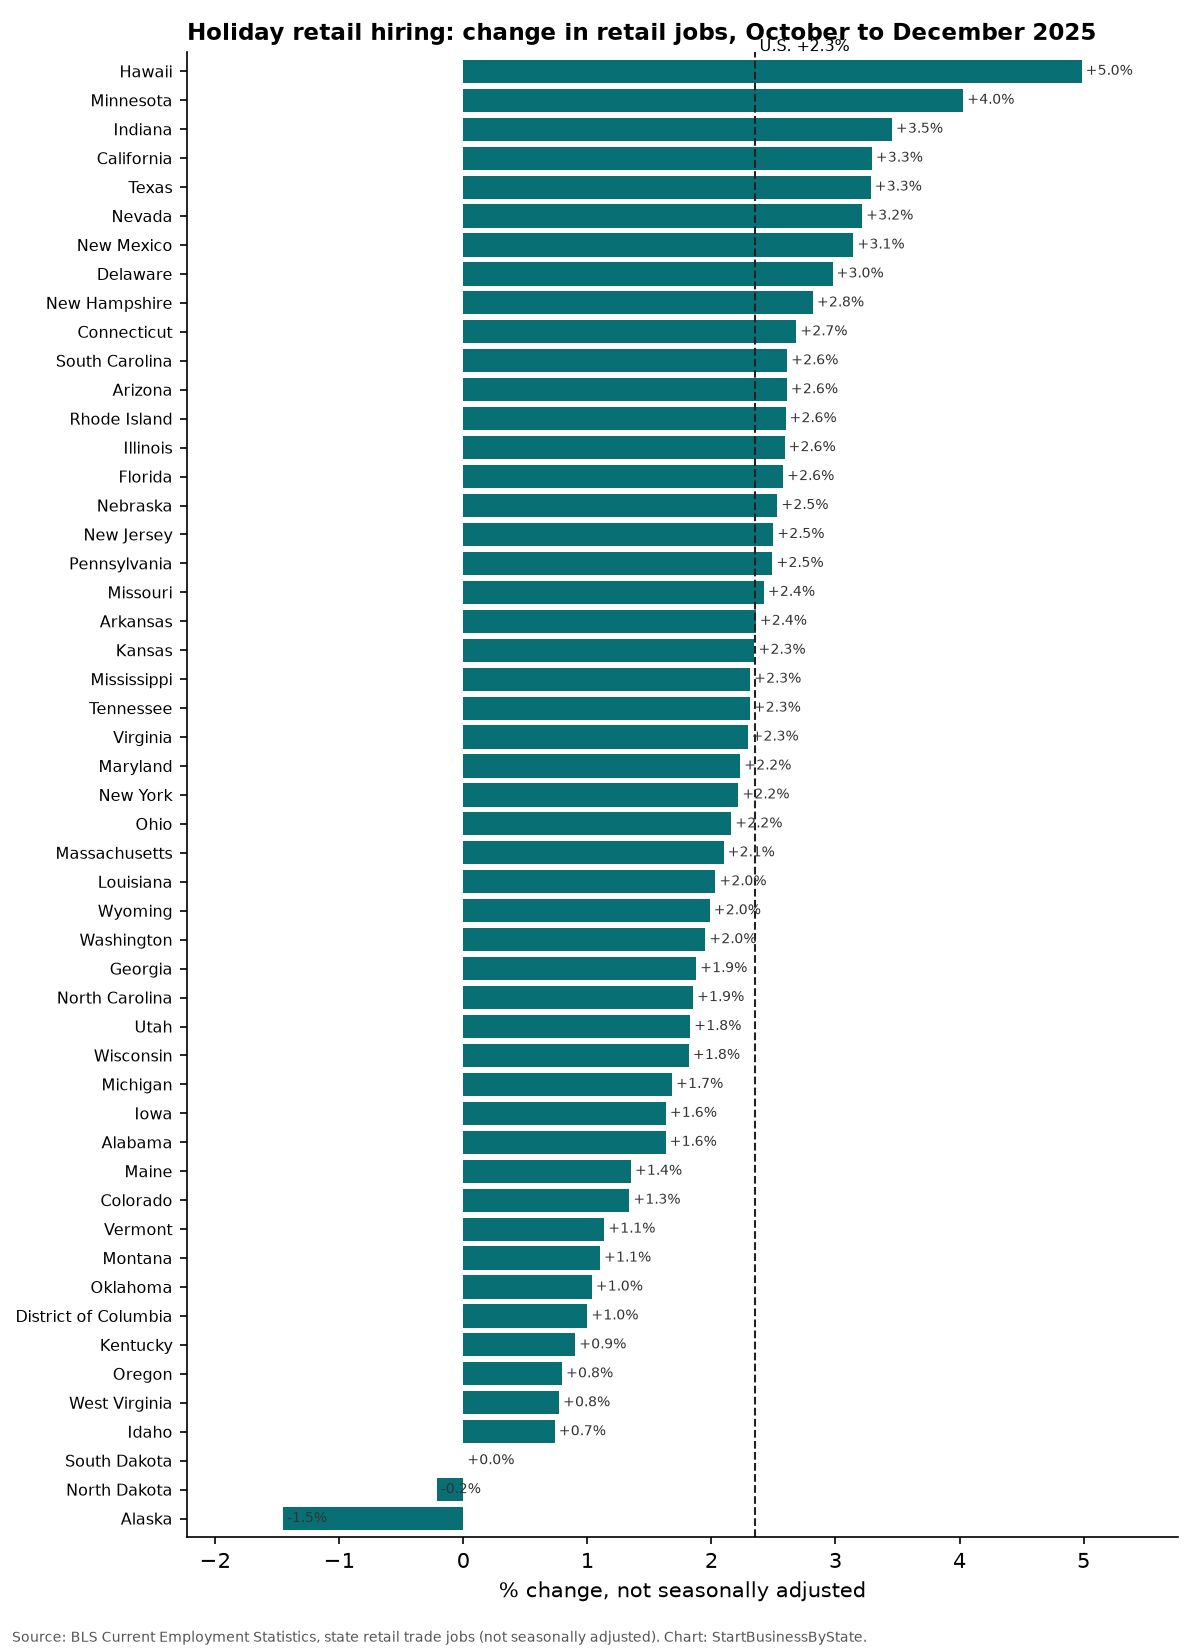
Hawaii had the biggest bump last year. Alaska, North Dakota, South Dakota saw little or no change. Results move around from year to year with weather, store openings and closings, and how much shopping moves online. The five-year average in the table smooths that out. These are jobs at all retailers, big and small. The BLS doesn’t break out state jobs by business size each month.
Small retailers and holiday hiring by state
Click a column to sort. Year-over-year job change uses August 2026 for states and September 2026 for the U.S.
| State | Small retail stores, 2023 | Share of retail locations | Per 10,000 residents | Holiday job change, Oct–Dec 2025 | Average holiday change, 2021–2025 | Retail jobs vs. year earlier |
|---|---|---|---|---|---|---|
| U.S. | 877,627 | 84% | 26.2 | +2.3% | +2.5% | +0.2% |
| Alabama | 15,474 | 87% | 30.3 | +1.6% | +2.5% | +0.3% |
| Alaska | 2,068 | 85% | 28.2 | -1.5% | -0.1% | -0.3% |
| Arizona | 14,310 | 80% | 19.3 | +2.6% | +2.9% | +0.7% |
| Arkansas | 9,184 | 87% | 29.9 | +2.4% | +1.8% | +1.3% |
| California | 88,541 | 83% | 22.7 | +3.3% | +2.8% | +1.1% |
| Colorado | 15,685 | 84% | 26.7 | +1.3% | +2.8% | -0.1% |
| Connecticut | 9,716 | 83% | 26.9 | +2.7% | +3.3% | +0.0% |
| Delaware | 3,090 | 83% | 29.9 | +3.0% | +3.0% | -2.1% |
| District of Columbia | 1,393 | 84% | 20.5 | +1.0% | +1.5% | +0.0% |
| Florida | 64,640 | 85% | 28.6 | +2.6% | +3.1% | +0.4% |
| Georgia | 30,756 | 86% | 27.9 | +1.9% | +2.9% | +0.2% |
| Hawaii | 3,657 | 83% | 25.5 | +5.0% | +3.5% | -2.3% |
| Idaho | 5,264 | 84% | 26.8 | +0.7% | +1.5% | +2.4% |
| Illinois | 29,685 | 83% | 23.7 | +2.6% | +3.0% | -1.3% |
| Indiana | 17,589 | 84% | 25.6 | +3.5% | +2.8% | +2.0% |
| Iowa | 9,097 | 83% | 28.4 | +1.6% | +2.1% | -0.3% |
| Kansas | 8,078 | 84% | 27.5 | +2.3% | +2.3% | -0.3% |
| Kentucky | 12,947 | 86% | 28.6 | +0.9% | +2.3% | +0.6% |
| Louisiana | 13,572 | 86% | 29.7 | +2.0% | +2.1% | -0.3% |
| Maine | 5,138 | 85% | 36.8 | +1.4% | +2.0% | +0.1% |
| Maryland | 13,518 | 81% | 21.9 | +2.2% | +2.8% | -1.9% |
| Massachusetts | 18,767 | 83% | 26.8 | +2.1% | +2.9% | -1.4% |
| Michigan | 28,061 | 85% | 28.0 | +1.7% | +2.0% | +0.2% |
| Minnesota | 14,594 | 82% | 25.4 | +4.0% | +2.6% | -1.0% |
| Mississippi | 9,925 | 88% | 33.8 | +2.3% | +2.7% | +0.9% |
| Missouri | 16,722 | 84% | 27.0 | +2.4% | +2.5% | +1.8% |
| Montana | 3,973 | 84% | 35.1 | +1.1% | +2.0% | +0.8% |
| Nebraska | 5,877 | 85% | 29.7 | +2.5% | +2.7% | -1.6% |
| Nevada | 7,347 | 81% | 23.0 | +3.2% | +2.7% | -0.2% |
| New Hampshire | 4,677 | 82% | 33.4 | +2.8% | +2.8% | -1.2% |
| New Jersey | 24,838 | 84% | 26.7 | +2.5% | +3.1% | -0.9% |
| New Mexico | 5,438 | 85% | 25.7 | +3.1% | +2.3% | +2.6% |
| New York | 63,198 | 88% | 32.3 | +2.2% | +2.6% | -1.2% |
| North Carolina | 30,018 | 84% | 27.7 | +1.9% | +2.6% | +0.0% |
| North Dakota | 2,631 | 85% | 33.6 | -0.2% | +1.4% | -1.3% |
| Ohio | 28,612 | 83% | 24.3 | +2.2% | +2.7% | +0.2% |
| Oklahoma | 11,172 | 85% | 27.6 | +1.0% | +1.6% | -0.9% |
| Oregon | 11,526 | 84% | 27.2 | +0.8% | +1.3% | +0.2% |
| Pennsylvania | 33,131 | 82% | 25.6 | +2.5% | +3.0% | -1.2% |
| Rhode Island | 2,967 | 83% | 27.1 | +2.6% | +3.0% | -1.1% |
| South Carolina | 15,891 | 85% | 29.6 | +2.6% | +2.4% | +0.9% |
| South Dakota | 3,289 | 86% | 35.8 | +0.0% | +1.5% | -3.5% |
| Tennessee | 20,058 | 85% | 28.1 | +2.3% | +2.8% | -1.5% |
| Texas | 70,467 | 84% | 23.1 | +3.3% | +3.1% | +0.6% |
| Utah | 8,434 | 82% | 24.7 | +1.8% | +2.2% | -0.9% |
| Vermont | 2,517 | 86% | 38.9 | +1.1% | +2.0% | -1.7% |
| Virginia | 21,260 | 82% | 24.4 | +2.3% | +2.6% | +0.4% |
| Washington | 17,073 | 83% | 21.9 | +2.0% | +1.8% | +0.5% |
| West Virginia | 4,857 | 85% | 27.4 | +0.8% | +1.7% | -0.6% |
| Wisconsin | 14,566 | 81% | 24.6 | +1.8% | +2.8% | -3.1% |
| Wyoming | 2,339 | 87% | 40.0 | +2.0% | +1.4% | +0.3% |
State-by-state notes
Alabama
Alabama had 15,474 retail stores with fewer than 20 employees in 2023, about 30.3 per 10,000 residents (rank 10 of 51; U.S. 26.2). They made up 87% of all retail locations and employed 37% of retail workers. From October to December 2025, retail jobs rose 1.6% (+3,900 jobs; U.S. +2.3%). The 2021–2025 average holiday bump was +2.5%. In August 2026, the state had 238,800 retail jobs, up 0.3% from a year earlier.
Alaska
Alaska had 2,068 retail stores with fewer than 20 employees in 2023, about 28.2 per 10,000 residents (rank 19 of 51; U.S. 26.2). They made up 85% of all retail locations and employed 33% of retail workers. From October to December 2025, retail jobs fell 1.5% (-500 jobs; U.S. +2.3%). The 2021–2025 average holiday bump was -0.1%. In August 2026, the state had 36,100 retail jobs, down 0.3% from a year earlier.
Arizona
Arizona had 14,310 retail stores with fewer than 20 employees in 2023, about 19.3 per 10,000 residents (rank 51 of 51; U.S. 26.2). They made up 80% of all retail locations and employed 24% of retail workers. From October to December 2025, retail jobs rose 2.6% (+9,000 jobs; U.S. +2.3%). The 2021–2025 average holiday bump was +2.9%. In August 2026, the state had 344,700 retail jobs, up 0.7% from a year earlier.
Arkansas
Arkansas had 9,184 retail stores with fewer than 20 employees in 2023, about 29.9 per 10,000 residents (rank 12 of 51; U.S. 26.2). They made up 87% of all retail locations and employed 37% of retail workers. From October to December 2025, retail jobs rose 2.4% (+3,400 jobs; U.S. +2.3%). The 2021–2025 average holiday bump was +1.8%. In August 2026, the state had 144,700 retail jobs, up 1.3% from a year earlier.
California
California had 88,541 retail stores with fewer than 20 employees in 2023, about 22.7 per 10,000 residents (rank 47 of 51; U.S. 26.2). They made up 83% of all retail locations and employed 28% of retail workers. From October to December 2025, retail jobs rose 3.3% (+51,800 jobs; U.S. +2.3%). The 2021–2025 average holiday bump was +2.8%. In August 2026, the state had 1,577,500 retail jobs, up 1.1% from a year earlier.
Colorado
Colorado had 15,685 retail stores with fewer than 20 employees in 2023, about 26.7 per 10,000 residents (rank 34 of 51; U.S. 26.2). They made up 84% of all retail locations and employed 31% of retail workers. From October to December 2025, retail jobs rose 1.3% (+3,600 jobs; U.S. +2.3%). The 2021–2025 average holiday bump was +2.8%. In August 2026, the state had 270,200 retail jobs, down 0.1% from a year earlier.
Connecticut
Connecticut had 9,716 retail stores with fewer than 20 employees in 2023, about 26.9 per 10,000 residents (rank 30 of 51; U.S. 26.2). They made up 83% of all retail locations and employed 28% of retail workers. From October to December 2025, retail jobs rose 2.7% (+4,400 jobs; U.S. +2.3%). The 2021–2025 average holiday bump was +3.3%. In August 2026, the state had 164,400 retail jobs, up 0.0% from a year earlier.
Delaware
Delaware had 3,090 retail stores with fewer than 20 employees in 2023, about 29.9 per 10,000 residents (rank 11 of 51; U.S. 26.2). They made up 83% of all retail locations and employed 27% of retail workers. From October to December 2025, retail jobs rose 3.0% (+1,500 jobs; U.S. +2.3%). The 2021–2025 average holiday bump was +3.0%. In August 2026, the state had 50,200 retail jobs, down 2.1% from a year earlier.
District of Columbia
District of Columbia had 1,393 retail stores with fewer than 20 employees in 2023, about 20.5 per 10,000 residents (rank 50 of 51; U.S. 26.2). They made up 84% of all retail locations and employed 29% of retail workers. From October to December 2025, retail jobs rose 1.0% (+200 jobs; U.S. +2.3%). The 2021–2025 average holiday bump was +1.5%. In August 2026, the state had 19,600 retail jobs, up 0.0% from a year earlier.
Florida
Florida had 64,640 retail stores with fewer than 20 employees in 2023, about 28.6 per 10,000 residents (rank 17 of 51; U.S. 26.2). They made up 85% of all retail locations and employed 28% of retail workers. From October to December 2025, retail jobs rose 2.6% (+29,400 jobs; U.S. +2.3%). The 2021–2025 average holiday bump was +3.1%. In August 2026, the state had 1,140,000 retail jobs, up 0.4% from a year earlier.
Georgia
Georgia had 30,756 retail stores with fewer than 20 employees in 2023, about 27.9 per 10,000 residents (rank 22 of 51; U.S. 26.2). They made up 86% of all retail locations and employed 31% of retail workers. From October to December 2025, retail jobs rose 1.9% (+9,600 jobs; U.S. +2.3%). The 2021–2025 average holiday bump was +2.9%. In August 2026, the state had 509,700 retail jobs, up 0.2% from a year earlier.
Hawaii
Hawaii had 3,657 retail stores with fewer than 20 employees in 2023, about 25.5 per 10,000 residents (rank 38 of 51; U.S. 26.2). They made up 83% of all retail locations and employed 31% of retail workers. From October to December 2025, retail jobs rose 5.0% (+3,200 jobs; U.S. +2.3%). The 2021–2025 average holiday bump was +3.5%. In August 2026, the state had 62,500 retail jobs, down 2.3% from a year earlier.
Idaho
Idaho had 5,264 retail stores with fewer than 20 employees in 2023, about 26.8 per 10,000 residents (rank 32 of 51; U.S. 26.2). They made up 84% of all retail locations and employed 33% of retail workers. From October to December 2025, retail jobs rose 0.7% (+700 jobs; U.S. +2.3%). The 2021–2025 average holiday bump was +1.5%. In August 2026, the state had 97,300 retail jobs, up 2.4% from a year earlier.
Illinois
Illinois had 29,685 retail stores with fewer than 20 employees in 2023, about 23.7 per 10,000 residents (rank 44 of 51; U.S. 26.2). They made up 83% of all retail locations and employed 29% of retail workers. From October to December 2025, retail jobs rose 2.6% (+14,600 jobs; U.S. +2.3%). The 2021–2025 average holiday bump was +3.0%. In August 2026, the state had 559,300 retail jobs, down 1.3% from a year earlier.
Indiana
Indiana had 17,589 retail stores with fewer than 20 employees in 2023, about 25.6 per 10,000 residents (rank 36 of 51; U.S. 26.2). They made up 84% of all retail locations and employed 31% of retail workers. From October to December 2025, retail jobs rose 3.5% (+10,800 jobs; U.S. +2.3%). The 2021–2025 average holiday bump was +2.8%. In August 2026, the state had 316,800 retail jobs, up 2.0% from a year earlier.
Iowa
Iowa had 9,097 retail stores with fewer than 20 employees in 2023, about 28.4 per 10,000 residents (rank 18 of 51; U.S. 26.2). They made up 83% of all retail locations and employed 30% of retail workers. From October to December 2025, retail jobs rose 1.6% (+2,800 jobs; U.S. +2.3%). The 2021–2025 average holiday bump was +2.1%. In August 2026, the state had 171,100 retail jobs, down 0.3% from a year earlier.
Kansas
Kansas had 8,078 retail stores with fewer than 20 employees in 2023, about 27.5 per 10,000 residents (rank 25 of 51; U.S. 26.2). They made up 84% of all retail locations and employed 33% of retail workers. From October to December 2025, retail jobs rose 2.3% (+3,300 jobs; U.S. +2.3%). The 2021–2025 average holiday bump was +2.3%. In August 2026, the state had 140,400 retail jobs, down 0.3% from a year earlier.
Kentucky
Kentucky had 12,947 retail stores with fewer than 20 employees in 2023, about 28.6 per 10,000 residents (rank 16 of 51; U.S. 26.2). They made up 86% of all retail locations and employed 36% of retail workers. From October to December 2025, retail jobs rose 0.9% (+1,900 jobs; U.S. +2.3%). The 2021–2025 average holiday bump was +2.3%. In August 2026, the state had 210,800 retail jobs, up 0.6% from a year earlier.
Louisiana
Louisiana had 13,572 retail stores with fewer than 20 employees in 2023, about 29.7 per 10,000 residents (rank 14 of 51; U.S. 26.2). They made up 86% of all retail locations and employed 35% of retail workers. From October to December 2025, retail jobs rose 2.0% (+4,300 jobs; U.S. +2.3%). The 2021–2025 average holiday bump was +2.1%. In August 2026, the state had 211,100 retail jobs, down 0.3% from a year earlier.
Maine
Maine had 5,138 retail stores with fewer than 20 employees in 2023, about 36.8 per 10,000 residents (rank 3 of 51; U.S. 26.2). They made up 85% of all retail locations and employed 35% of retail workers. From October to December 2025, retail jobs rose 1.4% (+1,100 jobs; U.S. +2.3%). The 2021–2025 average holiday bump was +2.0%. In August 2026, the state had 83,700 retail jobs, up 0.1% from a year earlier.
Maryland
Maryland had 13,518 retail stores with fewer than 20 employees in 2023, about 21.9 per 10,000 residents (rank 48 of 51; U.S. 26.2). They made up 81% of all retail locations and employed 26% of retail workers. From October to December 2025, retail jobs rose 2.2% (+5,900 jobs; U.S. +2.3%). The 2021–2025 average holiday bump was +2.8%. In August 2026, the state had 260,300 retail jobs, down 1.9% from a year earlier.
Massachusetts
Massachusetts had 18,767 retail stores with fewer than 20 employees in 2023, about 26.8 per 10,000 residents (rank 31 of 51; U.S. 26.2). They made up 83% of all retail locations and employed 27% of retail workers. From October to December 2025, retail jobs rose 2.1% (+6,700 jobs; U.S. +2.3%). The 2021–2025 average holiday bump was +2.9%. In August 2026, the state had 320,400 retail jobs, down 1.4% from a year earlier.
Michigan
Michigan had 28,061 retail stores with fewer than 20 employees in 2023, about 28.0 per 10,000 residents (rank 21 of 51; U.S. 26.2). They made up 85% of all retail locations and employed 34% of retail workers. From October to December 2025, retail jobs rose 1.7% (+7,600 jobs; U.S. +2.3%). The 2021–2025 average holiday bump was +2.0%. In August 2026, the state had 457,200 retail jobs, up 0.2% from a year earlier.
Minnesota
Minnesota had 14,594 retail stores with fewer than 20 employees in 2023, about 25.4 per 10,000 residents (rank 39 of 51; U.S. 26.2). They made up 82% of all retail locations and employed 29% of retail workers. From October to December 2025, retail jobs rose 4.0% (+11,300 jobs; U.S. +2.3%). The 2021–2025 average holiday bump was +2.6%. In August 2026, the state had 278,800 retail jobs, down 1.0% from a year earlier.
Mississippi
Mississippi had 9,925 retail stores with fewer than 20 employees in 2023, about 33.8 per 10,000 residents (rank 6 of 51; U.S. 26.2). They made up 88% of all retail locations and employed 41% of retail workers. From October to December 2025, retail jobs rose 2.3% (+3,200 jobs; U.S. +2.3%). The 2021–2025 average holiday bump was +2.7%. In August 2026, the state had 138,600 retail jobs, up 0.9% from a year earlier.
Missouri
Missouri had 16,722 retail stores with fewer than 20 employees in 2023, about 27.0 per 10,000 residents (rank 29 of 51; U.S. 26.2). They made up 84% of all retail locations and employed 32% of retail workers. From October to December 2025, retail jobs rose 2.4% (+7,400 jobs; U.S. +2.3%). The 2021–2025 average holiday bump was +2.5%. In August 2026, the state had 309,500 retail jobs, up 1.8% from a year earlier.
Montana
Montana had 3,973 retail stores with fewer than 20 employees in 2023, about 35.1 per 10,000 residents (rank 5 of 51; U.S. 26.2). They made up 84% of all retail locations and employed 37% of retail workers. From October to December 2025, retail jobs rose 1.1% (+700 jobs; U.S. +2.3%). The 2021–2025 average holiday bump was +2.0%. In August 2026, the state had 64,400 retail jobs, up 0.8% from a year earlier.
Nebraska
Nebraska had 5,877 retail stores with fewer than 20 employees in 2023, about 29.7 per 10,000 residents (rank 13 of 51; U.S. 26.2). They made up 85% of all retail locations and employed 32% of retail workers. From October to December 2025, retail jobs rose 2.5% (+2,600 jobs; U.S. +2.3%). The 2021–2025 average holiday bump was +2.7%. In August 2026, the state had 101,600 retail jobs, down 1.6% from a year earlier.
Nevada
Nevada had 7,347 retail stores with fewer than 20 employees in 2023, about 23.0 per 10,000 residents (rank 46 of 51; U.S. 26.2). They made up 81% of all retail locations and employed 27% of retail workers. From October to December 2025, retail jobs rose 3.2% (+4,900 jobs; U.S. +2.3%). The 2021–2025 average holiday bump was +2.7%. In August 2026, the state had 150,500 retail jobs, down 0.2% from a year earlier.
New Hampshire
New Hampshire had 4,677 retail stores with fewer than 20 employees in 2023, about 33.4 per 10,000 residents (rank 8 of 51; U.S. 26.2). They made up 82% of all retail locations and employed 29% of retail workers. From October to December 2025, retail jobs rose 2.8% (+2,500 jobs; U.S. +2.3%). The 2021–2025 average holiday bump was +2.8%. In August 2026, the state had 89,100 retail jobs, down 1.2% from a year earlier.
New Jersey
New Jersey had 24,838 retail stores with fewer than 20 employees in 2023, about 26.7 per 10,000 residents (rank 33 of 51; U.S. 26.2). They made up 84% of all retail locations and employed 26% of retail workers. From October to December 2025, retail jobs rose 2.5% (+10,700 jobs; U.S. +2.3%). The 2021–2025 average holiday bump was +3.1%. In August 2026, the state had 427,800 retail jobs, down 0.9% from a year earlier.
New Mexico
New Mexico had 5,438 retail stores with fewer than 20 employees in 2023, about 25.7 per 10,000 residents (rank 35 of 51; U.S. 26.2). They made up 85% of all retail locations and employed 35% of retail workers. From October to December 2025, retail jobs rose 3.1% (+3,000 jobs; U.S. +2.3%). The 2021–2025 average holiday bump was +2.3%. In August 2026, the state had 97,200 retail jobs, up 2.6% from a year earlier.
New York
New York had 63,198 retail stores with fewer than 20 employees in 2023, about 32.3 per 10,000 residents (rank 9 of 51; U.S. 26.2). They made up 88% of all retail locations and employed 33% of retail workers. From October to December 2025, retail jobs rose 2.2% (+18,700 jobs; U.S. +2.3%). The 2021–2025 average holiday bump was +2.6%. In August 2026, the state had 827,800 retail jobs, down 1.2% from a year earlier.
North Carolina
North Carolina had 30,018 retail stores with fewer than 20 employees in 2023, about 27.7 per 10,000 residents (rank 23 of 51; U.S. 26.2). They made up 84% of all retail locations and employed 31% of retail workers. From October to December 2025, retail jobs rose 1.9% (+9,800 jobs; U.S. +2.3%). The 2021–2025 average holiday bump was +2.6%. In August 2026, the state had 528,000 retail jobs, up 0.0% from a year earlier.
North Dakota
North Dakota had 2,631 retail stores with fewer than 20 employees in 2023, about 33.6 per 10,000 residents (rank 7 of 51; U.S. 26.2). They made up 85% of all retail locations and employed 37% of retail workers. From October to December 2025, retail jobs fell 0.2% (-100 jobs; U.S. +2.3%). The 2021–2025 average holiday bump was +1.4%. In August 2026, the state had 45,600 retail jobs, down 1.3% from a year earlier.
Ohio
Ohio had 28,612 retail stores with fewer than 20 employees in 2023, about 24.3 per 10,000 residents (rank 43 of 51; U.S. 26.2). They made up 83% of all retail locations and employed 31% of retail workers. From October to December 2025, retail jobs rose 2.2% (+11,600 jobs; U.S. +2.3%). The 2021–2025 average holiday bump was +2.7%. In August 2026, the state had 539,100 retail jobs, up 0.2% from a year earlier.
Oklahoma
Oklahoma had 11,172 retail stores with fewer than 20 employees in 2023, about 27.6 per 10,000 residents (rank 24 of 51; U.S. 26.2). They made up 85% of all retail locations and employed 34% of retail workers. From October to December 2025, retail jobs rose 1.0% (+1,900 jobs; U.S. +2.3%). The 2021–2025 average holiday bump was +1.6%. In August 2026, the state had 181,800 retail jobs, down 0.9% from a year earlier.
Oregon
Oregon had 11,526 retail stores with fewer than 20 employees in 2023, about 27.2 per 10,000 residents (rank 27 of 51; U.S. 26.2). They made up 84% of all retail locations and employed 33% of retail workers. From October to December 2025, retail jobs rose 0.8% (+1,600 jobs; U.S. +2.3%). The 2021–2025 average holiday bump was +1.3%. In August 2026, the state had 200,900 retail jobs, up 0.2% from a year earlier.
Pennsylvania
Pennsylvania had 33,131 retail stores with fewer than 20 employees in 2023, about 25.6 per 10,000 residents (rank 37 of 51; U.S. 26.2). They made up 82% of all retail locations and employed 29% of retail workers. From October to December 2025, retail jobs rose 2.5% (+14,500 jobs; U.S. +2.3%). The 2021–2025 average holiday bump was +3.0%. In August 2026, the state had 575,400 retail jobs, down 1.2% from a year earlier.
Rhode Island
Rhode Island had 2,967 retail stores with fewer than 20 employees in 2023, about 27.1 per 10,000 residents (rank 28 of 51; U.S. 26.2). They made up 83% of all retail locations and employed 33% of retail workers. From October to December 2025, retail jobs rose 2.6% (+1,200 jobs; U.S. +2.3%). The 2021–2025 average holiday bump was +3.0%. In August 2026, the state had 46,000 retail jobs, down 1.1% from a year earlier.
South Carolina
South Carolina had 15,891 retail stores with fewer than 20 employees in 2023, about 29.6 per 10,000 residents (rank 15 of 51; U.S. 26.2). They made up 85% of all retail locations and employed 33% of retail workers. From October to December 2025, retail jobs rose 2.6% (+7,000 jobs; U.S. +2.3%). The 2021–2025 average holiday bump was +2.4%. In August 2026, the state had 271,700 retail jobs, up 0.9% from a year earlier.
South Dakota
South Dakota had 3,289 retail stores with fewer than 20 employees in 2023, about 35.8 per 10,000 residents (rank 4 of 51; U.S. 26.2). They made up 86% of all retail locations and employed 37% of retail workers. From October to December 2025, retail jobs rose 0.0% (+0 jobs; U.S. +2.3%). The 2021–2025 average holiday bump was +1.5%. In August 2026, the state had 52,800 retail jobs, down 3.5% from a year earlier.
Tennessee
Tennessee had 20,058 retail stores with fewer than 20 employees in 2023, about 28.1 per 10,000 residents (rank 20 of 51; U.S. 26.2). They made up 85% of all retail locations and employed 33% of retail workers. From October to December 2025, retail jobs rose 2.3% (+7,900 jobs; U.S. +2.3%). The 2021–2025 average holiday bump was +2.8%. In August 2026, the state had 338,200 retail jobs, down 1.5% from a year earlier.
Texas
Texas had 70,467 retail stores with fewer than 20 employees in 2023, about 23.1 per 10,000 residents (rank 45 of 51; U.S. 26.2). They made up 84% of all retail locations and employed 28% of retail workers. From October to December 2025, retail jobs rose 3.3% (+46,100 jobs; U.S. +2.3%). The 2021–2025 average holiday bump was +3.1%. In August 2026, the state had 1,412,800 retail jobs, up 0.6% from a year earlier.
Utah
Utah had 8,434 retail stores with fewer than 20 employees in 2023, about 24.7 per 10,000 residents (rank 40 of 51; U.S. 26.2). They made up 82% of all retail locations and employed 27% of retail workers. From October to December 2025, retail jobs rose 1.8% (+3,200 jobs; U.S. +2.3%). The 2021–2025 average holiday bump was +2.2%. In August 2026, the state had 173,500 retail jobs, down 0.9% from a year earlier.
Vermont
Vermont had 2,517 retail stores with fewer than 20 employees in 2023, about 38.9 per 10,000 residents (rank 2 of 51; U.S. 26.2). They made up 86% of all retail locations and employed 41% of retail workers. From October to December 2025, retail jobs rose 1.1% (+400 jobs; U.S. +2.3%). The 2021–2025 average holiday bump was +2.0%. In August 2026, the state had 34,700 retail jobs, down 1.7% from a year earlier.
Virginia
Virginia had 21,260 retail stores with fewer than 20 employees in 2023, about 24.4 per 10,000 residents (rank 42 of 51; U.S. 26.2). They made up 82% of all retail locations and employed 29% of retail workers. From October to December 2025, retail jobs rose 2.3% (+9,000 jobs; U.S. +2.3%). The 2021–2025 average holiday bump was +2.6%. In August 2026, the state had 393,600 retail jobs, up 0.4% from a year earlier.
Washington
Washington had 17,073 retail stores with fewer than 20 employees in 2023, about 21.9 per 10,000 residents (rank 49 of 51; U.S. 26.2). They made up 83% of all retail locations and employed 30% of retail workers. From October to December 2025, retail jobs rose 2.0% (+6,400 jobs; U.S. +2.3%). The 2021–2025 average holiday bump was +1.8%. In August 2026, the state had 332,300 retail jobs, up 0.5% from a year earlier.
West Virginia
West Virginia had 4,857 retail stores with fewer than 20 employees in 2023, about 27.4 per 10,000 residents (rank 26 of 51; U.S. 26.2). They made up 85% of all retail locations and employed 40% of retail workers. From October to December 2025, retail jobs rose 0.8% (+600 jobs; U.S. +2.3%). The 2021–2025 average holiday bump was +1.7%. In August 2026, the state had 76,900 retail jobs, down 0.6% from a year earlier.
Wisconsin
Wisconsin had 14,566 retail stores with fewer than 20 employees in 2023, about 24.6 per 10,000 residents (rank 41 of 51; U.S. 26.2). They made up 81% of all retail locations and employed 27% of retail workers. From October to December 2025, retail jobs rose 1.8% (+5,300 jobs; U.S. +2.3%). The 2021–2025 average holiday bump was +2.8%. In August 2026, the state had 285,900 retail jobs, down 3.1% from a year earlier.
Wyoming
Wyoming had 2,339 retail stores with fewer than 20 employees in 2023, about 40.0 per 10,000 residents (rank 1 of 51; U.S. 26.2). They made up 87% of all retail locations and employed 40% of retail workers. From October to December 2025, retail jobs rose 2.0% (+600 jobs; U.S. +2.3%). The 2021–2025 average holiday bump was +1.4%. In August 2026, the state had 31,000 retail jobs, up 0.3% from a year earlier.
For shop owners getting ready
- Seasonal staff: check your state’s minimum wage and any rules for teen workers before the rush. See minimum wage by state.
- Prices and costs: see small businesses raising prices by state and credit card swipe fees by state.
- Local spending: see dining-out dollars per shop by state and gas prices and Main Street spending.
Opening a shop or adding a pop-up this season?
Form your LLC with ZenBusiness, and get a retail store insurance quote from Simply Business before you open the doors.
We may earn a commission if you use this link. It doesn’t change what you pay, and it doesn’t affect the data on this page.
Methods and limits
- Small stores: U.S. Census Bureau County Business Patterns (CBP) 2023, retail trade (NAICS 44-45), establishments with 1–4, 5–9 and 10–19 employees (mid-March employment). An establishment is a single physical location. CBP excludes businesses with no employees. Per-resident rates use ACS 2023 1-year population.
- Holiday hiring: BLS Current Employment Statistics, retail trade jobs by state, not seasonally adjusted (series SMU{state}000004200000001; U.S. CEU4200000001). Change from October to December. Recent months are preliminary and get revised.
- Small Business Saturday falls on the Saturday after Thanksgiving: November 28, 2026.
Sources
- U.S. Census Bureau, County Business Patterns (via the Census API)
- BLS State and Metro Area Employment (CES) (via the BLS Public Data API)
Cite this data
Reporters and bloggers may use these numbers and charts. Please credit StartBusinessByState and link to this page.
Source: StartBusinessByState, “Small Business Saturday by State: Main Street Shops and Holiday Hiring,” https://startbusinessbystate.com/small-business-saturday-by-state/ (updated October 8, 2026).
FAQ
When is Small Business Saturday 2026?
November 28, 2026, the Saturday after Thanksgiving.
How many small retail stores are there in the U.S.?
877,627 retail locations had fewer than 20 employees in 2023, 84% of all retail establishments, according to Census County Business Patterns.
Which state has the most small shops per person?
Wyoming, with 40.0 small retail stores per 10,000 residents, followed by Vermont (38.9) and Maine (36.8).
How much do stores hire for the holidays?
U.S. retail jobs rose 2.3% from October to December 2025 (+362,600 jobs, not seasonally adjusted). The 2021–2025 average was 2.5%.
Where does this data come from?
Census County Business Patterns (store counts by size) and the BLS Current Employment Statistics program (retail jobs by state), both pulled from official APIs.
Last updated October 8, 2026 by StartBusinessByState.