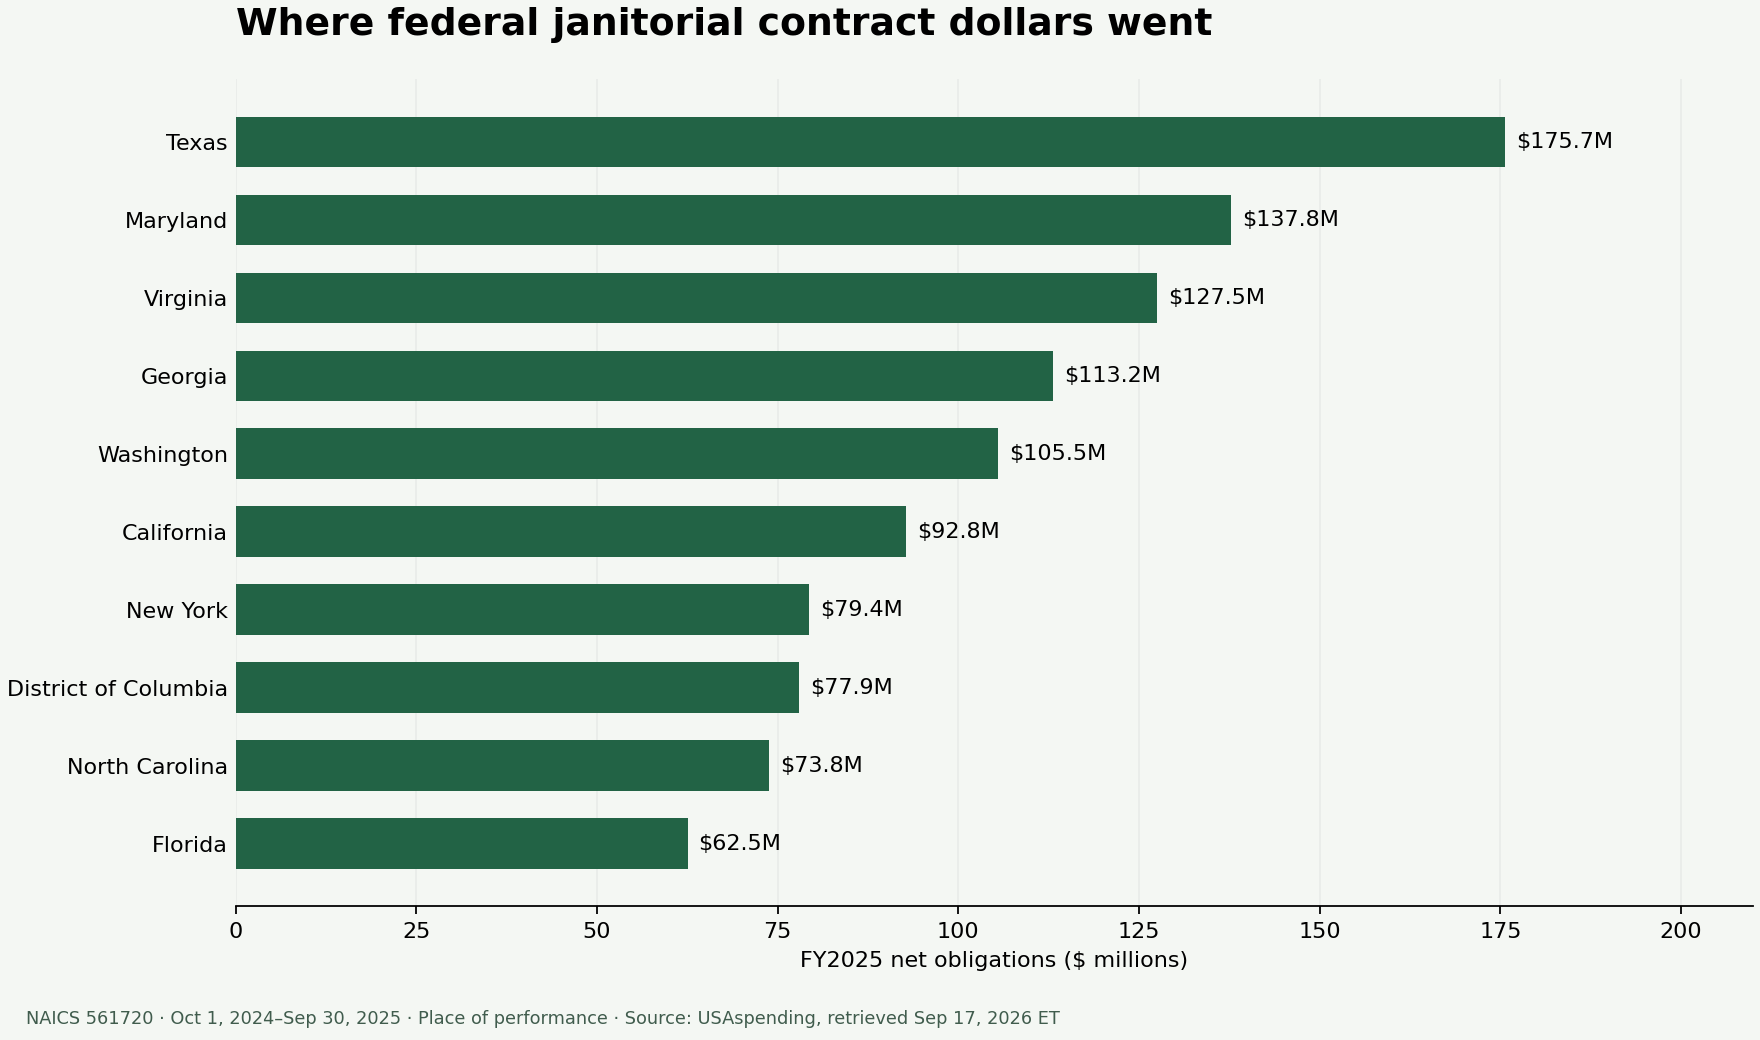
Federal janitorial contracts recorded $1.65 billion in net obligations for work in the 50 states and DC during FY2025. Texas led the state totals, and the Department of Defense accounted for 68.5% of the dollars. Transactions classified as small business received 37.4% of the net total.
This is a map of recorded purchasing activity, useful for identifying agencies and markets to research. It is not a list of open bids, money paid to contractors, or revenue available to a new cleaning business. Before pursuing work, compare the solicitation’s requirements with your cleaning business insurance coverage.
Which states received the most federal cleaning obligations?
Texas, Maryland, Virginia, Georgia and Washington together accounted for 40.0% of the 50-state/DC net total. Location means the transaction’s primary place of performance, not the contractor’s headquarters. A large state total can be driven by a few facilities or large incumbents; it does not measure your likelihood of winning.
| State / cleaning guide | Net obligations | Share of total | Distinct awards | Small-business net share |
|---|---|---|---|---|
| Texas | $175,690,958 | 10.65% | 304 | 57.6% |
| Maryland | $137,754,489 | 8.35% | 174 | 38.6% |
| Virginia | $127,545,627 | 7.73% | 176 | 33.3% |
| Georgia | $113,151,113 | 6.86% | 110 | 47.3% |
| Washington | $105,462,511 | 6.40% | 365 | 7.2% |
| California | $92,830,792 | 5.63% | 360 | 51.8% |
| New York | $79,369,776 | 4.81% | 179 | 17.3% |
| District of Columbia | $77,938,822 | 4.73% | 116 | 17.8% |
| North Carolina | $73,839,800 | 4.48% | 129 | 34.4% |
| Florida | $62,541,759 | 3.79% | 176 | 44.2% |
| Colorado | $48,525,329 | 2.94% | 132 | 28.6% |
| Hawaii | $41,056,354 | 2.49% | 80 | 49.4% |
| Alabama | $35,840,207 | 2.17% | 38 | 19.3% |
| Oklahoma | $33,921,889 | 2.06% | 93 | 28.8% |
| Arizona | $33,419,722 | 2.03% | 115 | 21.1% |
| Illinois | $33,177,939 | 2.01% | 123 | 44.2% |
| New Jersey | $31,362,754 | 1.90% | 82 | 46.0% |
| Pennsylvania | $26,382,363 | 1.60% | 139 | 39.5% |
| Alaska | $25,094,617 | 1.52% | 121 | 57.7% |
| Ohio | $24,451,453 | 1.48% | 105 | 40.7% |
| New Mexico | $23,072,214 | 1.40% | 92 | 9.2% |
| Kentucky | $20,701,995 | 1.26% | 49 | 33.5% |
| Louisiana | $19,515,772 | 1.18% | 73 | 12.8% |
| Utah | $18,140,314 | 1.10% | 91 | 26.9% |
| South Carolina | $18,135,297 | 1.10% | 46 | 48.1% |
| Kansas | $17,619,253 | 1.07% | 118 | 65.5% |
| Tennessee | $13,929,988 | 0.84% | 41 | 39.4% |
| Missouri | $12,532,536 | 0.76% | 104 | 64.0% |
| Massachusetts | $12,249,423 | 0.74% | 86 | 19.9% |
| Mississippi | $9,967,765 | 0.60% | 41 | 32.6% |
| West Virginia | $9,359,046 | 0.57% | 57 | 5.8% |
| Indiana | $8,764,676 | 0.53% | 62 | 45.2% |
| Nebraska | $8,623,025 | 0.52% | 42 | 57.8% |
| Michigan | $6,923,595 | 0.42% | 90 | 31.5% |
| Maine | $6,623,773 | 0.40% | 24 | 69.3% |
| Oregon | $6,439,580 | 0.39% | 131 | 66.8% |
| Arkansas | $6,021,677 | 0.37% | 90 | 75.9% |
| North Dakota | $5,907,503 | 0.36% | 40 | 52.3% |
| Connecticut | $5,497,042 | 0.33% | 27 | 33.6% |
| Wisconsin | $5,317,175 | 0.32% | 57 | 45.1% |
| Rhode Island | $5,125,853 | 0.31% | 18 | 39.5% |
| Nevada | $4,806,368 | 0.29% | 45 | 73.8% |
| Montana | $4,518,624 | 0.27% | 108 | 64.4% |
| Minnesota | $3,947,597 | 0.24% | 51 | 72.2% |
| Idaho | $3,807,968 | 0.23% | 89 | 68.0% |
| South Dakota | $2,979,543 | 0.18% | 53 | 32.6% |
| Delaware | $2,626,829 | 0.16% | 14 | 7.3% |
| Wyoming | $2,531,110 | 0.15% | 61 | 92.6% |
| New Hampshire | $2,125,152 | 0.13% | 19 | 48.1% |
| Iowa | $1,431,393 | 0.09% | 46 | 83.0% |
| Vermont | $446,338 | 0.03% | 23 | 78.6% |
Which agencies bought the most janitorial services?
The Department of Defense recorded $1.13 billion in net obligations in the study’s domestic scope. Homeland Security and Veterans Affairs followed. These are awarding agencies; the organization funding a contract can differ. Use the agency names to narrow research, then read the actual buying office and service location on a notice.
| Awarding agency | Net obligations | Share | Distinct awards |
|---|---|---|---|
| Department of Defense | $1,129,676,837 | 68.5% | 2,170 |
| Department of Homeland Security | $108,054,938 | 6.6% | 229 |
| Department of Veterans Affairs | $95,856,184 | 5.8% | 396 |
| General Services Administration | $59,868,322 | 3.6% | 358 |
| Department of Transportation | $50,156,168 | 3.0% | 267 |
| Department of Health and Human Services | $36,643,139 | 2.2% | 51 |
| Department of Justice | $31,276,999 | 1.9% | 33 |
| Department of the Interior | $29,810,339 | 1.8% | 412 |
| Department of the Treasury | $22,239,144 | 1.3% | 14 |
| Department of Agriculture | $16,736,723 | 1.0% | 791 |
What does a typical award look like in this data?
Among 4,091 awards with positive FY2025 net obligations, the median amount obligated during that year was $31,741. The mean was $408,306, showing how large awards pull the average upward. Neither number is the median full contract price, annual recurring revenue, profit, or a recommended bid.
For this comparison we grouped in-scope transactions by award, then summed each award’s FY2025 net obligations. Another 913 awards had zero or negative net amounts and are excluded from the positive-award distribution below—not removed from the spending totals.
| Positive FY2025 net amount per award | Awards | Share of positive-net awards |
|---|---|---|
| Under $10,000 | 855 | 20.9% |
| $10,000–under $100,000 | 2,027 | 49.5% |
| $100,000–under $1 million | 829 | 20.3% |
| $1 million or more | 380 | 9.3% |
About 70.4% of positive-net awards recorded less than $100,000 during the year. That suggests researching smaller purchasing actions as well as major facilities contracts, but an existing award’s modification or option exercise is not necessarily a new competitive opportunity.
Why the headline dollars are not all an open market
$875.1 million, or 53.1% of the net total, was recorded as “Not available for competition.” The other labels below also describe past procurement, not invitations to bid today. “Small business” and “competitive” are separate classifications.
| Recorded category | Net obligations | Share |
|---|---|---|
| Not Available For Competition | $875,097,033 | 53.1% |
| Full And Open Competition After Exclusion Of Sources | $329,723,741 | 20.0% |
| Not Competed Under Sap | $133,041,875 | 8.1% |
| Competed Under Sap | $129,253,732 | 7.8% |
| Full And Open Competition | $95,513,315 | 5.8% |
| Not Competed | $86,417,000 | 5.2% |
For example, custodial services can appear on the AbilityOne Procurement List, which has designated-source purchasing requirements. We did not match each award to that list, so the $875.1 million category must not be labeled “AbilityOne spending.” Check the actual notice, procurement restrictions and designated source before investing in a bid.
Turn the research into a bid-readiness check
Turn historical buyer research into a practical opportunity search with our guide to finding and bidding on government cleaning contracts.
Historical spending is a starting point for research, not a list of open bids. For private, subcontracted and public buying routes, use our guide to finding and qualifying for cleaning contracts.
- Find a current notice. Search SAM.gov Contract Opportunities for janitorial or custodial work, NAICS 561720, an agency and a service location. SAM includes award and other notice types as well as solicitations; check the notice type, response deadline and active status. You can search without an account.
- Check fit and eligibility. Read the scope, site-visit instructions, set-aside or designated-source restrictions, past-performance requirements and registration requirements. The SBA contracting guide explains registration and size-standard checks. An industry code alone does not establish eligibility.
- Price the required labor. Use the applicable solicitation’s wage determination and fringe-benefit requirements. DOL’s Service Contract Act guidance explains requirements for covered service contracts. Our cleaning employee cost calculator helps organize paid time and employer costs, but its general BLS wage benchmark is not a substitute for a contract wage determination.
- Match insurance to the contract. Where FAR 52.228-5 applies, the contract specifies the insurance types and minimum amounts, and the contractor must notify the contracting officer before work begins that required insurance is obtained. Read the schedule and agency clauses rather than assuming one national coverage limit fits every job.
- Check operating capacity. Budget supervision, supplies, equipment, travel, access requirements and the gap between paying employees and collecting invoices. Historical obligations do not establish how quickly a particular invoice will be paid.
Bring the solicitation to your insurance conversation
Use the actual work description, payroll estimate, service location and required endorsements when comparing coverage. Our guide explains cleaning-business policy types and links to state insurance pages.
Compare cleaning business insuranceDownload the data and check the method
- State totals and small-business shares (CSV)
- All awarding-agency totals (CSV)
- All 5,004 award-period totals with USAspending links (CSV)
- Download the state chart (PNG)
Source: USAspending API v2, transaction CSV download. Filters: prime contract types A/B/C/D (BPA calls, purchase orders, delivery orders and definitive contracts), NAICS 561720, transaction action dates October 1, 2024 through September 30, 2025. Retrieved September 17, 2026 Eastern time (September 18 UTC). FY2026 is excluded because it was incomplete at retrieval.
The download contains 10,769 unique transactions across all geographies, totaling $1,788,567,195.10. The published 50-state/DC scope contains 9,423 transactions and $1,649,046,696.92 net obligations; excluded territories, overseas and other nonqualifying locations account for 1,346 transactions and $139,520,498.18. Inclusion requires country USA and a matching state/DC code.
We sum federal_action_obligation, including negative values: $1,714,650,820.20 of positive obligations plus −$65,604,123.28 of deobligations. There are 1,380 negative and 1,724 zero-dollar transactions in the published scope. All-geography totals reconcile to the API’s separate spending-over-time endpoint; state, agency and award-period totals reconcile to the same domestic net total.
Business size comes from contracting_officers_determination_of_business_size on each transaction. Small-business-classified transactions sum to $616,813,889.92. This is not a list of currently eligible firms. Distinct awards use the unique award key; the median uses only awards with positive in-scope net obligations during FY2025.
Limits: obligations are commitments, not cash outlays, ceilings or company revenue. Modifications can change the amount or description without a new contract. Data can be revised. Primary performance location does not capture every work site or recipient headquarters. The NAICS filter excludes cleaning work recorded under broader facilities-management or other codes. Subcontracts, state/local procurement and unreported activity are outside this extract. This is nominal one-year data, not an inflation-adjusted trend or a forecast.
Suggested citation: StartBusinessByState.com, “Federal Cleaning Contracts by State: FY2025 Spending,” September 17, 2026 edition; analysis of USAspending prime contract transactions, NAICS 561720, primary performance in 50 states and DC. Retain the fiscal year and net-obligation definition when quoting a number.