Original research · EIA weekly diesel prices + EIA State Energy Data System · Last updated October 6, 2026
Data through: EIA diesel prices for the week of September 28, 2026. State diesel use: EIA State Energy Data System, 2024 (latest available). Refreshed every week after EIA’s Monday release.
Diesel costs $2.63 more per gallon than a year ago. The U.S. average was $6.38 the week of September 28, 2026, against $3.75 the same week of 2025. Trucks, buses, trains and boats burned 44.0 billion gallons of diesel in 2024, the latest year of state data from the U.S. Energy Information Administration (EIA). Multiply the two and the shock adds up to about $115.7 billion a year. So far in 2026, the extra spending comes to roughly $45.0 billion.
Key findings
- About $115.7 billion a year in extra diesel costs. That’s 44.0 billion gallons of transportation diesel (2024) times the $2.63 rise in the U.S. average price. It would add 62.2% to the $186.1 billion spent on transportation diesel in 2024. Modeled
- Roughly $45.0 billion extra so far in 2026. Over the 39 weeks of 2026 through Sep 28, 2026, U.S. diesel averaged $1.36 a gallon more than the same weeks of 2025. Modeled
- Texas, California and Florida carry the biggest bills. Texas: $16.5 billion a year. California: $10.1 billion. Florida: $4.5 billion. 37 states top $1 billion.
- Per resident, Wyoming is hit hardest. $1,755 a year per resident, followed by North Dakota ($1,146) and Alaska ($1,108). These are freight-corridor, farm and energy states that burn a lot of diesel for their size. The lowest is District of Columbia at $65.
- Every region is up at least $2.28 a gallon. The smallest jump is in the Lower Atlantic (PADD 1C) region. The biggest is in the California region at $3.20, to $8.18.
- Wholesale diesel is up 77.8%. The Bureau of Labor Statistics producer price index for No. 2 diesel fuel (series WPU057303) was 546.0 in August 2026, against 307.2 a year earlier (latest month is preliminary).
The 20 states with the biggest diesel shock bills
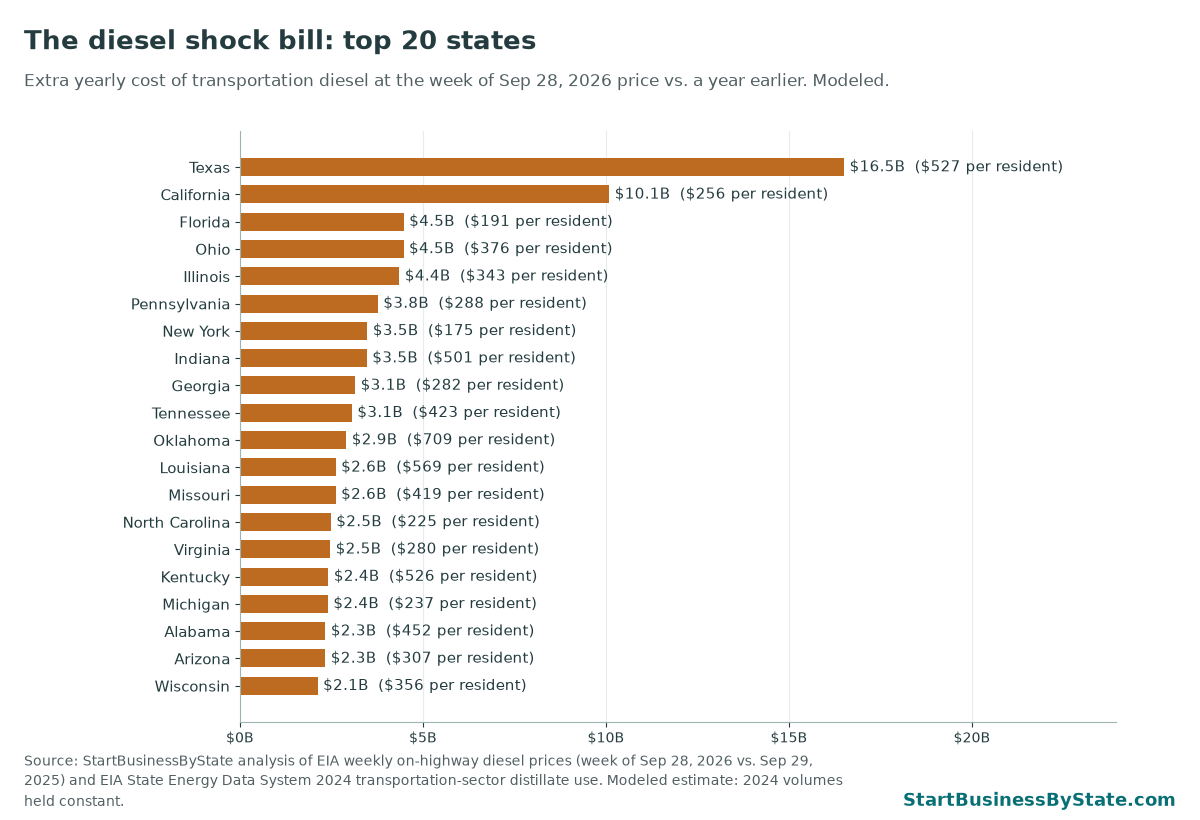
Big states top the list because they burn the most diesel. Texas used 6.5 billion gallons for transportation in 2024, more than any other state. Its Gulf Coast price is up $2.54 a gallon from a year ago.
The per-resident column tells a different story. Wyoming, North Dakota and Alaska have small populations but heavy freight, farm and energy traffic. A lot of the diesel burned there moves goods for people in other states, so the cost doesn’t land only on residents. It does land on the trucking companies, farms and contractors based there.
Diesel shock cost for every state
Click a column header to sort. Prices are EIA regional averages: EIA publishes diesel prices for regions and California, not for each state, so neighbors in the same region show the same price change. State volumes are different for every state.
| Rank | State | EIA price region | Diesel price change, per gal. | Transportation diesel used, 2024 (gal.) | Extra cost per year Modeled | Extra cost per resident | Extra so far in 2026 Modeled | All diesel uses, extra per year Modeled |
|---|---|---|---|---|---|---|---|---|
| 1 | Texas | Gulf Coast (PADD 3) | +$2.54 | 6,493M | $16.5 billion | $527 | $6.7 billion | $19.9 billion |
| 2 | California | California | +$3.20 | 3,152M | $10.1 billion | $256 | $3.9 billion | $12.3 billion |
| 3 | Florida | Lower Atlantic (PADD 1C) | +$2.28 | 1,962M | $4.5 billion | $191 | $1.8 billion | $5.3 billion |
| 4 | Ohio | Midwest (PADD 2) | +$2.79 | 1,598M | $4.5 billion | $376 | $1.6 billion | $5.5 billion |
| 5 | Illinois | Midwest (PADD 2) | +$2.79 | 1,558M | $4.4 billion | $343 | $1.6 billion | $5.3 billion |
| 6 | Pennsylvania | Central Atlantic (PADD 1B) | +$2.63 | 1,432M | $3.8 billion | $288 | $1.5 billion | $6.3 billion |
| 7 | New York | Central Atlantic (PADD 1B) | +$2.63 | 1,324M | $3.5 billion | $175 | $1.4 billion | $6.5 billion |
| 8 | Indiana | Midwest (PADD 2) | +$2.79 | 1,240M | $3.5 billion | $501 | $1.3 billion | $4.2 billion |
| 9 | Georgia | Lower Atlantic (PADD 1C) | +$2.28 | 1,381M | $3.1 billion | $282 | $1.3 billion | $3.8 billion |
| 10 | Tennessee | Midwest (PADD 2) | +$2.79 | 1,094M | $3.1 billion | $423 | $1.1 billion | $3.4 billion |
| 11 | Oklahoma | Midwest (PADD 2) | +$2.79 | 1,039M | $2.9 billion | $709 | $1.1 billion | $3.5 billion |
| 12 | Louisiana | Gulf Coast (PADD 3) | +$2.54 | 1,029M | $2.6 billion | $569 | $1.1 billion | $3.2 billion |
| 13 | Missouri | Midwest (PADD 2) | +$2.79 | 935M | $2.6 billion | $419 | $946 million | $3.3 billion |
| 14 | North Carolina | Lower Atlantic (PADD 1C) | +$2.28 | 1,088M | $2.5 billion | $225 | $1.0 billion | $3.0 billion |
| 15 | Virginia | Lower Atlantic (PADD 1C) | +$2.28 | 1,081M | $2.5 billion | $280 | $1.0 billion | $3.1 billion |
| 16 | Kentucky | Midwest (PADD 2) | +$2.79 | 864M | $2.4 billion | $526 | $874 million | $2.9 billion |
| 17 | Michigan | Midwest (PADD 2) | +$2.79 | 859M | $2.4 billion | $237 | $869 million | $3.0 billion |
| 18 | Alabama | Gulf Coast (PADD 3) | +$2.54 | 918M | $2.3 billion | $452 | $947 million | $2.8 billion |
| 19 | Arizona | West Coast except California | +$2.50 | 932M | $2.3 billion | $307 | $994 million | $3.0 billion |
| 20 | Wisconsin | Midwest (PADD 2) | +$2.79 | 759M | $2.1 billion | $356 | $768 million | $2.8 billion |
| 21 | New Jersey | Central Atlantic (PADD 1B) | +$2.63 | 778M | $2.0 billion | $215 | $824 million | $2.9 billion |
| 22 | Iowa | Midwest (PADD 2) | +$2.79 | 720M | $2.0 billion | $621 | $728 million | $3.0 billion |
| 23 | Washington | West Coast except California | +$2.50 | 785M | $2.0 billion | $247 | $837 million | $2.5 billion |
| 24 | Minnesota | Midwest (PADD 2) | +$2.79 | 695M | $1.9 billion | $335 | $703 million | $2.9 billion |
| 25 | Kansas | Midwest (PADD 2) | +$2.79 | 675M | $1.9 billion | $635 | $683 million | $2.5 billion |
| 26 | South Carolina | Lower Atlantic (PADD 1C) | +$2.28 | 825M | $1.9 billion | $343 | $767 million | $2.1 billion |
| 27 | Mississippi | Gulf Coast (PADD 3) | +$2.54 | 713M | $1.8 billion | $616 | $736 million | $2.1 billion |
| 28 | Arkansas | Gulf Coast (PADD 3) | +$2.54 | 672M | $1.7 billion | $553 | $694 million | $2.1 billion |
| 29 | New Mexico | Gulf Coast (PADD 3) | +$2.54 | 656M | $1.7 billion | $782 | $677 million | $1.9 billion |
| 30 | Colorado | Rocky Mountain (PADD 4) | +$2.67 | 612M | $1.6 billion | $275 | $593 million | $2.2 billion |
| 31 | Nebraska | Midwest (PADD 2) | +$2.79 | 568M | $1.6 billion | $792 | $575 million | $2.2 billion |
| 32 | Oregon | West Coast except California | +$2.50 | 579M | $1.4 billion | $339 | $617 million | $1.8 billion |
| 33 | Utah | Rocky Mountain (PADD 4) | +$2.67 | 521M | $1.4 billion | $397 | $504 million | $1.7 billion |
| 34 | Maryland | Central Atlantic (PADD 1B) | +$2.63 | 480M | $1.3 billion | $202 | $509 million | $1.8 billion |
| 35 | Idaho | Rocky Mountain (PADD 4) | +$2.67 | 415M | $1.1 billion | $555 | $402 million | $1.4 billion |
| 36 | Wyoming | Rocky Mountain (PADD 4) | +$2.67 | 386M | $1.0 billion | $1,755 | $374 million | $1.5 billion |
| 37 | Massachusetts | New England (PADD 1A) | +$2.55 | 393M | $1.0 billion | $140 | $409 million | $2.7 billion |
| 38 | Nevada | West Coast except California | +$2.50 | 378M | $945 million | $289 | $403 million | $1.3 billion |
| 39 | West Virginia | Lower Atlantic (PADD 1C) | +$2.28 | 404M | $920 million | $520 | $375 million | $1.3 billion |
| 40 | North Dakota | Midwest (PADD 2) | +$2.79 | 327M | $913 million | $1,146 | $331 million | $1.8 billion |
| 41 | Alaska | West Coast except California | +$2.50 | 328M | $820 million | $1,108 | $350 million | $1.5 billion |
| 42 | Montana | Rocky Mountain (PADD 4) | +$2.67 | 291M | $778 million | $684 | $282 million | $970 million |
| 43 | South Dakota | Midwest (PADD 2) | +$2.79 | 235M | $658 million | $711 | $238 million | $898 million |
| 44 | Connecticut | New England (PADD 1A) | +$2.55 | 251M | $639 million | $174 | $261 million | $1.8 billion |
| 45 | Maine | New England (PADD 1A) | +$2.55 | 179M | $457 million | $325 | $186 million | $1.2 billion |
| 46 | New Hampshire | New England (PADD 1A) | +$2.55 | 113M | $288 million | $204 | $118 million | $762 million |
| 47 | Rhode Island | New England (PADD 1A) | +$2.55 | 90M | $230 million | $206 | $94 million | $549 million |
| 48 | Hawaii | West Coast except California | +$2.50 | 78M | $194 million | $134 | $83 million | $511 million |
| 49 | Delaware | Central Atlantic (PADD 1B) | +$2.63 | 67M | $175 million | $167 | $71 million | $274 million |
| 50 | Vermont | New England (PADD 1A) | +$2.55 | 59M | $149 million | $230 | $61 million | $437 million |
| 51 | District of Columbia | Central Atlantic (PADD 1B) | +$2.63 | 17M | $46 million | $65 | $18 million | $74 million |
Price change: week of September 28, 2026 vs. week of Sep 29, 2025. “Transportation diesel” is EIA’s transportation-sector distillate fuel oil (trucks, buses, trains, boats). “All diesel uses” adds farm, construction, industrial, commercial, home heating and power-plant distillate. U.S. total: $115.7 billion transportation, $153.2 billion all uses.
Download the data (CSV)Diesel this year vs. the same week last year
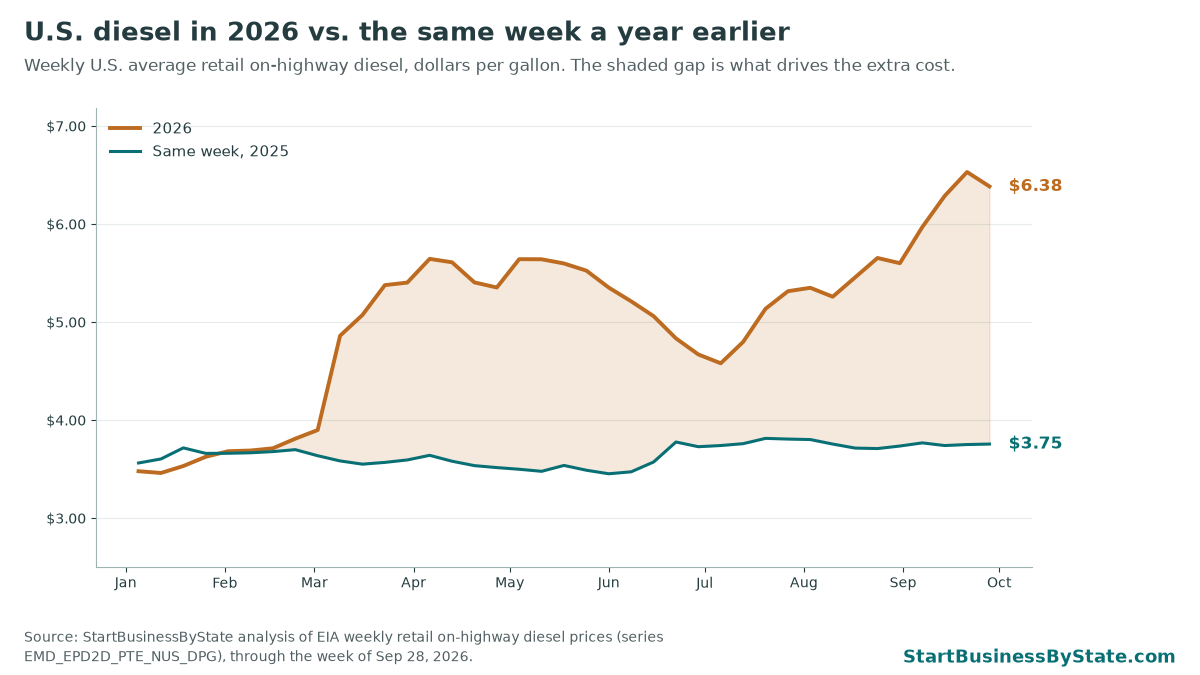
The two lines tracked each other until the Iran war began at the end of February. Since then the gap has widened in waves, and the U.S. average set an all-time weekly record of $6.53 the week of Sep 21, 2026. Averaged across all 39 weeks of 2026 so far, diesel has cost $1.36 a gallon more than the same weeks of 2025. The gap now is $2.63, so the yearly number at the top of this page assumes the current gap holds. If prices fall back, the real bill will be smaller.
For this week’s prices in every region, see our diesel and gas prices by state tracker.
What the diesel shock means for your business
You don’t have to run a truck fleet to feel this. Diesel moves almost everything you buy, so suppliers pass it through as fuel surcharges and higher delivery fees. If your own vehicles run on diesel, you feel it twice.
- Trucking and hauling. A long-haul semi at 100,000 miles a year and 6.5 mpg burns about 15,385 gallons. At a $2.63 jump, that’s about $40,431 more a year. Many freight contracts include a fuel surcharge that follows EIA’s weekly diesel price, the same number used here. If yours doesn’t, ask for one before you sign. Our trucking industry diesel squeeze report has state numbers for owner-operators.
- Landscaping. Diesel crew trucks pulling trailers feel it first. A truck doing 25,000 miles at 12 mpg uses about 2,083 gallons a year, so the price jump adds about $5,475. Check that your per-visit price still covers fuel. The landscaping job pricing calculator has a fuel line.
- HVAC and plumbing. Most service vans run on gas, but your parts and equipment arrive by diesel truck. Watch supplier invoices for new fuel surcharges, and build a trip charge into your HVAC maintenance agreement pricing.
- Food trucks. Many food trucks run diesel engines or diesel generators, and food deliveries carry fuel surcharges too. Price your menu for this month’s costs, not last spring’s. Try the food truck event profit calculator.
- Cleaning services. Fuel is a smaller share of your costs, but supply deliveries and driving between sites both cost more. Add a fuel line when you price a commercial cleaning contract.
Some states have paused fuel taxes or let farmers and loggers use cheaper dyed diesel on the road. Check our state fuel tax holiday and dyed-diesel tracker to see whether your state is one of them. For a weekly fuel budget by business type, see fuel costs for mobile service businesses.
How we did this
- Diesel prices. EIA weekly retail on-highway diesel prices (No. 2 diesel, all types), EIA Open Data API v2, route petroleum/pri/gnd, product EPD2D. Series EMD_EPD2D_PTE_[area]_DPG for the U.S., the East Coast subregions (New England, Central Atlantic, Lower Atlantic), Midwest, Gulf Coast, Rocky Mountain, West Coast except California, and California. Latest week September 28, 2026; comparison week Sep 29, 2025 (364 days earlier). Pulled October 6, 2026.
- Diesel volumes. EIA State Energy Data System (SEDS), API route seds, series DFACP (distillate fuel oil consumed by the transportation sector), DFTCP (total distillate consumption) and DFACV (transportation distillate expenditures), 2024 data, the latest year available. Thousand barrels × 42,000 = gallons.
- Population. Census Bureau American Community Survey 2024 1-year estimates, table B01003.
- Wholesale price. BLS producer price index for No. 2 diesel fuel, series WPU057303, August 2026 vs. a year earlier.
- Each state’s price. We matched each state to its EIA region using EIA’s map of states in each region. Alaska, Arizona, Hawaii, Nevada, Oregon and Washington use EIA’s “West Coast except California” price. California has its own price.
- diesel use is the same as in 2024 (high prices usually cut use a little, so the real total may be lower)
- every gallon pays the change in the retail on-highway price (farms and railroads often buy untaxed or bulk fuel at lower prices, but the year-over-year change in the underlying fuel cost is similar)
- a state’s diesel price moves with its region’s average.
Caveats
- Transportation diesel includes trucks, buses, railroads and boats. It is counted where the fuel is sold, so freight that crosses a state is charged to the state where it fills up.
- EIA’s 2024 expenditure figure is actual spending. Our extra cost compares to it only as a sense of scale.
- Recent fuel tax holidays in Georgia and Ohio are partly reflected in regional prices. We did not add or subtract any tax change by hand.
- Prices are not adjusted for inflation.
EIA, BLS and Census data are public domain. This page has no ads or affiliate links. Cite as: StartBusinessByState, “Diesel Shock Cost by State,” updated October 6, 2026, https://startbusinessbystate.com/diesel-shock-cost-by-state/
Related research
- Diesel and gas prices by state: this week’s EIA prices for every region, and what a year of fuel costs one work truck.
- Fuel tax holidays and dyed-diesel waivers by state: which states have paused taxes, and when the relief ends.
- The trucking squeeze by state: owner-operators, trucking jobs and diesel costs.
- Small businesses paying higher prices, by state: Census survey data on how many businesses face rising costs.
- Where business electricity costs rose the most.
FAQ
How much is the diesel price spike costing the U.S.?
About $115.7 billion a year, if diesel stayed at the week of Sep 28, 2026 price ($6.38) instead of the year-earlier price ($3.75). This is our modeled estimate using EIA prices and 2024 transportation diesel use. Counting all diesel and heating oil uses, it is about $153.2 billion.
Which state pays the most for the diesel shock?
Texas, at about $16.5 billion a year, because it burns the most diesel. Per resident, Wyoming is highest at about $1,755 a year.
Why is diesel so expensive in 2026?
Refined fuel supply is tight. Shipments of diesel and other refined products through the Strait of Hormuz are still well below normal after the Iran war began in late February 2026, and refinery outages and export limits elsewhere have added to the squeeze. EIA reported a record U.S. average of $6.529 a gallon the week of September 21, 2026.
Does this include the gas tax holidays?
Partly. Prices come from EIA’s weekly survey, which includes taxes. A state tax holiday lowers prices in that state, but EIA reports diesel by region, so the effect is blended into the regional average. See our fuel tax holiday and dyed-diesel tracker for which states have acted.
How much more does a work truck cost to fuel now?
For a diesel work truck driven 25,000 miles a year at 12 mpg (2,083 gallons), the $2.63 rise adds about $5,475 a year at the U.S. average. A long-haul semi at 100,000 miles and 6.5 mpg would pay about $40,431 more. These are example assumptions, not measured costs.
How often is this updated?
Weekly. EIA publishes diesel prices every Monday (Tuesday after a holiday), and we rerun the numbers after each release. State diesel use updates once a year when EIA releases new State Energy Data System figures.
Last updated October 6, 2026. Diesel prices through the week of September 28, 2026. Next EIA price release: the following Monday.