Original research · U.S. Census Bureau import and duty data · Federal Register tariff notices · Last updated October 7, 2026
Data through: August 2026 imports (Census, released about five weeks after month end). Refreshed monthly.
Imported tools and equipment for the trades we cover paid duties of 9.3% to 17.7% of their value from March through August 2026. That is calculated duties divided by import value, from U.S. Census Bureau trade data for 65 product codes. In the same months of 2024, before the 2025–26 tariff changes, the same baskets paid 2.0% to 6.4%. These are duty rates, not price changes: what a contractor pays at the counter also depends on supplier margins, exchange rates and demand.
Key findings
- Landscaping & tree care equipment has the highest rate: 17.7%. HVAC is next at 15.0%. In Mar–Aug 2024 these baskets paid 2.3% and 3.2%.
- Steel- and copper-heavy items carry the highest rates. Other iron/steel pipe fittings 52.8%; Copper-alloy pipe fittings 50.5%; Cast iron/steel pipe fittings 38.7%; Aluminum kitchenware 29.3%. Most of these fall under the Section 232 metals tariffs, which are 50% on steel, aluminum and copper articles, 25% on listed derivative products and 15% on some machinery.
- Products that often enter duty-free pay much less. Electrical panels and boards (6.7%) are the largest item by value, and 52.7% of their import value entered duty-free, for example under USMCA or other exemptions.
- The overall rate has eased since early 2026. All U.S. imports paid 9.1% in January–February 2026, when IEEPA duties were still collected, 6.7% from March through August 2026, and 6.8% in August 2026 alone. In the same months of 2024 the figure was 2.3%.
- The latest month, August 2026, is the first full month with the new Section 301 tiers. Trade rates that month ranged from 10.8% to 18.2%.
Effective tariff rate by trade
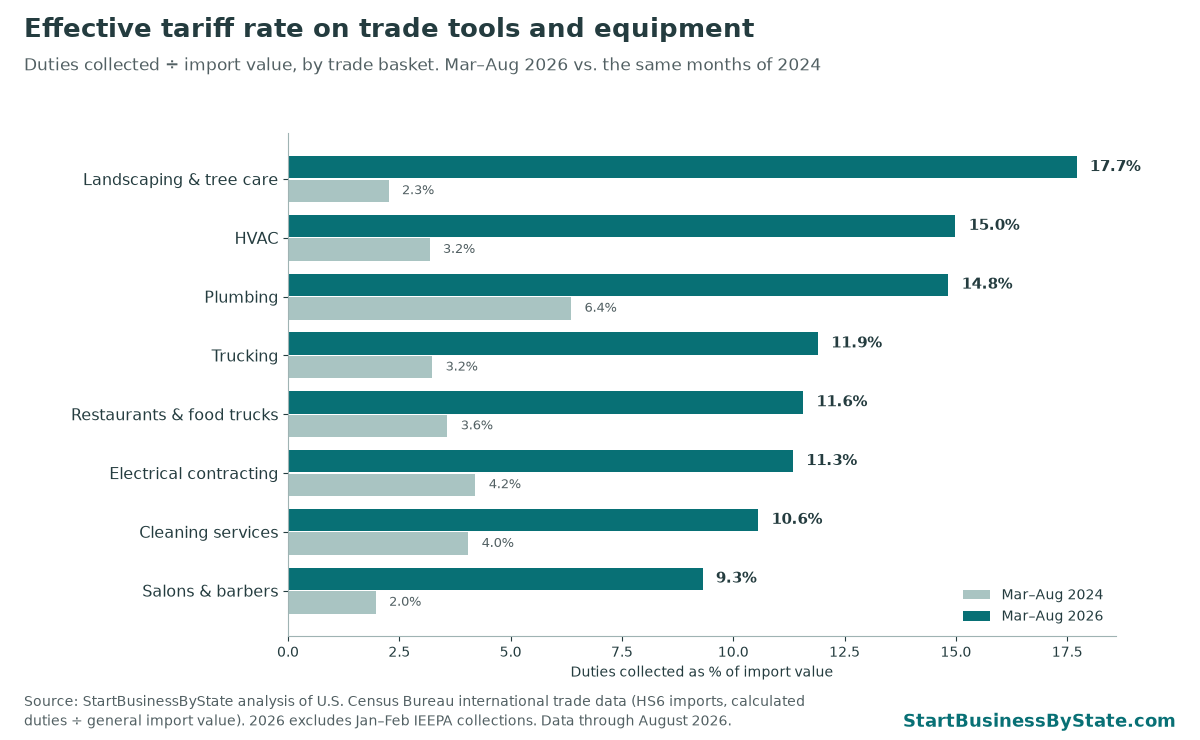
Click a column header to sort. Each trade’s rate is total duties on its basket divided by total import value, so high-value items count more.
| Trade | Rate, Mar–Aug 2026 | Rate, August 2026 | Rate, same months 2025 | Rate, same months 2024 | Imports, Mar–Aug 2026 | Entered duty-free |
|---|---|---|---|---|---|---|
| Landscaping & tree care | 17.7% | 18.2% | 9.6% | 2.3% | $893 million | 17.7% |
| HVAC | 15.0% | 12.9% | 11.5% | 3.2% | $11.4 billion | 23.4% |
| Plumbing | 14.8% | 15.4% | 15.5% | 6.4% | $8.5 billion | 26.3% |
| Trucking | 11.9% | 11.6% | 11.6% | 3.2% | $23.4 billion | 42.6% |
| Restaurants & food trucks | 11.6% | 12.0% | 16.2% | 3.6% | $6.5 billion | 37.8% |
| Electrical contracting | 11.3% | 11.4% | 12.8% | 4.2% | $25.5 billion | 42.1% |
| Cleaning services | 10.6% | 12.6% | 11.7% | 4.0% | $3.0 billion | 27.3% |
| Salons & barbers | 9.3% | 10.8% | 8.8% | 2.0% | $4.5 billion | 25.7% |
The 2025 column includes IEEPA duties that the Supreme Court later ruled unlawful and that are being refunded. “Entered duty-free” is the share of import value with no duty owed, for example USMCA goods from Canada and Mexico.
Download the data (CSV)Every product we track
Product names are our plain-English labels for each six-digit Harmonized System (HS) code. The Census description for each code is in the CSV.
| Product | HS code | Rate, Mar–Aug 2026 | Rate, August 2026 | Rate, same months 2024 | Imports, Mar–Aug 2026 |
|---|---|---|---|---|---|
| Landscaping & tree care | |||||
| Chainsaws | 8467.81 | 47.5% | 24.3% | 0.7% | $28 million |
| Other hand-held power tools (trimmers, blowers) | 8467.89 | 22.3% | 22.3% | 1.7% | $107 million |
| Powered rotary lawn mowers (horizontal cutting) | 8433.11 | 16.6% | 18.5% | 2.2% | $540 million |
| Hedge shears, two-hand pruners | 8201.60 | 16.0% | 16.3% | 10.2% | $19 million |
| One-hand pruners and shears | 8201.50 | 15.2% | 13.1% | 8.6% | $19 million |
| Other mowers, incl. tractor cutter bars | 8433.20 | 15.1% | 15.1% | 0.5% | $114 million |
| Portable agricultural/horticultural sprayers | 8424.41 | 14.7% | 22.0% | 3.8% | $13 million |
| Axes, bill hooks | 8201.40 | 13.4% | 14.3% | 8.5% | $19 million |
| Other powered lawn mowers | 8433.19 | 10.9% | 11.0% | 2.3% | $35 million |
| Plumbing | |||||
| Other iron/steel pipe fittings | 7307.99 | 52.8% | 54.7% | 9.9% | $183 million |
| Copper-alloy pipe fittings | 7412.20 | 50.5% | 53.4% | 7.5% | $349 million |
| Cast iron/steel pipe fittings | 7307.19 | 38.7% | 38.1% | 14.0% | $288 million |
| Check valves | 8481.30 | 15.2% | 15.5% | 8.7% | $301 million |
| Taps, faucets and valves (other) | 8481.80 | 12.6% | 13.0% | 6.8% | $5,966 million |
| Plastic sanitary ware (tanks, seats) | 3922.90 | 10.2% | 10.6% | 8.4% | $45 million |
| Tankless gas water heaters | 8419.11 | 8.9% | 11.3% | 0.8% | $306 million |
| Porcelain sinks, toilets, tubs | 6910.10 | 5.8% | 5.9% | 3.5% | $647 million |
| Rigid plastic pipe and tubing | 3917.23 | 5.0% | 6.8% | 2.3% | $102 million |
| Other water heaters | 8419.19 | 0.8% | 0.7% | 0.9% | $284 million |
| Electrical contracting | |||||
| Fluorescent lamps | 8539.31 | 26.9% | 28.1% | 16.3% | $29 million |
| Insulated wire with connectors, ≤1,000 V | 8544.42 | 25.7% | 26.0% | 7.4% | $4,841 million |
| Plugs and sockets | 8536.69 | 11.8% | 12.2% | 5.6% | $1,933 million |
| Insulated wire without connectors, ≤1,000 V | 8544.49 | 10.0% | 10.2% | 2.0% | $2,149 million |
| LED ceiling and wall fixtures | 9405.11 | 9.2% | 10.5% | 8.8% | $1,460 million |
| Switches, ≤1,000 V | 8536.50 | 8.8% | 9.3% | 2.9% | $1,606 million |
| Circuit breakers, ≤1,000 V | 8536.20 | 8.0% | 8.3% | 1.4% | $1,406 million |
| Electrical panels and boards, ≤1,000 V | 8537.10 | 6.7% | 6.6% | 2.9% | $12,061 million |
| HVAC | |||||
| Window and wall air conditioners | 8415.10 | 21.4% | 16.2% | 9.2% | $986 million |
| Split/heat-pump air conditioners (reversible) | 8415.81 | 16.8% | 14.1% | 3.6% | $294 million |
| Air conditioner parts | 8415.90 | 16.7% | 14.3% | 2.2% | $5,120 million |
| Other air conditioners with refrigeration | 8415.82 | 15.9% | 12.5% | 2.7% | $1,147 million |
| Air conditioners without refrigeration unit | 8415.83 | 15.6% | 19.0% | 0.9% | $250 million |
| Heat pumps (non-AC) | 8418.61 | 13.6% | 14.4% | 4.8% | $60 million |
| Other fans | 8414.59 | 11.3% | 11.3% | 5.3% | $2,080 million |
| Refrigeration compressors | 8414.30 | 8.8% | 8.4% | 1.6% | $1,446 million |
| Trucking | |||||
| Trailer parts | 8716.90 | 27.0% | 30.7% | 13.0% | $674 million |
| Truck and bus tires | 4011.20 | 21.2% | 21.3% | 3.3% | $3,117 million |
| Heavy trucks (diesel, >20 t) | 8704.23 | 15.4% | 14.5% | 0.1% | $982 million |
| Brakes and parts | 8708.30 | 14.2% | 14.1% | 7.3% | $3,432 million |
| Other freight trailers and semi-trailers | 8716.39 | 12.2% | 14.6% | 0.6% | $1,189 million |
| Other vehicle parts | 8708.99 | 10.8% | 10.0% | 3.2% | $7,887 million |
| Gearboxes and parts | 8708.40 | 5.2% | 4.8% | 1.6% | $6,014 million |
| Tanker trailers and semi-trailers | 8716.31 | 0.0% | 0.0% | 0.0% | $138 million |
| Cleaning services | |||||
| Mops, brooms and other cleaning brushes | 9603.90 | 14.5% | 15.9% | 6.2% | $382 million |
| Vacuum cleaners, ≤1,500 W | 8508.11 | 13.9% | 16.6% | 4.0% | $1,285 million |
| Other cleaning preparations | 3402.90 | 9.4% | 8.7% | 3.0% | $224 million |
| Other electric vacuum cleaners | 8508.19 | 7.8% | 8.3% | 9.9% | $139 million |
| Pressure washers and steam blasters | 8424.30 | 7.7% | 8.8% | 4.0% | $351 million |
| Non-electric/industrial vacuum cleaners | 8508.60 | 7.2% | 6.0% | 1.0% | $12 million |
| Retail washing and cleaning preparations | 3402.50 | 3.7% | 3.9% | 1.7% | $593 million |
| Restaurants & food trucks | |||||
| Aluminum foil | 7607.19 | 42.3% | 46.8% | 6.8% | $73 million |
| Aluminum kitchenware | 7615.10 | 29.3% | 28.6% | 5.6% | $416 million |
| Stainless steel kitchenware | 7323.93 | 26.2% | 25.6% | 1.9% | $640 million |
| Ovens, ranges and cooktops | 8516.60 | 22.8% | 26.0% | 4.1% | $896 million |
| Commercial cooking and food-warming equipment | 8419.81 | 10.0% | 9.7% | 1.6% | $737 million |
| Refrigerated display cases and counters | 8418.50 | 8.1% | 9.6% | 3.3% | $642 million |
| Commercial dishwashers | 8422.19 | 5.2% | 5.9% | 0.1% | $41 million |
| Other refrigerating equipment | 8418.69 | 3.2% | 3.3% | 4.6% | $3,043 million |
| Salons & barbers | |||||
| Hair clippers | 8510.20 | 22.6% | 23.7% | 17.1% | $119 million |
| Hair dryers | 8516.31 | 12.9% | 14.4% | 3.0% | $188 million |
| Other hairdressing appliances (irons, curlers) | 8516.32 | 12.6% | 13.8% | 2.6% | $272 million |
| Barber and salon chairs | 9402.10 | 9.7% | 11.1% | 0.0% | $43 million |
| Skin care and nail products | 3304.99 | 9.2% | 10.7% | 1.3% | $2,789 million |
| Other hair products | 3305.90 | 6.6% | 8.0% | 1.2% | $844 million |
| Shampoo | 3305.10 | 6.5% | 7.4% | 1.5% | $266 million |
Month by month
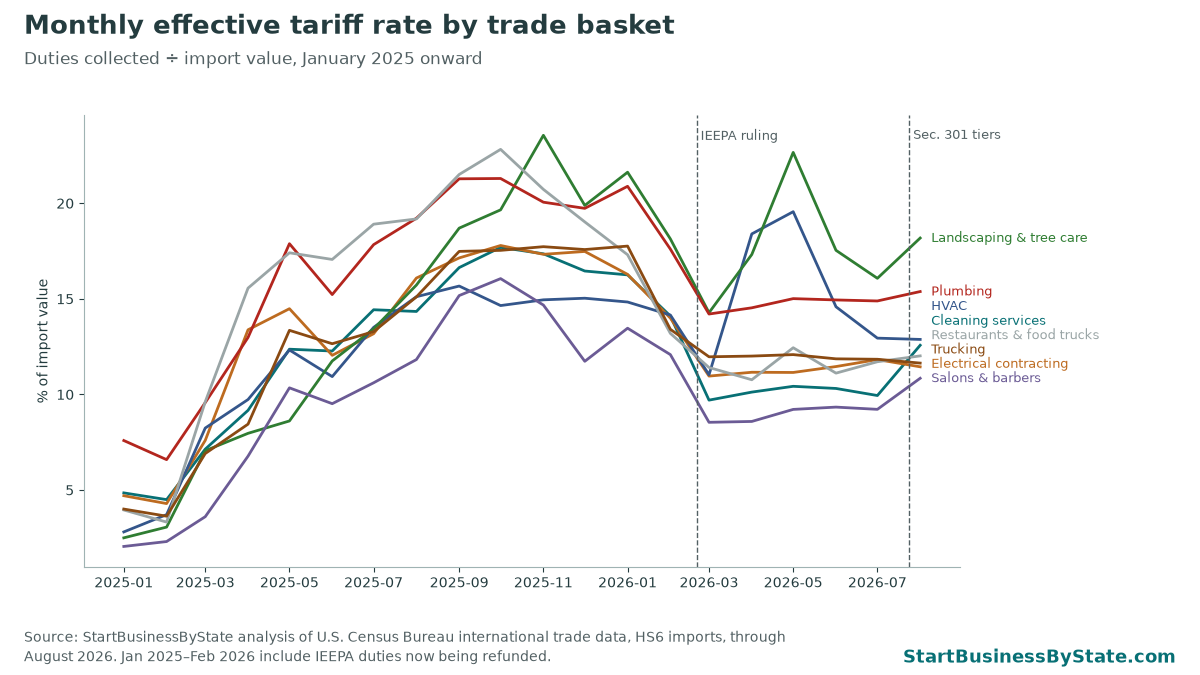
Rates rose through 2025 as new tariffs took effect, dropped after the IEEPA duties ended in late February 2026, and have moved within a narrower range since. Monthly figures can jump when a large shipment of a high- or low-duty item arrives, so the multi-month rate in the tables is the steadier number.
Which tariffs apply in 2026
We checked each of these against the Federal Register on October 7, 2026.
- Feb 20, 2026. The Supreme Court rules 6–3 in Learning Resources, Inc. v. Trump that IEEPA does not authorize tariffs. Executive Order 14389 ends collection of the IEEPA duties. (91 FR 9437)
- Feb 24, 2026. A temporary 10% import surcharge under Section 122 of the Trade Act of 1974 takes effect for up to 150 days, with listed exceptions. The stated purpose is to address the U.S. balance-of-payments deficit. (91 FR 9339 (Proclamation 11012))
- Apr 6, 2026. Section 232 metals duties are restructured: 50% on steel, aluminum and most copper articles, 25% on listed derivative products, applied to the full customs value. (91 FR 18201 (Proclamation 11021))
- Jun 8, 2026. Section 232 is adjusted again: agricultural equipment and some residential HVAC systems move to a temporary 15% derivative rate through Dec 31, 2027. (91 FR 34085 (Proclamation 11032))
- Jul 24, 2026. USTR Section 301 tariffs replace the Section 122 surcharge: 10% or 12.5% on most goods from 60 economies, tied to forced-labor import rules. Goods covered by Section 232 are exempt, and USMCA-qualifying goods from Canada and Mexico are not covered. (91 FR 47318; presidential memorandum 91 FR 47717)
Still in force alongside these:
- Section 232 steel and aluminum raised to 50% (from 25%) effective June 4, 2025. (FR Doc. 2025-10524)
- July 2026 aluminum changes, including an incentive program for companies building new U.S. primary aluminum capacity. (91 FR 46635 (Proclamation 11045))
- Section 232 softwood lumber and timber, 10% (since Oct 14, 2025); kitchen cabinets and vanities 50% and upholstered furniture 30% since Jan 1, 2026. (90 FR 48127 (Proclamation 10976))
- Section 232 copper, 50% on semi-finished copper and copper-intensive derivatives (since Aug 1, 2025). Refined copper was not covered; the proclamation asked Commerce to report by Jun 30, 2026 on whether a phased 15% (2027) and 30% (2028) duty on refined copper is warranted. (90 FR 37727 (Proclamation 10962))
- Section 301 tariffs on many goods from China, in place since 2018–19 and continued by USTR on Oct 7, 2026. (FR Doc. 2026-20510)
The stated purpose of the Section 232 metals tariffs is national security: to keep enough U.S. steel, aluminum and copper production for defense and critical infrastructure. In the April 2026 proclamation, the administration said steel capacity use had risen from about 72.3% in 2017 to about 77.2%, and aluminum from about 39% to about 50.4%, and set a goal of higher sustained use. For what has happened to U.S. metal prices, production and jobs since, see our construction materials prices since the tariffs page.
What it means for your business
- Know which of your purchases are imported. A U.S.-built mower or a USMCA-qualifying panel from Mexico may owe no duty. The rate here is an average across all imports of that product.
- Ask suppliers how they price duties. Some distributors add a separate tariff surcharge, and others fold it into list prices. If a surcharge is tied to a duty rate, ask which rate and when it will be reviewed.
- Check for a refund if you imported directly. If your business was the importer of record and paid IEEPA duties in 2025 or early 2026, you may be owed money. See our tariff refund guide.
- Trade-specific detail. HVAC contractors can model equipment costs on our Section 232 HVAC scenarios page. For state import totals by trade, see tariff exposure by state.
How we did this
- Source. U.S. Census Bureau international trade API, endpoint timeseries/intltrade/imports/hs, six-digit HS (COMM_LVL=HS6), variables GEN_VAL_MO (general imports, customs value), CAL_DUT_MO (calculated duty) and DUT_VAL_MO (dutiable value). Pulled October 7, 2026.
- Rate. Sum of calculated duties ÷ sum of general import value over the period, for each product and each trade basket. Periods: March–August of 2026, 2025 and 2024, plus August 2026 alone.
- Baskets. 65 HS6 codes picked to represent each trade’s common tools, equipment and supplies. Each code is in only one basket. Plumbing and HVAC contractors share a NAICS code but have separate baskets here.
- Tariff rules. Federal Register documents listed above, checked October 7, 2026.
Caveats
- Calculated duty is what CBP assessed on the entry. It is not revised for later refunds or for duties settled after liquidation.
- An HS6 code can include products used outside the trade. Pipe fittings also go to factories, electrical panels to data centers and utilities, and the trucking basket’s gearbox and other-parts codes cover cars as well as trucks.
- Duty rates are not price changes. Prices depend on who absorbs the duty, currency moves, input costs and demand.
- Census data lags about five weeks and earlier months can be revised.
Census Bureau data is public domain. This page has no ads or affiliate links. Cite as: StartBusinessByState, “Tariff Rates on Trade Tools and Equipment,” updated October 7, 2026, https://startbusinessbystate.com/tariff-rate-by-trade-tools-equipment/
Related research
- Tariff exposure for trade goods by state: how much each state imports of these products, with estimated duties.
- Construction material prices since the tariffs: U.S. vs. world prices for steel, copper and aluminum.
- Tariff refunds by state: how to claim back IEEPA duties.
- Small businesses raising prices, by state.
- Industry data: landscaping, HVAC, cleaning, food trucks, salons, trucking.
- tariffs on restaurant food by item: effective tariff rates on coffee, beef, cheese, foil and more.
FAQ
What is the tariff rate on landscaping equipment in 2026?
Imported landscaping and tree-care equipment (mowers, chainsaws, trimmers, pruners and sprayers) paid duties equal to 17.7% of import value from March through August 2026, based on Census Bureau trade data. In the same months of 2024 it was 2.3%.
What is an effective tariff rate?
It is the duty actually collected divided by the value of everything imported in that category, including goods that enter duty-free. It is usually lower than the headline tariff rate, because some goods qualify for USMCA or other exemptions and some come from countries with lower rates.
Do tariffs raise the price I pay by the same amount?
Not necessarily. The importer pays the duty. How much reaches you depends on whether the foreign seller, importer, distributor or retailer absorbs part of it, on exchange rates and on demand. A product that is mostly made in the U.S. may have no duty at all. Duty rates measure the tax at the border, not the shelf price.
Why do you start in March 2026?
The IEEPA tariffs collected until February 23, 2026 were ruled unlawful by the Supreme Court and are being refunded. Census data still counts them, so using March onward avoids overstating current rates.
Which tariffs are included?
All duties CBP calculated on the entries: regular (MFN) duties, Section 232 metals and lumber duties, Section 301 duties (including the 2018–19 China tariffs and the July 2026 tiers), the temporary Section 122 surcharge until July 23, 2026, and antidumping or countervailing duties where Census records them in calculated duties.
How often is this updated?
Monthly, after the Census Bureau releases import data, about five weeks after the month ends.
Last updated October 7, 2026. Import data through August 2026.