Original research · BLS producer prices · IMF and Eurostat world prices · Federal Reserve industrial production · Last updated October 7, 2026
Data through: BLS producer prices for August 2026 (preliminary). World prices through August 2026. Refreshed monthly.
U.S. prices for steel, copper and aluminum products are higher than a year ago. For steel and aluminum, part of the rise was not seen abroad; for copper, the world price rose faster than the U.S. price. Over the year to July 2026, U.S. copper mill-shape prices moved +18.4% while the world copper price moved +38.6%. U.S. aluminum shapes moved +40.5% vs. +21.2% worldwide, and U.S. steel +23.4% vs. +7.8% for EU steel producers. Tariffs are one cause of the U.S.-only gap. World metal demand, energy costs and mill capacity move prices in both places.
Key findings
- Steel mill products: +23.4% over the year, +17.2% since February 2026. U.S. steel prices rose 23.4% over the year to August 2026; the world benchmark rose 7.8%. That leaves about 15.6 percentage points of the U.S. change that was not seen abroad. The 50% Section 232 steel rate has applied since June 2025.
- Copper: the rise is mostly global. U.S. copper prices rose 18.4% over the year to July 2026; the world benchmark rose 38.6%. U.S. prices rose 20.2 points less than the world price, so over this period there was no extra U.S.-only increase. World copper prices have been pushed up by demand from power grids, electric vehicles and data centers, along with mine supply problems.
- Aluminum: about half of the U.S. rise was not seen abroad. U.S. aluminum prices rose 40.5% over the year to July 2026; the world benchmark rose 21.2%. That leaves about 19.4 percentage points of the U.S. change that was not seen abroad. Aluminum carries the 50% Section 232 rate.
- Softwood lumber: +11.8% over the year. Lumber carries a 10% Section 232 duty since October 2025, on top of antidumping and countervailing duties on Canadian lumber, but prices also follow housing starts and mill supply.
- U.S. metal output and jobs, the policy’s stated goal, are mixed. Steel output is +2.8% over the year to August 2026 and steel capacity use is 73.4% (+1.6 points). Aluminum output is −9.3%. Steel-mill jobs are 86.0 thousand, +0.4 thousand from a year earlier. (The Federal Reserve capacity measure differs from the Commerce figure cited in the proclamation.)
Producer prices by material
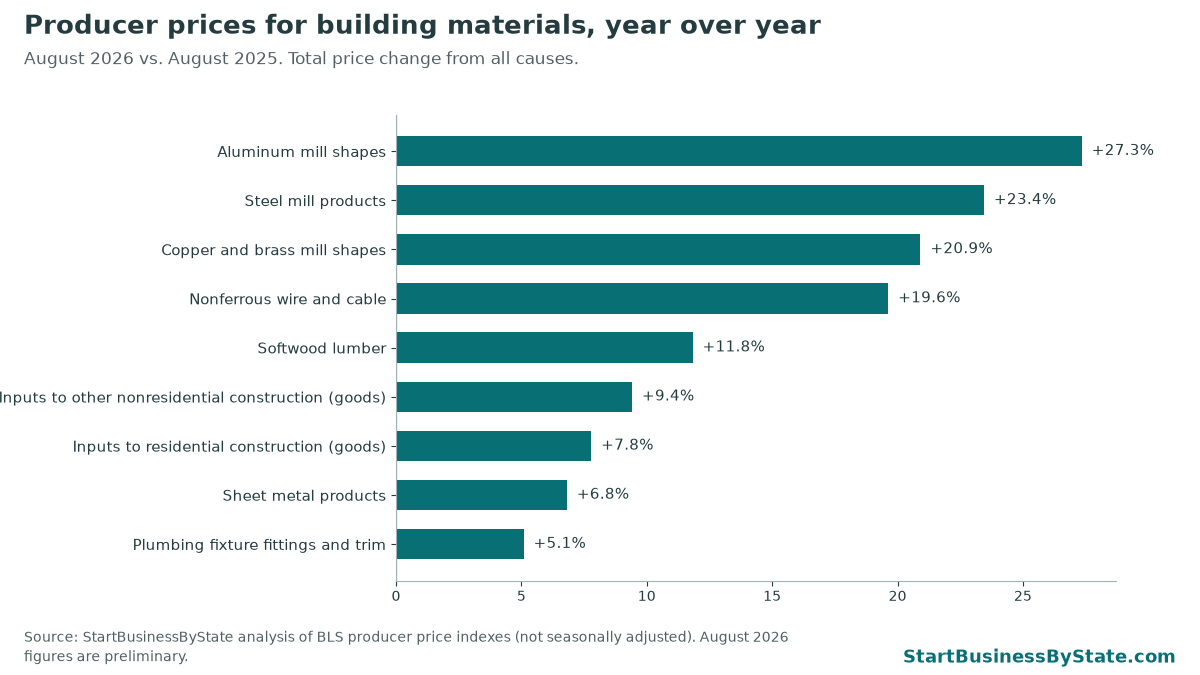
These are total changes in the prices U.S. producers receive. They include tariffs, world commodity prices, energy, labor and demand. The tariff share cannot be read from these numbers alone. “Since February 2026” measures from the month before the post-IEEPA period began.
| Material | BLS series | Year over year, August 2026 | Since Feb 2026 | Since Jul 2025 |
|---|---|---|---|---|
| Aluminum mill shapes | WPU102501 | +27.3% | +6.2% | +34.3% |
| Steel mill products | WPU1017 | +23.4% | +17.2% | +24.8% |
| Copper and brass mill shapes | WPU102502 | +20.9% | +6.3% | +22.6% |
| Nonferrous wire and cable | WPU1026 | +19.6% | +8.4% | +14.9% |
| Softwood lumber | WPU0811 | +11.8% | +9.1% | +12.8% |
| Inputs to other nonresidential construction (goods) | WPUIP2312301 | +9.4% | +7.5% | +9.5% |
| Inputs to residential construction (goods) | WPUIP2311001 | +7.8% | +5.8% | +8.0% |
| Sheet metal products | WPU1073 | +6.8% | +5.0% | +6.9% |
| Plumbing fixture fittings and trim | WPU1054 | +5.1% | +0.4% | +5.1% |
U.S. prices vs. world benchmarks
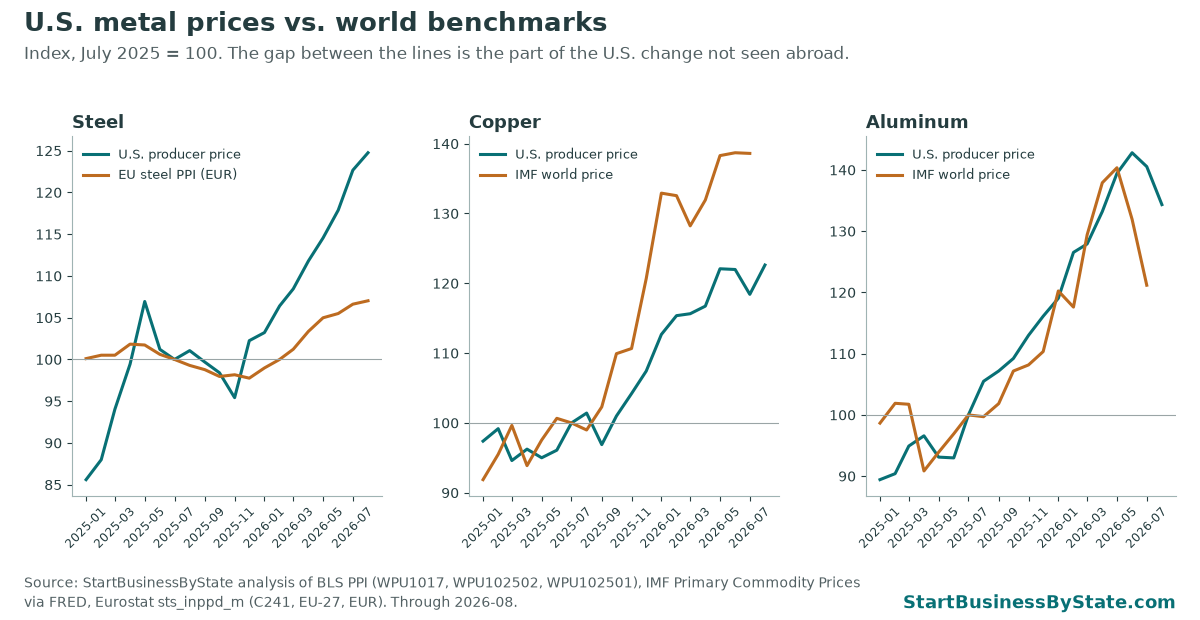
If U.S. and world prices rise by the same amount, the cause is mostly global. The gap is the part of the change seen only in the U.S. Tariffs are the main U.S.-only policy factor, but U.S. demand, freight costs and plant outages also differ, so the gap is an upper bound on the tariff effect, not a measure of it.
| Metal | Month | U.S., year over year | World, year over year | U.S. minus world | U.S., since Feb 2026 | World, since Feb 2026 | World benchmark |
|---|---|---|---|---|---|---|---|
| Copper | July 2026 | +18.4% | +38.6% | -20.2 pts | +2.6% | +4.6% | IMF global copper price (USD/tonne), via FRED PCOPPUSDM |
| Aluminum | July 2026 | +40.5% | +21.2% | +19.4 pts | +11.1% | +3.0% | IMF global aluminum price (USD/tonne), via FRED PALUMUSDM |
| Steel | August 2026 | +23.4% | +7.8% | +15.6 pts | +17.2% | +7.0% | Eurostat EU-27 producer prices, basic iron and steel (C241), domestic market, EUR index |
U.S. figures are BLS producer price indexes for mill products (shapes, sheet, wire rod and similar), which include fabrication. World copper and aluminum are IMF raw-metal prices in U.S. dollars. EU steel is in euros.
Other things moving these prices
- Copper demand. Electrical grids, data centers and electric vehicles use large amounts of copper, and new mine supply has been slow. This lifts the world price as well as the U.S. price. Source: World Bank Commodity Markets Outlook; IMF price data above.
- Expected copper tariffs. The 2025 copper proclamation asked Commerce whether to add a 15% duty on refined copper in 2027 and 30% in 2028. Buyers who expect a future duty may stock up early, which can raise U.S. prices before any duty applies.
- Steel capacity and energy. Steel prices move with mill capacity use, scrap and iron ore prices, and electricity and natural gas costs. The IMF iron ore price is in the CSV for reference.
- Construction demand. Building activity affects lumber, steel and copper wire. See our housing permits vs. builder jobs page for the latest permit data.
- Exchange rates. A weaker dollar makes imported metal cost more in dollars even with no tariff change.
U.S. metal output and jobs
The stated purpose of the Section 232 metals tariffs is national security: to keep enough U.S. steel, aluminum and copper production for defense and critical infrastructure. In the April 2026 proclamation, the administration said steel capacity use had risen from about 72.3% in 2017 to about 77.2%, and aluminum from about 39% to about 50.4%, and set a goal of higher sustained use. The table shows official data on whether output and jobs have moved since.
| Measure | Month | Latest | Year earlier | Change |
|---|---|---|---|---|
| Steel output (industrial production index) | August 2026 | 111.1 | 108.1 | +2.8% |
| Steel capacity use (%) | August 2026 | 73.4 | 71.8 | +1.6 |
| Aluminum output (industrial production index) | August 2026 | 96.7 | 106.6 | −9.3% |
| Copper and other nonferrous output (industrial production index) | August 2026 | 94.0 | 94.3 | −0.3% |
| Iron and steel mills and ferroalloy jobs (thousands) | August 2026 | 86.0 | 85.6 | +0.4 |
| Alumina, aluminum and other nonferrous metal jobs (thousands) | August 2026 | 122.9 | 120.5 | +2.4 |
Industrial production and capacity use: Federal Reserve G.17 via FRED (IPG3311A2S, CAPUTLG3311A2S, IPG3313S, IPG3314S), seasonally adjusted. Jobs: BLS Current Employment Statistics, not seasonally adjusted. Capacity use change is in percentage points; job change in thousands.
Tariff rules that apply to these materials
- Feb 20, 2026. The Supreme Court rules 6–3 in Learning Resources, Inc. v. Trump that IEEPA does not authorize tariffs. Executive Order 14389 ends collection of the IEEPA duties. (91 FR 9437)
- Feb 24, 2026. A temporary 10% import surcharge under Section 122 of the Trade Act of 1974 takes effect for up to 150 days, with listed exceptions. The stated purpose is to address the U.S. balance-of-payments deficit. (91 FR 9339 (Proclamation 11012))
- Apr 6, 2026. Section 232 metals duties are restructured: 50% on steel, aluminum and most copper articles, 25% on listed derivative products, applied to the full customs value. (91 FR 18201 (Proclamation 11021))
- Jun 8, 2026. Section 232 is adjusted again: agricultural equipment and some residential HVAC systems move to a temporary 15% derivative rate through Dec 31, 2027. (91 FR 34085 (Proclamation 11032))
- Jul 24, 2026. USTR Section 301 tariffs replace the Section 122 surcharge: 10% or 12.5% on most goods from 60 economies, tied to forced-labor import rules. Goods covered by Section 232 are exempt, and USMCA-qualifying goods from Canada and Mexico are not covered. (91 FR 47318; presidential memorandum 91 FR 47717)
Still in force alongside these:
- Section 232 steel and aluminum raised to 50% (from 25%) effective June 4, 2025. (FR Doc. 2025-10524)
- July 2026 aluminum changes, including an incentive program for companies building new U.S. primary aluminum capacity. (91 FR 46635 (Proclamation 11045))
- Section 232 softwood lumber and timber, 10% (since Oct 14, 2025); kitchen cabinets and vanities 50% and upholstered furniture 30% since Jan 1, 2026. (90 FR 48127 (Proclamation 10976))
- Section 232 copper, 50% on semi-finished copper and copper-intensive derivatives (since Aug 1, 2025). Refined copper was not covered; the proclamation asked Commerce to report by Jun 30, 2026 on whether a phased 15% (2027) and 30% (2028) duty on refined copper is warranted. (90 FR 37727 (Proclamation 10962))
- Section 301 tariffs on many goods from China, in place since 2018–19 and continued by USTR on Oct 7, 2026. (FR Doc. 2026-20510)
What it means for contractors
- Price jobs off current material quotes. Copper wire and fittings have moved the most. Electricians and plumbers bidding jobs that start months out may want an escalation clause tied to a published index such as the BLS series above.
- Separate duty from price. The duty rate on imported fittings or panels is on our tariff rates by trade page. Domestic products can rise in price without paying any duty.
- HVAC equipment. See our Section 232 HVAC scenarios for how the 15% and 25% derivative rates affect equipment costs.
How we did this
- U.S. prices. BLS producer price indexes, not seasonally adjusted: WPU1017 (Steel mill products), WPU102502 (Copper and brass mill shapes), WPU102501 (Aluminum mill shapes), WPU0811 (Softwood lumber), WPU1026 (Nonferrous wire and cable), WPU1054 (Plumbing fixture fittings and trim), WPU1073 (Sheet metal products), WPUIP2311001 (Inputs to residential construction (goods)), WPUIP2312301 (Inputs to other nonresidential construction (goods)). BLS API v2, pulled October 7, 2026. The latest four months are preliminary and can be revised.
- World prices. IMF Primary Commodity Prices, copper (PCOPPUSDM), aluminum (PALUMUSDM) and iron ore (PIORECRUSDM), via FRED. Eurostat sts_inppd_m, EU-27 producer prices in industry, domestic market, NACE C24.1 basic iron and steel, 2021=100, not seasonally adjusted.
- Output and jobs. Federal Reserve G.17 industrial production and capacity use via FRED; BLS CES series CEU3133110001, CEU3133140001.
- Comparison. Percent change between the same months for both series. “U.S. minus world” is the difference in percentage points.
Caveats
- BLS mill-product indexes include processing and are not the same product as raw metal, so they would not move one-for-one with world metal prices even with no tariffs.
- EU steel prices are in euros and reflect EU conditions, including EU safeguard measures.
- These comparisons show how much of the change is U.S.-specific. They do not prove what caused it.
BLS and Federal Reserve data are public domain; IMF and Eurostat data are used under their open-data terms. This page has no ads or affiliate links. Cite as: StartBusinessByState, “Construction Material Prices Since the Tariffs,” updated October 7, 2026, https://startbusinessbystate.com/construction-materials-tariff-prices-2026/
Related research
- Tariff rates on trade tools and equipment: duty rates by trade.
- Tariff exposure for trade goods by state.
- HVAC Section 232 tariff scenarios.
- Housing permits vs. builder jobs by state.
- Small businesses raising prices, by state.
- Trade guides: plumbing, electrical, HVAC.
- Canada trade war exposure by state: each state’s exports to Canada and top products.
FAQ
Are tariffs the reason steel and copper prices are up?
They are one reason. Producer price indexes measure the total price change and cannot separate out the tariff share. Comparing U.S. prices with world benchmarks over the same months shows how much of the change is specific to the U.S.; tariffs are the main U.S.-specific policy difference, but U.S. demand, freight and mill outages also differ.
How much more does copper cost in the U.S. than worldwide?
Over the year to July 2026, the BLS index for U.S. copper and brass mill shapes rose 18.4%, compared with +38.6% for the IMF world copper price. Refined copper cathode was not covered by the 2025 Section 232 copper tariff; semi-finished products and copper-heavy derivatives were.
What is the stated purpose of the Section 232 metals tariffs?
National security. The proclamations say the goal is to keep enough domestic steel, aluminum and copper production for defense and critical infrastructure, and they track capacity use as a measure of progress.
Has U.S. steel production gone up?
The Federal Reserve’s industrial production index for iron and steel was +2.8% over the year to August 2026, and capacity use was 73.4%. Steel-mill employment was 86.0 thousand in August 2026.
Why do you compare U.S. steel with EU steel prices?
There is no official world steel price in the IMF or World Bank commodity tables. Eurostat’s producer price index for basic iron and steel in the EU is an official series for another large steel market. It is in euros, so exchange-rate moves affect the comparison.
How often is this updated?
Monthly, after BLS releases producer prices (mid-month). World prices update monthly from the IMF and Eurostat.
Last updated October 7, 2026. Producer prices through August 2026.