2025 annual averages (BLS QCEW) and CPI through Aug. 2026 · Updated by StartBusinessByState
Short answer: Restaurant closings make headlines, but the net count of U.S. restaurants is still growing, just slowly. Employment was flat in 2025 (+0.1%), and average weekly pay per restaurant worker rose 2.7%. Menu prices are up 39.4% since August 2019, faster than overall prices (30.6%) and groceries (33.3%).
Key facts
- 627,086 restaurant and bar establishments (NAICS 7225) in 2025, a net gain of 7,167 from 2024.
- 11 states had fewer restaurants in 2025 than in 2024. The biggest drops: Montana (-4.8%), North Carolina (-3.1%), Oregon (-1.8%), Idaho (-1.7%).
- Biggest gains: Michigan (+5.6%), Arkansas (+4.9%), Massachusetts (+3.3%), Utah (+3.1%).
- Only New Mexico has fewer restaurants than in 2019 (-0.7%).
- Restaurant prices: +3.4% year over year (Aug. 2026). Full-service +3.5%, limited-service +3.2%, groceries +2.2%.
- Average weekly wage for restaurant workers: $535 in 2025, up 38.2% since 2019 ($387). Many restaurant jobs are part-time, so this isn’t a full-time salary.
Where restaurant counts rose and fell
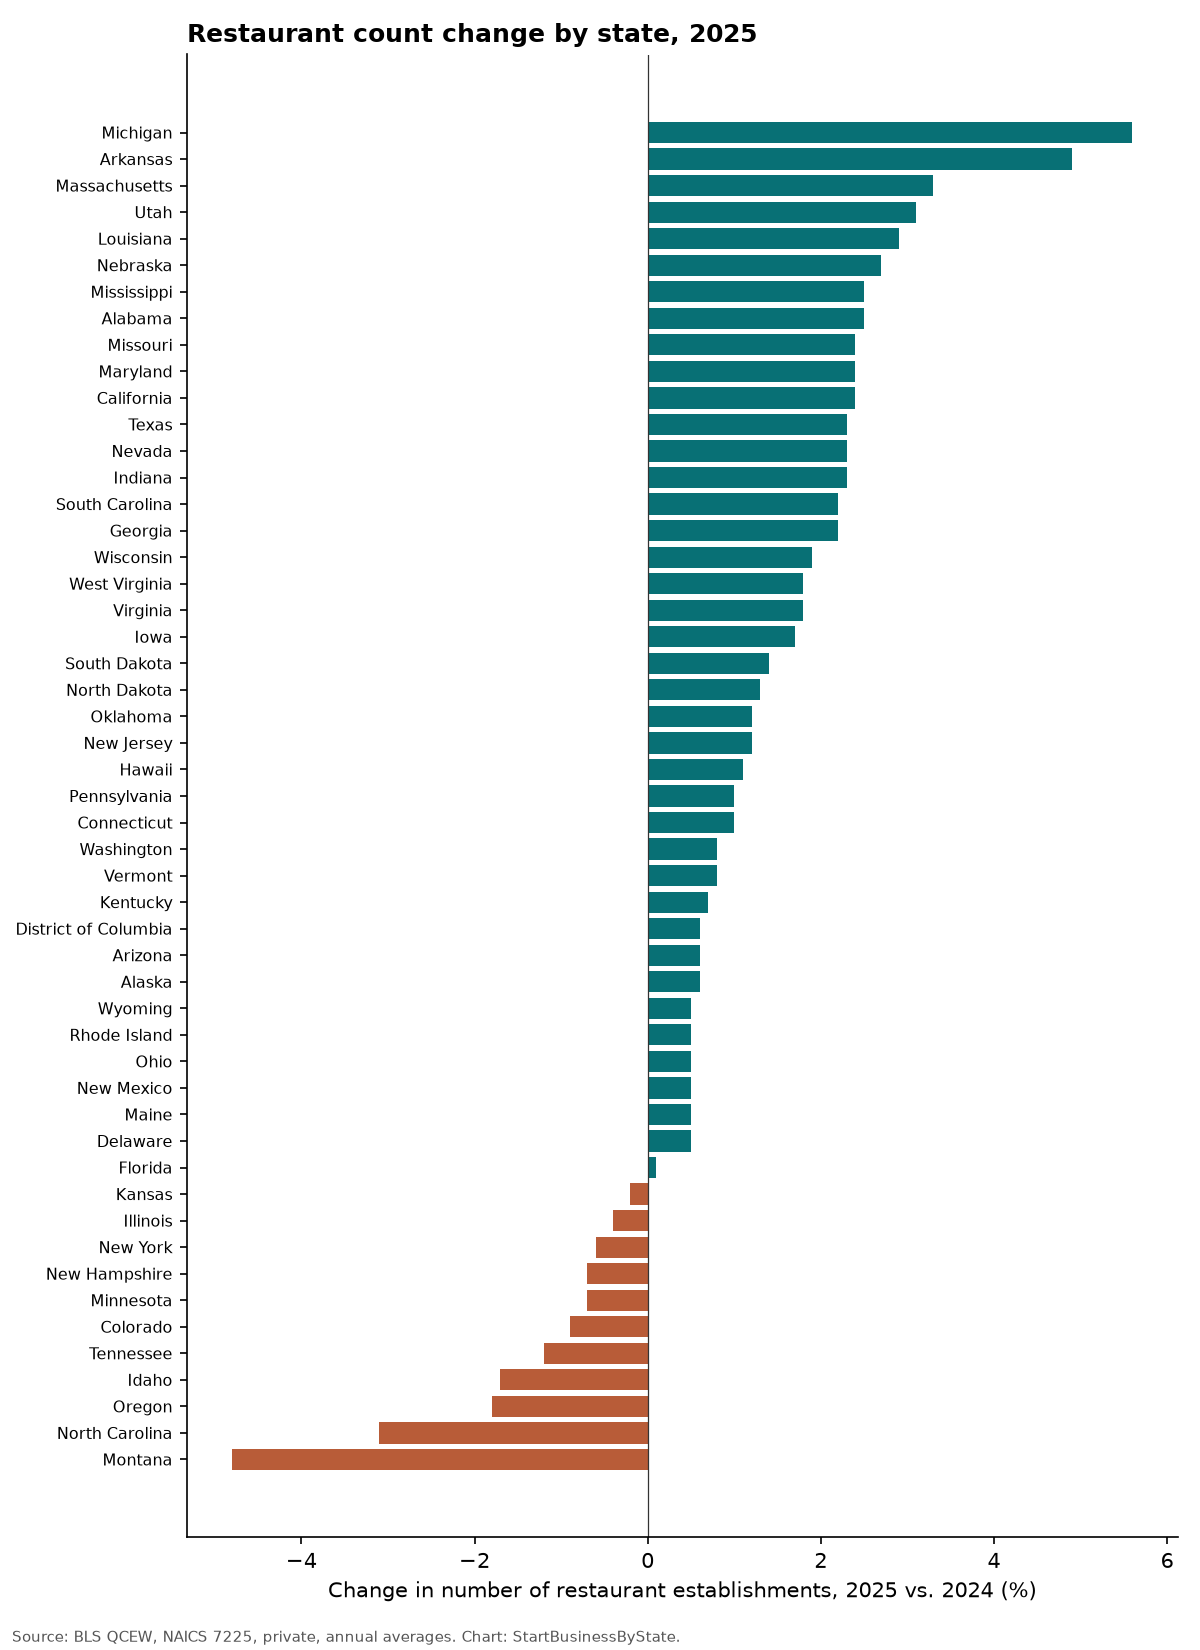
These are net counts: openings minus closings. A state can lose many restaurants and still post a gain if more open. 16 states had fewer restaurant jobs in 2025 than in 2024, even where the number of locations grew. That points to smaller staffs per location.
Menu prices vs. inflation
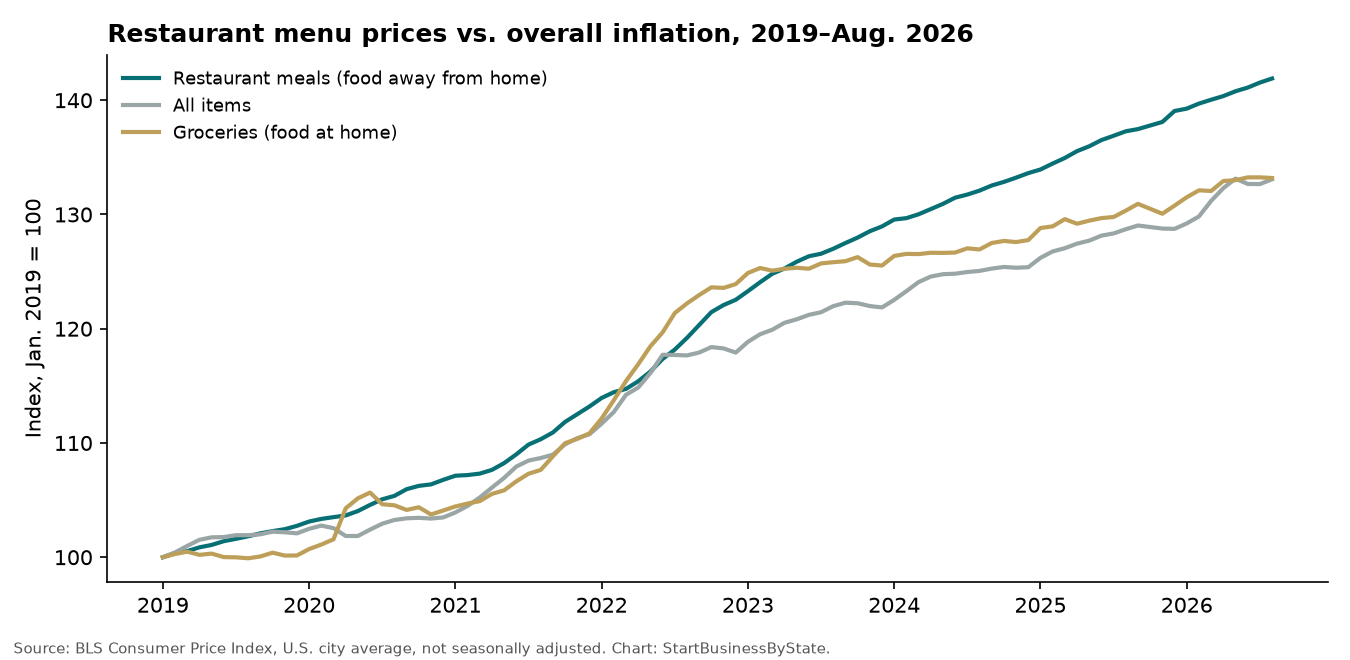
Restaurant menu prices have risen faster than overall inflation since 2019. In the past year the gap closed: menu prices and all items both rose 3.4%, and grocery prices rose more slowly. For background on wage floors, see 2027 minimum wage by state and tip credit by state.
Restaurants by state, 2025
| State | Restaurants, 2025 | Change vs 2024 | Change vs 2019 | Jobs, 2025 | Jobs vs 2024 | Avg weekly wage | Wage vs 2019 |
|---|---|---|---|---|---|---|---|
| U.S. total | 627,086 | +1.2% | +10.0% | 11,002,731 | +0.1% | $535 | +38.2% |
| Alabama | 9,359 | +2.5% | +17.0% | 162,468 | +1.6% | $442 | +39.0% |
| Alaska | 1,237 | +0.6% | +3.5% | 18,608 | n/a | $591 | +40.4% |
| Arizona | 10,868 | +0.6% | +16.3% | 243,770 | +1.2% | $566 | +38.7% |
| Arkansas | 5,500 | +4.9% | +11.3% | 98,780 | +1.8% | $421 | +34.1% |
| California | 79,525 | +2.4% | +7.8% | 1,320,621 | -0.8% | $643 | +39.8% |
| Colorado | 11,150 | -0.9% | +5.3% | 214,931 | -1.5% | $616 | +40.3% |
| Connecticut | 8,004 | +1.0% | +8.2% | 104,977 | +0.6% | $588 | +41.7% |
| Delaware | 2,146 | +0.5% | +14.8% | 36,192 | -1.6% | $517 | +39.7% |
| District of Columbia | 2,240 | +0.6% | +6.5% | 42,337 | -2.4% | $797 | +36.5% |
| Florida | 42,435 | +0.1% | +13.0% | 788,768 | +0.2% | $606 | +50.0% |
| Georgia | 22,034 | +2.2% | +24.6% | 377,163 | +0.2% | $483 | +39.6% |
| Hawaii | 3,988 | +1.1% | +19.3% | 60,988 | +1.2% | $665 | +36.6% |
| Idaho | 3,719 | -1.7% | +28.7% | 61,762 | +1.2% | $439 | +41.6% |
| Illinois | 21,835 | -0.4% | +2.8% | 393,855 | +0.2% | $551 | +42.4% |
| Indiana | 11,754 | +2.3% | +11.4% | 224,609 | +0.1% | $433 | +37.9% |
| Iowa | 5,353 | +1.7% | +5.5% | 94,770 | +0.7% | $400 | +34.7% |
| Kansas | 4,884 | -0.2% | +4.1% | 96,441 | -0.8% | $423 | +35.6% |
| Kentucky | 8,035 | +0.7% | +14.9% | 151,228 | +0.1% | $446 | +38.9% |
| Louisiana | 9,876 | +2.9% | +18.9% | 152,999 | +0.6% | $432 | +31.7% |
| Maine | 3,047 | +0.5% | +5.4% | 43,258 | +0.2% | $595 | +45.1% |
| Maryland | 10,473 | +2.4% | +2.5% | 180,801 | -0.4% | $540 | +35.7% |
| Massachusetts | 13,826 | +3.3% | +0.5% | 233,568 | -0.4% | $634 | +37.5% |
| Michigan | 16,230 | +5.6% | +13.5% | 291,435 | +0.5% | $470 | +37.8% |
| Minnesota | 9,197 | -0.7% | +6.9% | 171,539 | -0.7% | $498 | +35.3% |
| Mississippi | 5,580 | +2.5% | +22.4% | 94,581 | +0.6% | $385 | +36.0% |
| Missouri | 10,901 | +2.4% | +9.7% | 206,687 | -0.5% | $481 | +43.2% |
| Montana | 2,154 | -4.8% | +1.4% | 37,947 | -1.9% | $484 | +44.0% |
| Nebraska | 3,540 | +2.7% | +7.1% | 65,972 | +0.8% | $429 | +35.8% |
| Nevada | 6,382 | +2.3% | +17.6% | 133,852 | +0.7% | $597 | +39.5% |
| New Hampshire | 3,052 | -0.7% | +6.9% | 49,673 | n/a | $580 | +40.1% |
| New Jersey | 17,944 | +1.2% | +9.0% | 241,846 | +1.1% | $578 | +44.1% |
| New Mexico | 3,294 | +0.5% | -0.7% | 68,717 | -0.3% | $487 | +41.2% |
| New York | 43,966 | -0.6% | +2.2% | 572,751 | +0.0% | $679 | +29.3% |
| North Carolina | 20,180 | -3.1% | +13.9% | 380,627 | +0.1% | $467 | +41.9% |
| North Dakota | 1,354 | +1.3% | +12.0% | 24,679 | +1.2% | $461 | +31.7% |
| Ohio | 21,189 | +0.5% | +8.2% | 407,016 | -0.5% | $440 | +35.8% |
| Oklahoma | 6,909 | +1.2% | +9.1% | 138,377 | +0.7% | $419 | +33.9% |
| Oregon | 9,506 | -1.8% | +5.4% | 136,094 | -0.2% | $562 | +33.8% |
| Pennsylvania | 22,198 | +1.0% | +2.8% | 356,665 | +0.7% | $456 | +35.3% |
| Rhode Island | 2,605 | +0.5% | +5.0% | 40,544 | +0.4% | $562 | +40.9% |
| South Carolina | 10,273 | +2.2% | +14.2% | 194,499 | +0.5% | $467 | +42.4% |
| South Dakota | 1,563 | +1.4% | +9.5% | 28,950 | +0.5% | $437 | +37.0% |
| Tennessee | 13,077 | -1.2% | +18.4% | 259,888 | -0.2% | $498 | +40.7% |
| Texas | 52,862 | +2.3% | +18.1% | 1,122,727 | +0.8% | $494 | +31.0% |
| Utah | 5,770 | +3.1% | +20.9% | 111,433 | +0.2% | $453 | +37.3% |
| Vermont | 1,221 | +0.8% | +6.0% | 16,442 | n/a | $548 | +36.0% |
| Virginia | 16,100 | +1.8% | +10.1% | 282,133 | -0.1% | $513 | +42.5% |
| Washington | 14,752 | +0.8% | +5.6% | 219,570 | -1.6% | $635 | +38.3% |
| West Virginia | 3,016 | +1.8% | +7.6% | 49,052 | +0.6% | $416 | +33.3% |
| Wisconsin | 9,880 | +1.9% | +9.0% | 176,963 | +0.1% | $414 | +38.0% |
| Wyoming | 1,100 | +0.5% | +6.7% | 19,179 | n/a | $458 | +30.9% |
Source: BLS Quarterly Census of Employment and Wages, NAICS 7225 (restaurants and other eating places, including bars that mainly serve food), private ownership, annual averages. “n/a” means BLS suppressed 2024 job or wage data for confidentiality, so we couldn’t compute a change.
Related data
See dining-out dollars per restaurant by state, service business openings and closings, small businesses raising prices by state, card swipe fees by state and business electricity costs by state. Opening a bar? Check bar closing times by state.
Methods and limits
- Counts are establishments (individual locations) reported to state unemployment insurance programs, so they cover restaurants with employees. Owner-only operations aren’t counted.
- QCEW gives net counts, not openings and closings. Those come from separate Business Employment Dynamics data.
- CPI figures are U.S. city averages, not seasonally adjusted, comparing August to August. BLS doesn’t publish restaurant CPI by state.
- We looked for a free state-level source on commercial rent and didn’t find one we could verify, so rent isn’t included.
Cite this data
Reporters and bloggers may use these numbers and charts. Please credit StartBusinessByState and link to this page.
Source: StartBusinessByState, “Restaurant Openings, Closings and Costs by State (2026 Data),” https://startbusinessbystate.com/restaurant-industry-by-state/ (updated October 7, 2026).
FAQ
Are restaurants closing in 2026?
Some are, but the net number is still rising. BLS counted 627,086 restaurant locations in 2025, up 1.2% from 2024. 11 states had a net decline.
Which states lost the most restaurants?
By percentage, Montana (-4.8%), North Carolina (-3.1%) and Oregon (-1.8%) had the largest net drops from 2024 to 2025.
How much have restaurant prices gone up?
Food away from home rose 3.4% in the year to August 2026 and 39.4% since August 2019, according to BLS.
How much do restaurant workers earn?
The average weekly wage at U.S. restaurants was $535 in 2025. That average includes many part-time workers.
Last updated October 7, 2026 by StartBusinessByState.