FHFA House Price Index through Q2 2026 (states and metros) and July 2026 (U.S.) · Updated by StartBusinessByState
Short answer: The U.S. housing market isn’t falling as a whole, but prices are slipping in a number of markets, mostly in the West, Texas and Florida. Austin is 15.4% below its 2022 high and San Francisco is 13.4% below. For listing agents, stagers, photographers and house flippers, these are the markets where pricing a home right and making it stand out matter most.
Key facts for reporters
- U.S. purchase-only home prices: +2.1% year over year in Q2 2026, +0.3% from Q1 (seasonally adjusted); +2.6% year over year in July 2026 (FHFA).
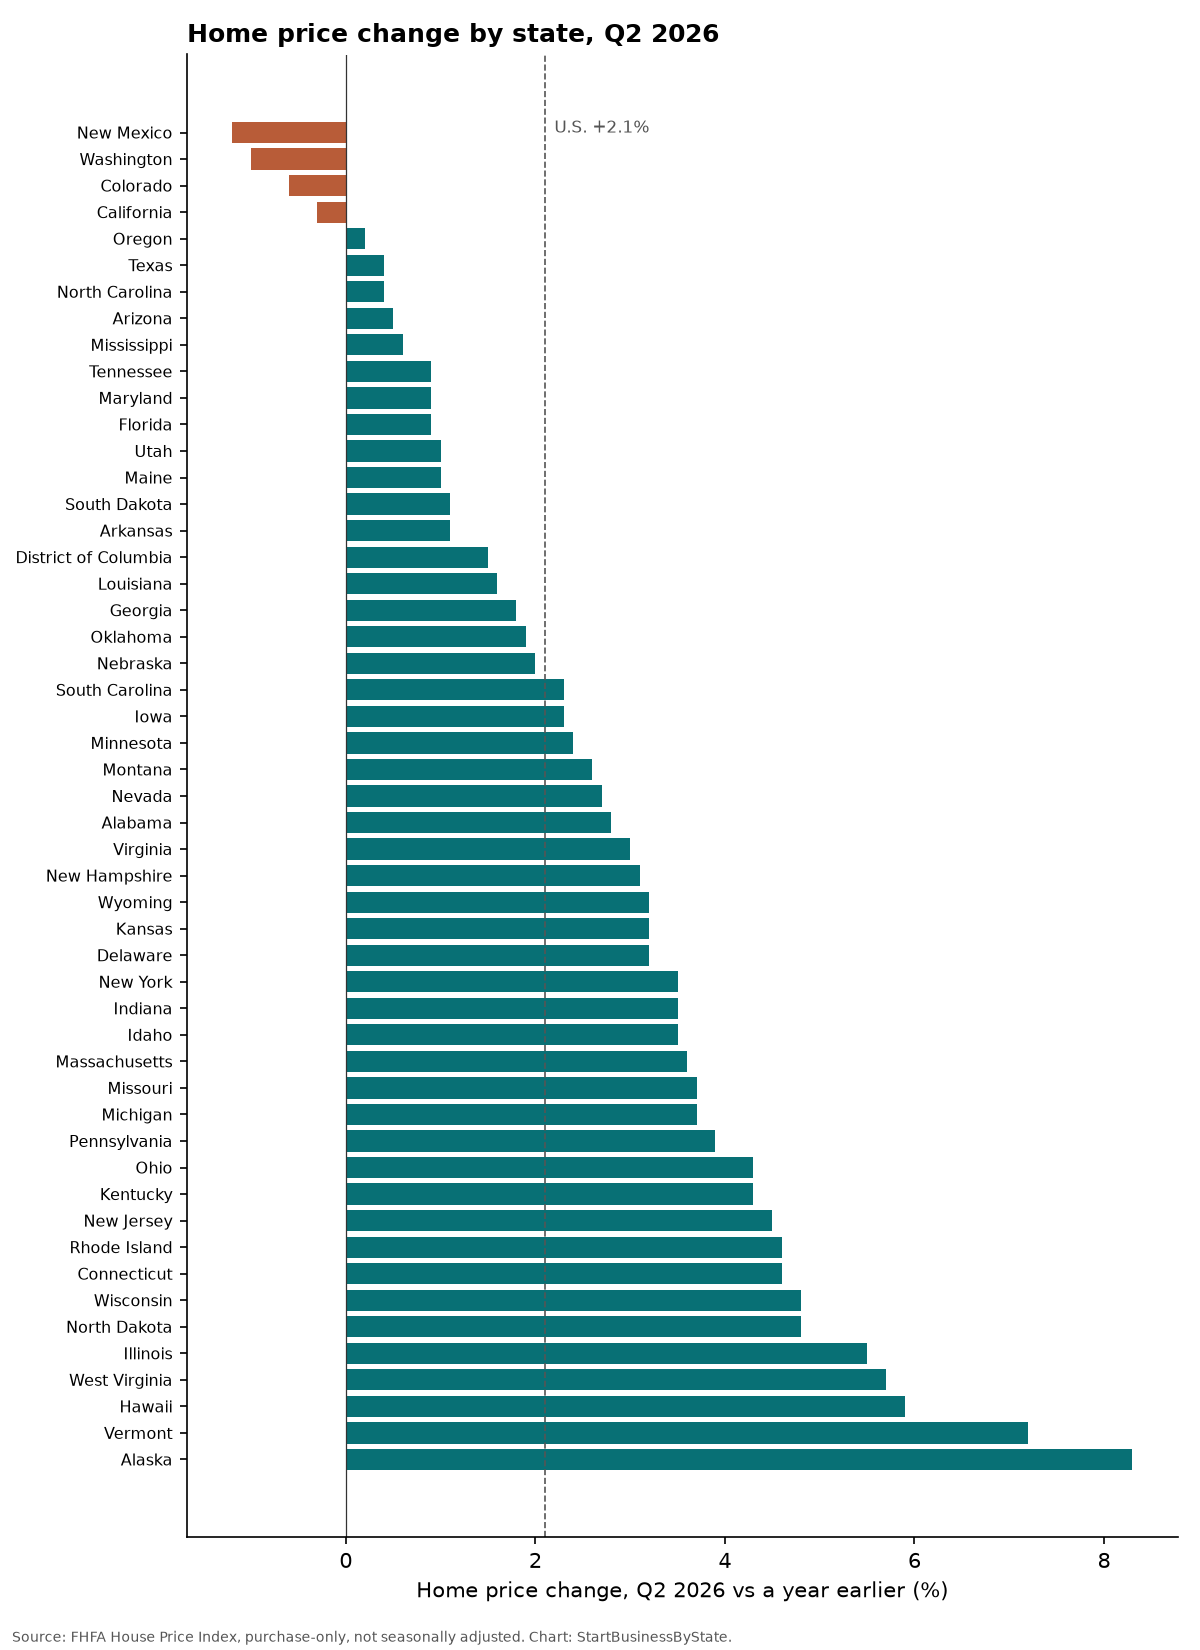
- States where prices fell from a year earlier: California (-0.3%), Colorado (-0.6%), New Mexico (-1.2%), Washington (-1.0%). Fastest gains: Alaska (+8.3%), Vermont (+7.2%), Hawaii (+5.9%), West Virginia (+5.7%).
- 25 of the 100 largest metros had year-over-year declines. Biggest: Everett, WA (division) (-3.9%), San Antonio-New Braunfels, TX (-3.0%), Bakersfield-Delano, CA (-2.5%), Seattle-Bellevue-Kent, WA (division) (-2.5%), Tucson, AZ (-2.4%).
- Furthest below their post-2020 peak: Austin-Round Rock-San Marcos, TX (-15.4%), San Francisco-San Mateo-Redwood City, CA (division) (-13.4%), Cape Coral-Fort Myers, FL (-11.5%), North Port-Bradenton-Sarasota, FL (-7.6%), San Jose-Sunnyvale-Santa Clara, CA (-7.6%).
- 11 states and 38 metros dipped from Q1 to Q2 2026 after seasonal adjustment.
- Prices are up 33.4% nationally over five years. Two big markets are roughly back to where they were five years ago: Austin (+1.1%), Oakland (+1.4%).
Home price change by state
Metros where prices are below their peak
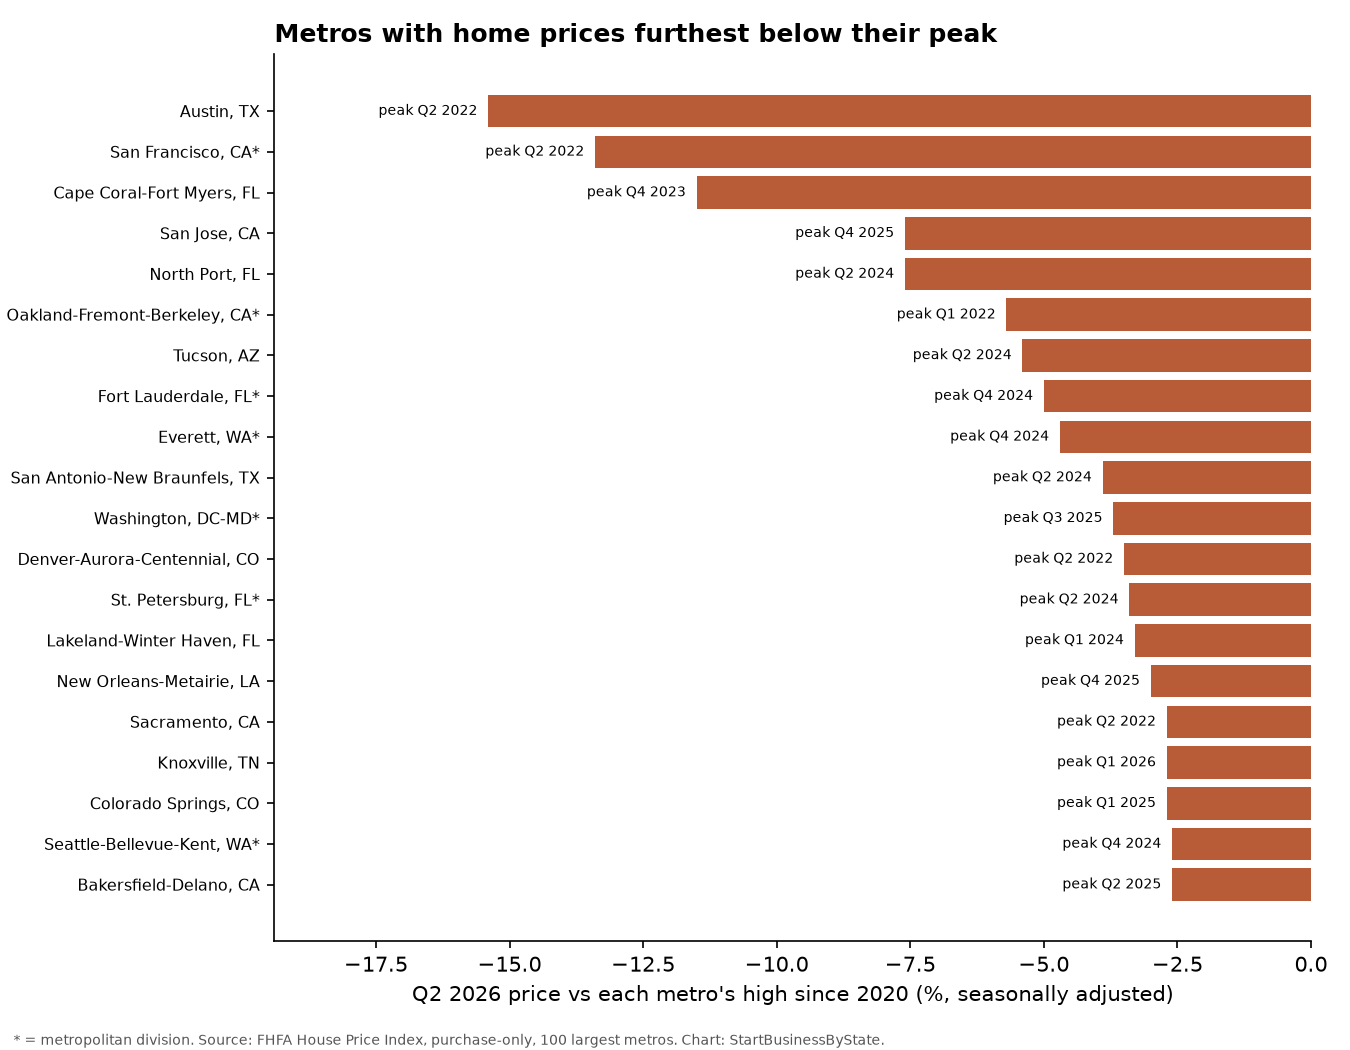
“Below peak” compares Q2 2026 prices with each metro’s highest seasonally adjusted level since 2020. Of the 42 big metros at least 1% below peak, 5 peaked in 2022, the year mortgage rates first jumped: Austin, San Francisco, Oakland, Denver, Sacramento. Most of the rest topped out in 2024 or 2025.
| Metro area (100 largest) | 1-year change | Change vs Q1 (SA) | Below peak | Peak quarter | 5-year change |
|---|---|---|---|---|---|
| Austin-Round Rock-San Marcos, TX | -0.4% | +3.7% | -15.4% | Q2 2022 | +1.1% |
| San Francisco-San Mateo-Redwood City, CA (division) | -2.3% | -9.1% | -13.4% | Q2 2022 | +5.2% |
| Cape Coral-Fort Myers, FL | +0.3% | +1.8% | -11.5% | Q4 2023 | +20.5% |
| North Port-Bradenton-Sarasota, FL | +3.0% | +1.9% | -7.6% | Q2 2024 | +29.9% |
| San Jose-Sunnyvale-Santa Clara, CA | -2.0% | -3.6% | -7.6% | Q4 2025 | +11.3% |
| Oakland-Fremont-Berkeley, CA (division) | +0.5% | +1.1% | -5.7% | Q1 2022 | +1.4% |
| Tucson, AZ | -2.4% | -5.3% | -5.4% | Q2 2024 | +22.5% |
| Fort Lauderdale-Pompano Beach-Sunrise, FL (division) | -0.5% | +0.7% | -5.0% | Q4 2024 | +39.2% |
| Everett, WA (division) | -3.9% | -2.9% | -4.7% | Q4 2024 | +17.9% |
| San Antonio-New Braunfels, TX | -3.0% | +0.5% | -3.9% | Q2 2024 | +17.5% |
| Washington, DC-MD (division) | -1.1% | +1.6% | -3.7% | Q3 2025 | +6.6% |
| Denver-Aurora-Centennial, CO | -1.1% | -0.0% | -3.5% | Q2 2022 | +12.2% |
| St. Petersburg-Clearwater-Largo, FL (division) | +1.0% | +0.2% | -3.4% | Q2 2024 | +33.7% |
| Lakeland-Winter Haven, FL | +2.6% | +0.2% | -3.3% | Q1 2024 | +33.1% |
| New Orleans-Metairie, LA | -0.5% | +1.3% | -3.0% | Q4 2025 | +8.5% |
| Colorado Springs, CO | -0.9% | -0.7% | -2.7% | Q1 2025 | +14.5% |
| Knoxville, TN | +1.6% | -2.7% | -2.7% | Q1 2026 | +49.5% |
| Sacramento-Roseville-Folsom, CA | -0.3% | -0.9% | -2.7% | Q2 2022 | +11.5% |
| Bakersfield-Delano, CA | -2.5% | -1.7% | -2.6% | Q2 2025 | +25.7% |
| Seattle-Bellevue-Kent, WA (division) | -2.5% | -1.3% | -2.6% | Q4 2024 | +13.3% |
| Jacksonville, FL | -0.4% | +0.1% | -2.4% | Q1 2025 | +33.7% |
| Stockton-Lodi, CA | +2.0% | -0.5% | -2.4% | Q4 2024 | +12.9% |
| Oxnard-Thousand Oaks-Ventura, CA | -0.2% | -0.9% | -2.3% | Q4 2025 | +20.0% |
| Dallas-Plano-Irving, TX (division) | -0.1% | -0.2% | -2.2% | Q4 2024 | +25.9% |
| Baton Rouge, LA | +1.8% | -1.9% | -2.0% | Q4 2025 | +20.4% |
| Tulsa, OK | +1.8% | +1.7% | -1.8% | Q4 2025 | +37.3% |
| Albuquerque, NM | -1.7% | -1.3% | -1.7% | Q2 2025 | +33.7% |
| Fresno, CA | +1.3% | -0.7% | -1.7% | Q3 2025 | +26.9% |
| Los Angeles-Long Beach-Glendale, CA (division) | -0.1% | -1.2% | -1.7% | Q4 2025 | +19.4% |
| Provo-Orem-Lehi, UT | +1.2% | -0.6% | -1.6% | Q1 2025 | +23.1% |
| Fort Worth-Arlington-Grapevine, TX (division) | +0.3% | +0.9% | -1.5% | Q1 2025 | +26.0% |
| Little Rock-North Little Rock-Conway, AR | +1.8% | +0.2% | -1.5% | Q4 2025 | +31.7% |
| Pittsburgh, PA | +2.9% | -1.4% | -1.4% | Q1 2026 | +30.5% |
| Houston-Pasadena-The Woodlands, TX | +0.2% | -1.3% | -1.3% | Q1 2026 | +22.4% |
| Raleigh-Cary, NC | +2.3% | +0.2% | -1.2% | Q1 2025 | +36.0% |
| Riverside-San Bernardino-Ontario, CA | -0.8% | -0.7% | -1.2% | Q3 2024 | +24.0% |
| West Palm Beach-Boca Raton-Delray Beach, FL (division) | +3.2% | -1.2% | -1.2% | Q1 2026 | +49.2% |
| Frederick-Gaithersburg-Bethesda, MD (division) | +0.5% | +1.7% | -1.1% | Q1 2025 | +22.0% |
| Memphis, TN-MS-AR | -0.7% | +1.9% | -1.1% | Q4 2025 | +20.6% |
| Portland-Vancouver-Hillsboro, OR-WA | -0.8% | -0.2% | -1.1% | Q1 2025 | +12.8% |
| Orlando-Kissimmee-Sanford, FL | +0.8% | -1.0% | -1.0% | Q1 2026 | +38.7% |
| San Diego-Chula Vista-Carlsbad, CA | +0.2% | +0.4% | -1.0% | Q4 2024 | +26.4% |
| Atlanta-Sandy Springs-Roswell, GA (division) | +1.3% | -0.2% | -0.9% | Q1 2025 | +33.3% |
| El Paso, TX | +6.2% | +2.3% | -0.8% | Q4 2025 | +44.6% |
| Lakewood-New Brunswick, NJ (division) | +2.9% | -0.8% | -0.8% | Q1 2026 | +50.2% |
| Nashville-Davidson–Murfreesboro–Franklin, TN | -0.2% | -0.8% | -0.8% | Q1 2026 | +34.4% |
| Tacoma-Lakewood, WA (division) | +2.0% | +0.5% | -0.8% | Q3 2025 | +19.7% |
| Boise City, ID | +3.9% | -0.5% | -0.5% | Q1 2026 | +14.8% |
| Des Moines-West Des Moines, IA | -0.0% | -0.5% | -0.5% | Q1 2026 | +26.9% |
| Elgin, IL (division) | +7.5% | -0.5% | -0.5% | Q1 2026 | +47.2% |
| Omaha, NE-IA | +2.6% | -0.5% | -0.5% | Q1 2026 | +33.0% |
| Salt Lake City-Murray, UT | +0.2% | -0.5% | -0.5% | Q1 2026 | +22.8% |
| Wilmington, DE-MD-NJ (division) | +2.0% | +0.1% | -0.5% | Q4 2025 | +38.7% |
| Charlotte-Concord-Gastonia, NC-SC | -0.1% | -0.4% | -0.4% | Q1 2026 | +39.7% |
| Las Vegas-Henderson-North Las Vegas, NV | +1.7% | +3.2% | -0.4% | Q4 2024 | +30.3% |
| Columbia, SC | +2.0% | +0.6% | -0.3% | Q4 2025 | +44.6% |
| Miami-Miami Beach-Kendall, FL (division) | -0.3% | +0.7% | -0.3% | Q2 2025 | +57.7% |
| Richmond, VA | +1.8% | -0.3% | -0.3% | Q1 2026 | +37.2% |
| Kansas City, MO-KS | +2.8% | -0.2% | -0.2% | Q1 2026 | +34.9% |
| Marietta, GA (division) | +1.2% | +0.1% | -0.2% | Q4 2024 | +36.3% |
| Arlington-Alexandria-Reston, VA-WV (division) | +3.5% | -0.1% | -0.1% | Q1 2025 | +26.8% |
| Baltimore-Columbia-Towson, MD | +2.0% | -0.1% | -0.1% | Q1 2026 | +25.5% |
| Grand Rapids-Wyoming-Kentwood, MI | +3.1% | -0.1% | -0.1% | Q1 2026 | +41.5% |
| Indianapolis-Carmel-Greenwood, IN | +2.0% | -0.1% | -0.1% | Q1 2026 | +35.2% |
| Albany-Schenectady-Troy, NY | +5.0% | +0.8% | +0.0% | now | +44.6% |
| Allentown-Bethlehem-Easton, PA-NJ | +6.9% | +4.3% | +0.0% | now | +49.8% |
| Anaheim-Santa Ana-Irvine, CA (division) | +2.2% | +1.7% | +0.0% | now | +36.9% |
| Birmingham, AL | +0.8% | +0.2% | +0.0% | now | +32.7% |
| Boston, MA (division) | +4.6% | +1.4% | +0.0% | now | +32.9% |
| Bridgeport-Stamford-Danbury, CT | +6.5% | +0.7% | +0.0% | now | +49.0% |
| Buffalo-Cheektowaga, NY | +3.6% | +0.9% | +0.0% | now | +42.6% |
| Cambridge-Newton-Framingham, MA (division) | +3.4% | +2.2% | +0.0% | now | +32.3% |
| Camden, NJ (division) | +4.9% | +0.7% | +0.0% | now | +53.6% |
| Charleston-North Charleston, SC | +6.4% | +1.4% | +0.0% | now | +48.5% |
| Chicago-Naperville-Schaumburg, IL (division) | +5.8% | +0.5% | +0.0% | now | +41.1% |
| Cincinnati, OH-KY-IN | +3.2% | +1.1% | +0.0% | now | +41.2% |
| Cleveland, OH | +5.1% | +1.1% | +0.0% | now | +41.1% |
| Columbus, OH | +3.6% | +1.0% | +0.0% | now | +38.0% |
| Dayton-Kettering-Beavercreek, OH | +4.2% | +1.6% | +0.0% | now | +42.0% |
| Detroit-Dearborn-Livonia, MI (division) | +4.7% | +0.4% | +0.0% | now | +39.0% |
| Greensboro-High Point, NC | +5.1% | +2.5% | +0.0% | now | +43.0% |
| Greenville-Anderson-Greer, SC | +1.6% | +0.9% | +0.0% | now | +43.2% |
| Hartford-West Hartford-East Hartford, CT | +4.3% | +1.0% | +0.0% | now | +51.8% |
| Louisville/Jefferson County, KY-IN | +2.4% | +0.5% | +0.0% | now | +34.1% |
| Milwaukee-Waukesha, WI | +6.1% | +1.4% | +0.0% | now | +44.2% |
| Minneapolis-St. Paul-Bloomington, MN-WI | +2.2% | +0.5% | +0.0% | now | +20.0% |
| Montgomery County-Bucks County-Chester County, PA (division) | +4.2% | +1.3% | +0.0% | now | +39.1% |
| Nassau County-Suffolk County, NY (division) | +4.4% | +0.1% | +0.0% | now | +40.8% |
| Newark, NJ (division) | +5.4% | +1.9% | +0.0% | now | +45.9% |
| New York-Jersey City-White Plains, NY-NJ (division) | +5.6% | +3.2% | +0.0% | now | +42.7% |
| Oklahoma City, OK | +2.3% | +0.7% | +0.0% | now | +27.6% |
| Philadelphia, PA (division) | +2.8% | +0.6% | +0.0% | now | +27.0% |
| Phoenix-Mesa-Chandler, AZ | +0.7% | +0.1% | +0.0% | now | +26.5% |
| Providence-Warwick, RI-MA | +4.1% | +1.1% | +0.0% | now | +43.0% |
| Rochester, NY | +2.2% | +0.4% | +0.0% | now | +51.8% |
| St. Louis, MO-IL | +4.1% | +0.1% | +0.0% | now | +35.5% |
| Tampa, FL (division) | +2.2% | +0.9% | +0.0% | now | +40.3% |
| Virginia Beach-Chesapeake-Norfolk, VA-NC | +1.8% | +1.7% | +0.0% | now | +38.2% |
| Warren-Troy-Farmington Hills, MI (division) | +3.2% | +1.6% | +0.0% | now | +32.8% |
| Worcester, MA | +2.9% | +1.0% | +0.0% | now | +36.7% |
Metro indexes for a single quarter can be noisy, especially in smaller markets. The 1-year and below-peak columns are more reliable than the quarterly change. “(division)” marks a metropolitan division, the piece of a very large metro that FHFA reports separately.
Home prices by state, Q2 2026
| State | 1-year change (Q2 2026) | 1-year change (prior quarter) | Change vs Q1 (SA) | Below peak | Peak quarter | 2-year change | 5-year change |
|---|---|---|---|---|---|---|---|
| U.S. total | +2.1% | +1.9% | +0.3% | +0.0% | now | +5.2% | +33.4% |
| Alabama | +2.8% | +2.2% | +1.0% | +0.0% | now | +6.4% | +36.1% |
| Alaska | +8.3% | +6.7% | +1.2% | +0.0% | now | +11.9% | +37.0% |
| Arizona | +0.5% | +0.3% | -0.4% | -0.6% | Q4 2025 | +0.3% | +27.3% |
| Arkansas | +1.1% | +3.0% | +0.0% | -0.4% | Q4 2025 | +5.2% | +37.6% |
| California | -0.3% | -0.4% | -0.6% | -1.1% | Q4 2024 | -0.0% | +17.1% |
| Colorado | -0.6% | -2.3% | +0.0% | -2.3% | Q1 2025 | -1.2% | +15.7% |
| Connecticut | +4.6% | +4.9% | +0.9% | +0.0% | now | +12.4% | +49.6% |
| Delaware | +3.2% | +1.9% | +1.9% | -0.6% | Q4 2025 | +5.5% | +36.6% |
| District of Columbia | +1.5% | -1.6% | +0.1% | -5.5% | Q2 2022 | -3.4% | -2.8% |
| Florida | +0.9% | -0.3% | +0.2% | -1.4% | Q4 2024 | -0.5% | +37.5% |
| Georgia | +1.8% | +0.5% | +0.1% | +0.0% | now | +3.2% | +38.9% |
| Hawaii | +5.9% | +2.0% | +4.7% | +0.0% | now | +8.2% | +39.1% |
| Idaho | +3.5% | +3.0% | +0.7% | +0.0% | now | +7.8% | +24.2% |
| Illinois | +5.5% | +7.4% | +0.5% | +0.0% | now | +13.0% | +43.9% |
| Indiana | +3.5% | +4.1% | +0.3% | +0.0% | now | +8.2% | +39.3% |
| Iowa | +2.3% | +3.6% | +0.3% | +0.0% | now | +6.8% | +32.4% |
| Kansas | +3.2% | +3.2% | +0.7% | +0.0% | now | +8.2% | +36.5% |
| Kentucky | +4.3% | +4.7% | +0.8% | +0.0% | now | +8.9% | +39.8% |
| Louisiana | +1.6% | +1.4% | +0.4% | -0.2% | Q4 2025 | +2.7% | +16.5% |
| Maine | +1.0% | +3.1% | -1.3% | -1.3% | Q1 2026 | +6.8% | +47.2% |
| Maryland | +0.9% | +0.9% | -0.0% | +0.0% | now | +4.2% | +25.3% |
| Massachusetts | +3.6% | +2.7% | +1.3% | +0.0% | now | +8.5% | +35.0% |
| Michigan | +3.7% | +3.4% | +0.4% | +0.0% | now | +8.3% | +38.5% |
| Minnesota | +2.4% | +2.9% | +0.2% | +0.0% | now | +6.1% | +24.4% |
| Mississippi | +0.6% | +3.9% | -0.4% | -0.4% | Q1 2026 | +8.0% | +35.5% |
| Missouri | +3.7% | +4.0% | +0.4% | +0.0% | now | +7.4% | +38.3% |
| Montana | +2.6% | -0.2% | +1.8% | +0.0% | now | +5.1% | +40.0% |
| Nebraska | +2.0% | +3.9% | -0.5% | -0.5% | Q1 2026 | +5.2% | +33.6% |
| Nevada | +2.7% | +0.4% | +1.6% | +0.0% | now | +5.1% | +28.5% |
| New Hampshire | +3.1% | +3.5% | +1.1% | +0.0% | now | +9.5% | +46.2% |
| New Jersey | +4.5% | +4.8% | +1.0% | +0.0% | now | +12.3% | +50.5% |
| New Mexico | -1.2% | +2.0% | -1.7% | -1.7% | Q1 2026 | +4.3% | +34.6% |
| New York | +3.5% | +4.9% | +0.8% | +0.0% | now | +11.5% | +44.9% |
| North Carolina | +0.4% | +0.7% | -0.2% | -0.2% | Q1 2026 | +3.5% | +41.5% |
| North Dakota | +4.8% | +6.4% | +1.0% | +0.0% | now | +11.2% | +32.6% |
| Ohio | +4.3% | +3.6% | +0.9% | +0.0% | now | +9.9% | +41.6% |
| Oklahoma | +1.9% | -0.1% | +0.8% | -0.7% | Q4 2025 | +4.3% | +31.8% |
| Oregon | +0.2% | +0.6% | -0.2% | -0.2% | Q1 2026 | +1.5% | +15.7% |
| Pennsylvania | +3.9% | +3.8% | +0.5% | +0.0% | now | +9.0% | +37.2% |
| Rhode Island | +4.6% | +0.0% | +2.4% | +0.0% | now | +10.8% | +45.7% |
| South Carolina | +2.3% | +1.7% | +1.1% | +0.0% | now | +6.2% | +45.0% |
| South Dakota | +1.1% | +3.1% | -0.6% | -0.6% | Q1 2026 | +4.7% | +35.4% |
| Tennessee | +0.9% | +2.2% | -0.3% | -0.3% | Q1 2026 | +3.9% | +38.4% |
| Texas | +0.4% | -1.2% | +0.7% | -0.6% | Q1 2025 | +0.9% | +25.1% |
| Utah | +1.0% | +0.7% | +0.1% | +0.0% | now | +3.7% | +23.9% |
| Vermont | +7.2% | +5.1% | +1.6% | +0.0% | now | +8.0% | +51.8% |
| Virginia | +3.0% | +2.5% | +0.4% | +0.0% | now | +7.1% | +37.1% |
| Washington | -1.0% | -0.3% | -0.6% | -1.7% | Q4 2025 | +1.6% | +19.6% |
| West Virginia | +5.7% | +4.9% | +1.9% | +0.0% | now | +8.6% | +40.5% |
| Wisconsin | +4.8% | +4.8% | +1.1% | +0.0% | now | +11.3% | +46.0% |
| Wyoming | +3.2% | +2.1% | +1.8% | +0.0% | now | +8.1% | +36.3% |
State-by-state takeaways
Alabama: +2.8%
Home prices in Alabama rose 2.8% from Q2 2025 to Q2 2026 (U.S. +2.1%), rank 25 of 51 for growth. From the previous quarter, seasonally adjusted, they moved +1.0%. Prices are at their highest level since 2020. Over five years they are up 36.1%.
Alaska: +8.3%
Home prices in Alaska rose 8.3% from Q2 2025 to Q2 2026 (U.S. +2.1%), rank 1 of 51 for growth. From the previous quarter, seasonally adjusted, they moved +1.2%. Prices are at their highest level since 2020. Over five years they are up 37.0%.
Arizona: +0.5%
Home prices in Arizona rose 0.5% from Q2 2025 to Q2 2026 (U.S. +2.1%), rank 44 of 51 for growth. From the previous quarter, seasonally adjusted, they moved -0.4%. Prices are 0.6% below their Q4 2025 high. Over five years they are up 27.3%.
Arkansas: +1.1%
Home prices in Arkansas rose 1.1% from Q2 2025 to Q2 2026 (U.S. +2.1%), rank 37 of 51 for growth. From the previous quarter, seasonally adjusted, they moved +0.0%. Prices are 0.4% below their Q4 2025 high. Over five years they are up 37.6%.
California: -0.3%
Home prices in California fell 0.3% from Q2 2025 to Q2 2026 (U.S. +2.1%), rank 48 of 51 for growth. From the previous quarter, seasonally adjusted, they moved -0.6%. Prices are 1.1% below their Q4 2024 high. Over five years they are up 17.1%.
Colorado: -0.6%
Home prices in Colorado fell 0.6% from Q2 2025 to Q2 2026 (U.S. +2.1%), rank 49 of 51 for growth. From the previous quarter, seasonally adjusted, they moved +0.0%. Prices are 2.3% below their Q1 2025 high. Over five years they are up 15.7%.
Connecticut: +4.6%
Home prices in Connecticut rose 4.6% from Q2 2025 to Q2 2026 (U.S. +2.1%), rank 9 of 51 for growth. From the previous quarter, seasonally adjusted, they moved +0.9%. Prices are at their highest level since 2020. Over five years they are up 49.6%.
Delaware: +3.2%
Home prices in Delaware rose 3.2% from Q2 2025 to Q2 2026 (U.S. +2.1%), rank 22 of 51 for growth. From the previous quarter, seasonally adjusted, they moved +1.9%. Prices are 0.6% below their Q4 2025 high. Over five years they are up 36.6%.
District of Columbia: +1.5%
Home prices in District of Columbia rose 1.5% from Q2 2025 to Q2 2026 (U.S. +2.1%), rank 35 of 51 for growth. From the previous quarter, seasonally adjusted, they moved +0.1%. Prices are 5.5% below their Q2 2022 high. Over five years they are up -2.8%.
Florida: +0.9%
Home prices in Florida rose 0.9% from Q2 2025 to Q2 2026 (U.S. +2.1%), rank 42 of 51 for growth. From the previous quarter, seasonally adjusted, they moved +0.2%. Prices are 1.4% below their Q4 2024 high. Over five years they are up 37.5%.
Georgia: +1.8%
Home prices in Georgia rose 1.8% from Q2 2025 to Q2 2026 (U.S. +2.1%), rank 33 of 51 for growth. From the previous quarter, seasonally adjusted, they moved +0.1%. Prices are at their highest level since 2020. Over five years they are up 38.9%.
Hawaii: +5.9%
Home prices in Hawaii rose 5.9% from Q2 2025 to Q2 2026 (U.S. +2.1%), rank 3 of 51 for growth. From the previous quarter, seasonally adjusted, they moved +4.7%. Prices are at their highest level since 2020. Over five years they are up 39.1%.
Idaho: +3.5%
Home prices in Idaho rose 3.5% from Q2 2025 to Q2 2026 (U.S. +2.1%), rank 19 of 51 for growth. From the previous quarter, seasonally adjusted, they moved +0.7%. Prices are at their highest level since 2020. Over five years they are up 24.2%.
Illinois: +5.5%
Home prices in Illinois rose 5.5% from Q2 2025 to Q2 2026 (U.S. +2.1%), rank 5 of 51 for growth. From the previous quarter, seasonally adjusted, they moved +0.5%. Prices are at their highest level since 2020. Over five years they are up 43.9%.
Indiana: +3.5%
Home prices in Indiana rose 3.5% from Q2 2025 to Q2 2026 (U.S. +2.1%), rank 18 of 51 for growth. From the previous quarter, seasonally adjusted, they moved +0.3%. Prices are at their highest level since 2020. Over five years they are up 39.3%.
Iowa: +2.3%
Home prices in Iowa rose 2.3% from Q2 2025 to Q2 2026 (U.S. +2.1%), rank 30 of 51 for growth. From the previous quarter, seasonally adjusted, they moved +0.3%. Prices are at their highest level since 2020. Over five years they are up 32.4%.
Kansas: +3.2%
Home prices in Kansas rose 3.2% from Q2 2025 to Q2 2026 (U.S. +2.1%), rank 21 of 51 for growth. From the previous quarter, seasonally adjusted, they moved +0.7%. Prices are at their highest level since 2020. Over five years they are up 36.5%.
Kentucky: +4.3%
Home prices in Kentucky rose 4.3% from Q2 2025 to Q2 2026 (U.S. +2.1%), rank 12 of 51 for growth. From the previous quarter, seasonally adjusted, they moved +0.8%. Prices are at their highest level since 2020. Over five years they are up 39.8%.
Louisiana: +1.6%
Home prices in Louisiana rose 1.6% from Q2 2025 to Q2 2026 (U.S. +2.1%), rank 34 of 51 for growth. From the previous quarter, seasonally adjusted, they moved +0.4%. Prices are 0.2% below their Q4 2025 high. Over five years they are up 16.5%.
Maine: +1.0%
Home prices in Maine rose 1.0% from Q2 2025 to Q2 2026 (U.S. +2.1%), rank 39 of 51 for growth. From the previous quarter, seasonally adjusted, they moved -1.3%. Prices are 1.3% below their Q1 2026 high. Over five years they are up 47.2%.
Maryland: +0.9%
Home prices in Maryland rose 0.9% from Q2 2025 to Q2 2026 (U.S. +2.1%), rank 41 of 51 for growth. From the previous quarter, seasonally adjusted, they moved -0.0%. Prices are at their highest level since 2020. Over five years they are up 25.3%.
Massachusetts: +3.6%
Home prices in Massachusetts rose 3.6% from Q2 2025 to Q2 2026 (U.S. +2.1%), rank 16 of 51 for growth. From the previous quarter, seasonally adjusted, they moved +1.3%. Prices are at their highest level since 2020. Over five years they are up 35.0%.
Michigan: +3.7%
Home prices in Michigan rose 3.7% from Q2 2025 to Q2 2026 (U.S. +2.1%), rank 15 of 51 for growth. From the previous quarter, seasonally adjusted, they moved +0.4%. Prices are at their highest level since 2020. Over five years they are up 38.5%.
Minnesota: +2.4%
Home prices in Minnesota rose 2.4% from Q2 2025 to Q2 2026 (U.S. +2.1%), rank 28 of 51 for growth. From the previous quarter, seasonally adjusted, they moved +0.2%. Prices are at their highest level since 2020. Over five years they are up 24.4%.
Mississippi: +0.6%
Home prices in Mississippi rose 0.6% from Q2 2025 to Q2 2026 (U.S. +2.1%), rank 43 of 51 for growth. From the previous quarter, seasonally adjusted, they moved -0.4%. Prices are 0.4% below their Q1 2026 high. Over five years they are up 35.5%.
Missouri: +3.7%
Home prices in Missouri rose 3.7% from Q2 2025 to Q2 2026 (U.S. +2.1%), rank 14 of 51 for growth. From the previous quarter, seasonally adjusted, they moved +0.4%. Prices are at their highest level since 2020. Over five years they are up 38.3%.
Montana: +2.6%
Home prices in Montana rose 2.6% from Q2 2025 to Q2 2026 (U.S. +2.1%), rank 27 of 51 for growth. From the previous quarter, seasonally adjusted, they moved +1.8%. Prices are at their highest level since 2020. Over five years they are up 40.0%.
Nebraska: +2.0%
Home prices in Nebraska rose 2.0% from Q2 2025 to Q2 2026 (U.S. +2.1%), rank 31 of 51 for growth. From the previous quarter, seasonally adjusted, they moved -0.5%. Prices are 0.5% below their Q1 2026 high. Over five years they are up 33.6%.
Nevada: +2.7%
Home prices in Nevada rose 2.7% from Q2 2025 to Q2 2026 (U.S. +2.1%), rank 26 of 51 for growth. From the previous quarter, seasonally adjusted, they moved +1.6%. Prices are at their highest level since 2020. Over five years they are up 28.5%.
New Hampshire: +3.1%
Home prices in New Hampshire rose 3.1% from Q2 2025 to Q2 2026 (U.S. +2.1%), rank 23 of 51 for growth. From the previous quarter, seasonally adjusted, they moved +1.1%. Prices are at their highest level since 2020. Over five years they are up 46.2%.
New Jersey: +4.5%
Home prices in New Jersey rose 4.5% from Q2 2025 to Q2 2026 (U.S. +2.1%), rank 10 of 51 for growth. From the previous quarter, seasonally adjusted, they moved +1.0%. Prices are at their highest level since 2020. Over five years they are up 50.5%.
New Mexico: -1.2%
Home prices in New Mexico fell 1.2% from Q2 2025 to Q2 2026 (U.S. +2.1%), rank 51 of 51 for growth. From the previous quarter, seasonally adjusted, they moved -1.7%. Prices are 1.7% below their Q1 2026 high. Over five years they are up 34.6%.
New York: +3.5%
Home prices in New York rose 3.5% from Q2 2025 to Q2 2026 (U.S. +2.1%), rank 17 of 51 for growth. From the previous quarter, seasonally adjusted, they moved +0.8%. Prices are at their highest level since 2020. Over five years they are up 44.9%.
North Carolina: +0.4%
Home prices in North Carolina rose 0.4% from Q2 2025 to Q2 2026 (U.S. +2.1%), rank 46 of 51 for growth. From the previous quarter, seasonally adjusted, they moved -0.2%. Prices are 0.2% below their Q1 2026 high. Over five years they are up 41.5%.
North Dakota: +4.8%
Home prices in North Dakota rose 4.8% from Q2 2025 to Q2 2026 (U.S. +2.1%), rank 7 of 51 for growth. From the previous quarter, seasonally adjusted, they moved +1.0%. Prices are at their highest level since 2020. Over five years they are up 32.6%.
Ohio: +4.3%
Home prices in Ohio rose 4.3% from Q2 2025 to Q2 2026 (U.S. +2.1%), rank 11 of 51 for growth. From the previous quarter, seasonally adjusted, they moved +0.9%. Prices are at their highest level since 2020. Over five years they are up 41.6%.
Oklahoma: +1.9%
Home prices in Oklahoma rose 1.9% from Q2 2025 to Q2 2026 (U.S. +2.1%), rank 32 of 51 for growth. From the previous quarter, seasonally adjusted, they moved +0.8%. Prices are 0.7% below their Q4 2025 high. Over five years they are up 31.8%.
Oregon: +0.2%
Home prices in Oregon rose 0.2% from Q2 2025 to Q2 2026 (U.S. +2.1%), rank 47 of 51 for growth. From the previous quarter, seasonally adjusted, they moved -0.2%. Prices are 0.2% below their Q1 2026 high. Over five years they are up 15.7%.
Pennsylvania: +3.9%
Home prices in Pennsylvania rose 3.9% from Q2 2025 to Q2 2026 (U.S. +2.1%), rank 13 of 51 for growth. From the previous quarter, seasonally adjusted, they moved +0.5%. Prices are at their highest level since 2020. Over five years they are up 37.2%.
Rhode Island: +4.6%
Home prices in Rhode Island rose 4.6% from Q2 2025 to Q2 2026 (U.S. +2.1%), rank 8 of 51 for growth. From the previous quarter, seasonally adjusted, they moved +2.4%. Prices are at their highest level since 2020. Over five years they are up 45.7%.
South Carolina: +2.3%
Home prices in South Carolina rose 2.3% from Q2 2025 to Q2 2026 (U.S. +2.1%), rank 29 of 51 for growth. From the previous quarter, seasonally adjusted, they moved +1.1%. Prices are at their highest level since 2020. Over five years they are up 45.0%.
South Dakota: +1.1%
Home prices in South Dakota rose 1.1% from Q2 2025 to Q2 2026 (U.S. +2.1%), rank 36 of 51 for growth. From the previous quarter, seasonally adjusted, they moved -0.6%. Prices are 0.6% below their Q1 2026 high. Over five years they are up 35.4%.
Tennessee: +0.9%
Home prices in Tennessee rose 0.9% from Q2 2025 to Q2 2026 (U.S. +2.1%), rank 40 of 51 for growth. From the previous quarter, seasonally adjusted, they moved -0.3%. Prices are 0.3% below their Q1 2026 high. Over five years they are up 38.4%.
Texas: +0.4%
Home prices in Texas rose 0.4% from Q2 2025 to Q2 2026 (U.S. +2.1%), rank 45 of 51 for growth. From the previous quarter, seasonally adjusted, they moved +0.7%. Prices are 0.6% below their Q1 2025 high. Over five years they are up 25.1%.
Utah: +1.0%
Home prices in Utah rose 1.0% from Q2 2025 to Q2 2026 (U.S. +2.1%), rank 38 of 51 for growth. From the previous quarter, seasonally adjusted, they moved +0.1%. Prices are at their highest level since 2020. Over five years they are up 23.9%.
Vermont: +7.2%
Home prices in Vermont rose 7.2% from Q2 2025 to Q2 2026 (U.S. +2.1%), rank 2 of 51 for growth. From the previous quarter, seasonally adjusted, they moved +1.6%. Prices are at their highest level since 2020. Over five years they are up 51.8%.
Virginia: +3.0%
Home prices in Virginia rose 3.0% from Q2 2025 to Q2 2026 (U.S. +2.1%), rank 24 of 51 for growth. From the previous quarter, seasonally adjusted, they moved +0.4%. Prices are at their highest level since 2020. Over five years they are up 37.1%.
Washington: -1.0%
Home prices in Washington fell 1.0% from Q2 2025 to Q2 2026 (U.S. +2.1%), rank 50 of 51 for growth. From the previous quarter, seasonally adjusted, they moved -0.6%. Prices are 1.7% below their Q4 2025 high. Over five years they are up 19.6%.
West Virginia: +5.7%
Home prices in West Virginia rose 5.7% from Q2 2025 to Q2 2026 (U.S. +2.1%), rank 4 of 51 for growth. From the previous quarter, seasonally adjusted, they moved +1.9%. Prices are at their highest level since 2020. Over five years they are up 40.5%.
Wisconsin: +4.8%
Home prices in Wisconsin rose 4.8% from Q2 2025 to Q2 2026 (U.S. +2.1%), rank 6 of 51 for growth. From the previous quarter, seasonally adjusted, they moved +1.1%. Prices are at their highest level since 2020. Over five years they are up 46.0%.
Wyoming: +3.2%
Home prices in Wyoming rose 3.2% from Q2 2025 to Q2 2026 (U.S. +2.1%), rank 20 of 51 for growth. From the previous quarter, seasonally adjusted, they moved +1.8%. Prices are at their highest level since 2020. Over five years they are up 36.3%.
What moves home prices
Local prices respond to how many homes are for sale compared with how many buyers there are. More listings, new construction, higher mortgage rates and rising insurance or tax bills tend to cool prices. Job and population growth and a short supply of homes push them up. This index measures prices only. It doesn’t show which of these forces is at work in a given market.
What it means for real estate businesses
- Listing agents: in markets below their peak, sellers anchored to 2022 or 2024 prices may need data to price realistically. The metro table gives you a neutral starting point.
- Stagers and photographers: sellers in softer markets have more reason to invest in how a home shows.
- Flippers and investors: resale values in these markets are lower than a year or two ago. Budget for flat or falling prices before you buy.
Related data
See home prices vs. home services jobs, housing permits vs. builder jobs, property taxes by state and flood insurance by state.
Methods and limits
- Source: FHFA House Price Index, purchase-only, traditional series, from FHFA’s official master data file. It tracks repeat sales of the same single-family homes with mortgages bought or guaranteed by Fannie Mae and Freddie Mac.
- Because it uses repeat sales, the index isn’t skewed by a shift toward bigger or smaller homes. It leaves out cash sales, jumbo loans and most government-backed loans.
- 1-year change uses the index not adjusted for seasons, same quarter a year earlier. Quarterly change and below peak use the seasonally adjusted index. Peak is the highest seasonally adjusted value from Q1 2020 on.
- FHFA publishes purchase-only indexes for the 100 largest metro areas. Smaller metros aren’t included here.
- Why not list price cuts? We planned to use Realtor.com price-reduction counts distributed through FRED. FRED labels that series as copyrighted by a third party and asks users to get the owner’s permission for anything beyond personal use, and Realtor.com doesn’t publish a reuse license. So we used FHFA’s public data instead.
Sources
Cite this data
Reporters and bloggers may use these numbers and charts. Please credit StartBusinessByState and link to this page.
Source: StartBusinessByState, “Where Home Prices Are Falling in 2026: States and Metro Areas,” https://startbusinessbystate.com/home-prices-falling-by-state/ (updated October 7, 2026).
FAQ
Are home prices falling in 2026?
Not nationally. FHFA’s purchase-only index was up 2.1% in the year to Q2 2026. Prices fell in 4 states and in 25 of the 100 largest metro areas.
Which states have falling home prices?
In Q2 2026, prices were lower than a year earlier in California (-0.3%), Colorado (-0.6%), New Mexico (-1.2%), Washington (-1.0%).
Which cities have falling home prices?
Among the 100 largest metros, the biggest one-year declines were in Everett, WA (division) (-3.9%), San Antonio-New Braunfels, TX (-3.0%), Bakersfield-Delano, CA (-2.5%), Seattle-Bellevue-Kent, WA (division) (-2.5%).
Which housing markets are furthest below their peak?
Austin-Round Rock-San Marcos, TX is 15.4% below its Q2 2022 high, followed by San Francisco-San Mateo-Redwood City, CA (division) (-13.4%) and Cape Coral-Fort Myers, FL (-11.5%).
How often is this data updated?
FHFA publishes its quarterly state and metro indexes about two months after each quarter ends, and its monthly national index every month. We update this page after each quarterly release.
Last updated October 7, 2026 by StartBusinessByState.