By StartBusinessByStatePublisher: Robert SmithResearch process
Original research · FRED state unemployment ({ST}UR) × BLS QCEW private employment · Primary window 2024→2025 · Panel 2022–2025 · Published September 16, 2026
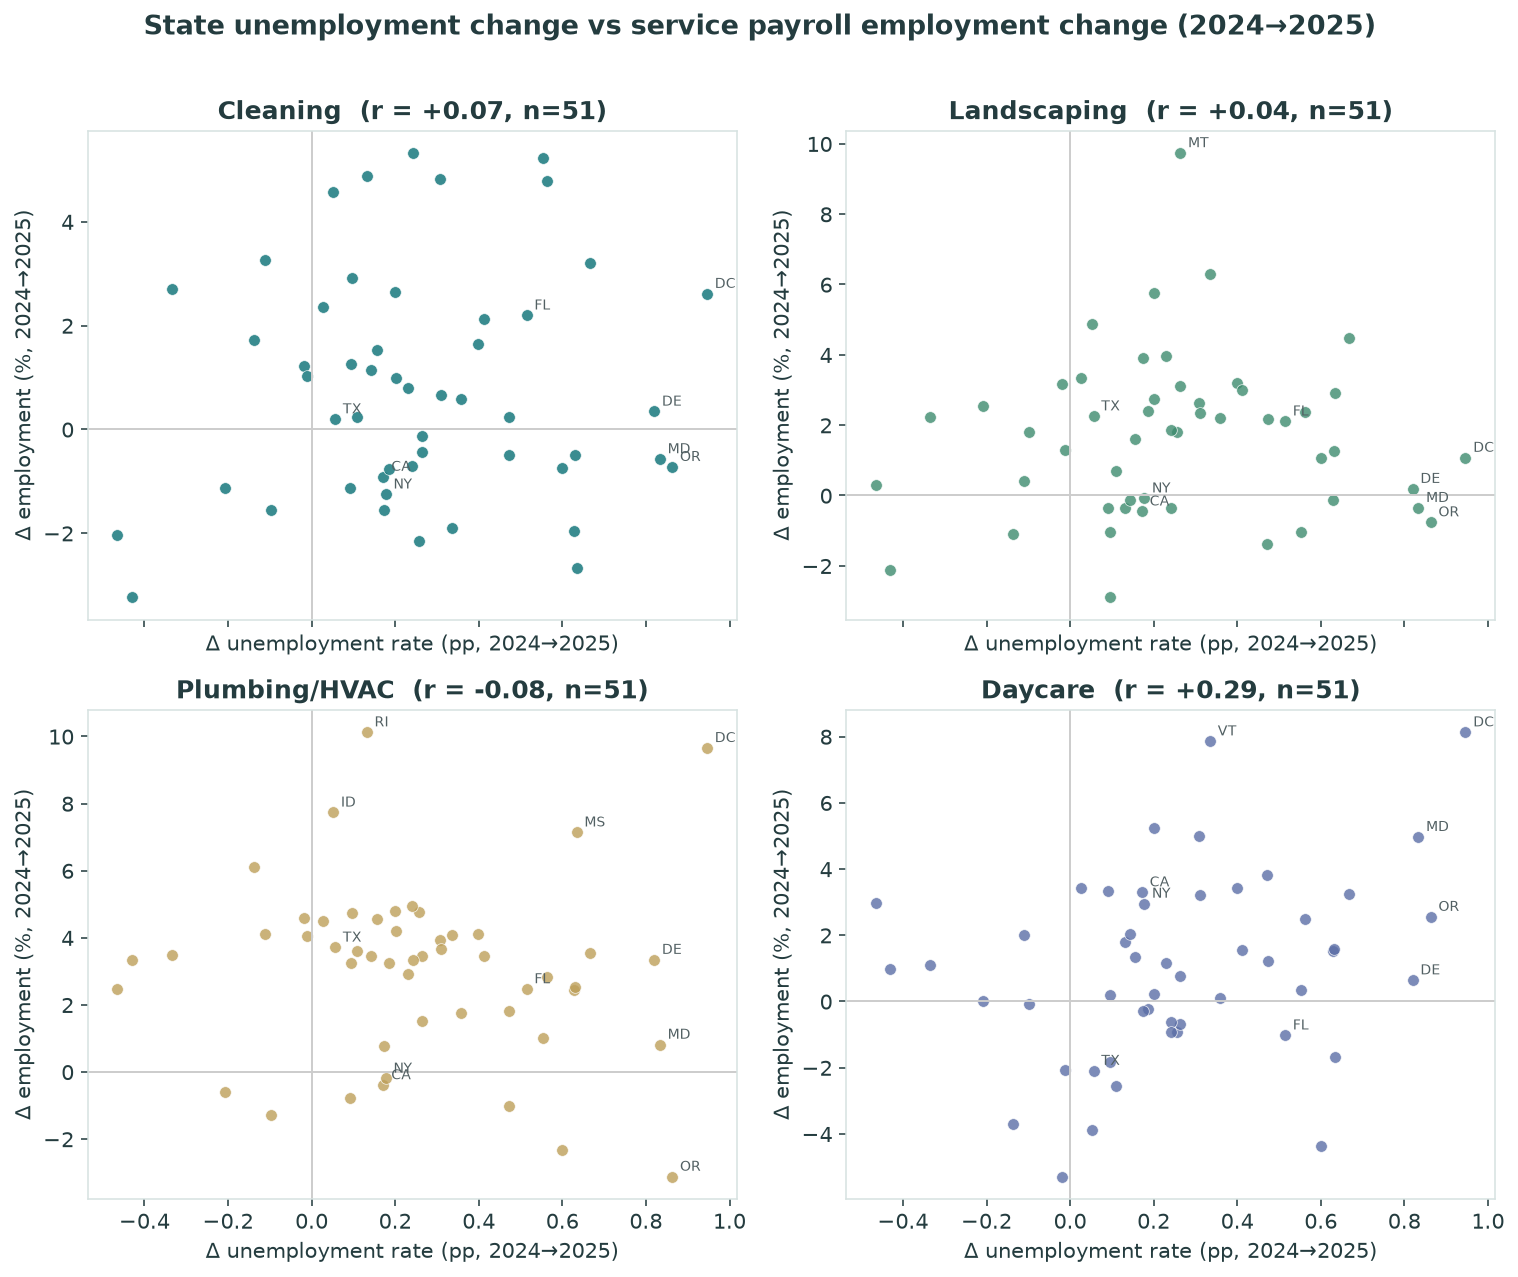
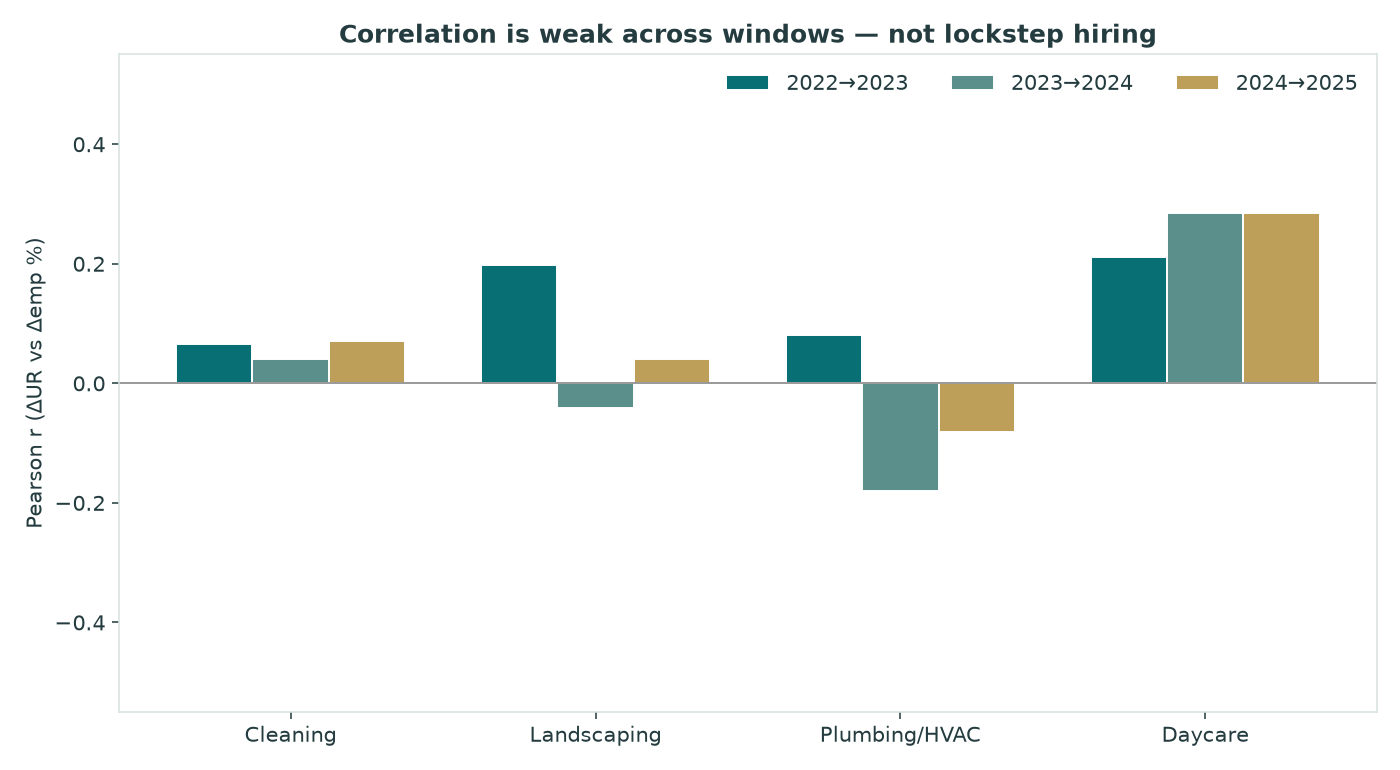
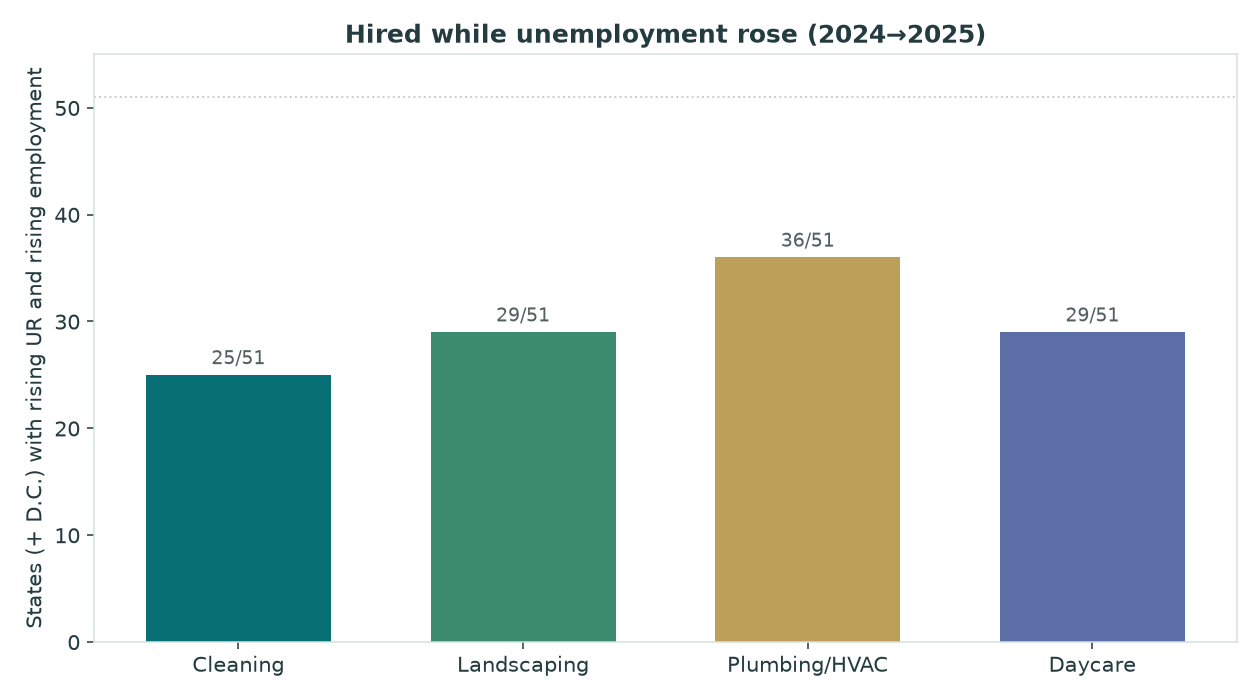
Service payroll hiring is not lockstep with state unemployment. Across cleaning, landscaping, plumbing/HVAC, and daycare, year-over-year changes in state unemployment rates barely track payroll employment changes (pooled Pearson |r| mostly under 0.10). In 2024→2025 alone, 36 of 51 jurisdictions added plumbing/HVAC jobs while unemployment rose — and cleaning, landscaping, and daycare each show dozens of the same “hired through a softer labor market” cases. This is a correlation check, not a claim that unemployment causes (or blocks) hiring, and not a best-state ranking.
Key findings
- Near-zero coupling in the 2022–2025 panel. Pooled correlations of Δ unemployment (pp) vs Δ employment (%): cleaning +0.03, landscaping -0.02, plumbing/HVAC -0.09, daycare -0.08 (n=153 state-years each). None look like tight inverse lockstep.
- 2024→2025 is the same story. Cleaning r=+0.07; landscaping r=+0.04; HVAC r=-0.08; daycare r=+0.29 (a mild positive association — not causation).
- Many states hired while unemployment rose: cleaning 25/51, landscaping 29/51, plumbing/HVAC 36/51, daycare 29/51.
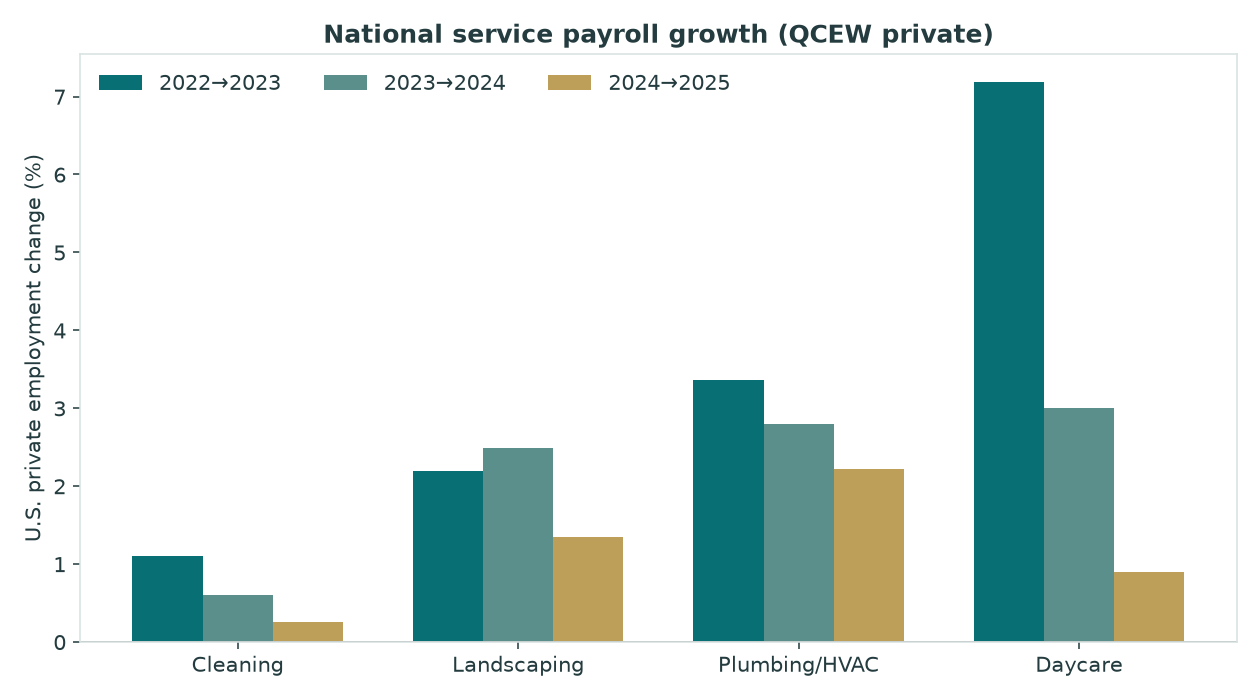
- National payroll still grew in 2024→2025: cleaning +0.3%, landscaping +1.3%, plumbing/HVAC +2.2%, daycare +0.9% (U.S. private QCEW).
- Hypothesis held. Soft labor markets and service hiring often coexist at the state level — distinct from pay levels and from within-year landscaping seasonality.
Expanding an electrical business?
Turn the labor-market comparison into a defined role, pay budget and recruiting process. The electrical-business guide covers those next steps.
Correlations at a glance
| Industry | NAICS | r (2024→2025) | r (pooled) | Hired + rising UR | U.S. Δemp 2024→2025 |
|---|---|---|---|---|---|
| Cleaning | 561720 | +0.07 | +0.03 | 25/51 | +0.3% |
| Landscaping | 561730 | +0.04 | -0.02 | 29/51 | +1.3% |
| Plumbing/HVAC | 23822 | -0.08 | -0.09 | 36/51 | +2.2% |
| Daycare | 624410 | +0.29 | -0.08 | 29/51 | +0.9% |
How to read r: −1 would mean unemployment and payroll move as perfect opposites; 0 means no linear link. Values near zero mean state UR changes are a poor predictor of these industries’ hiring.
Charts
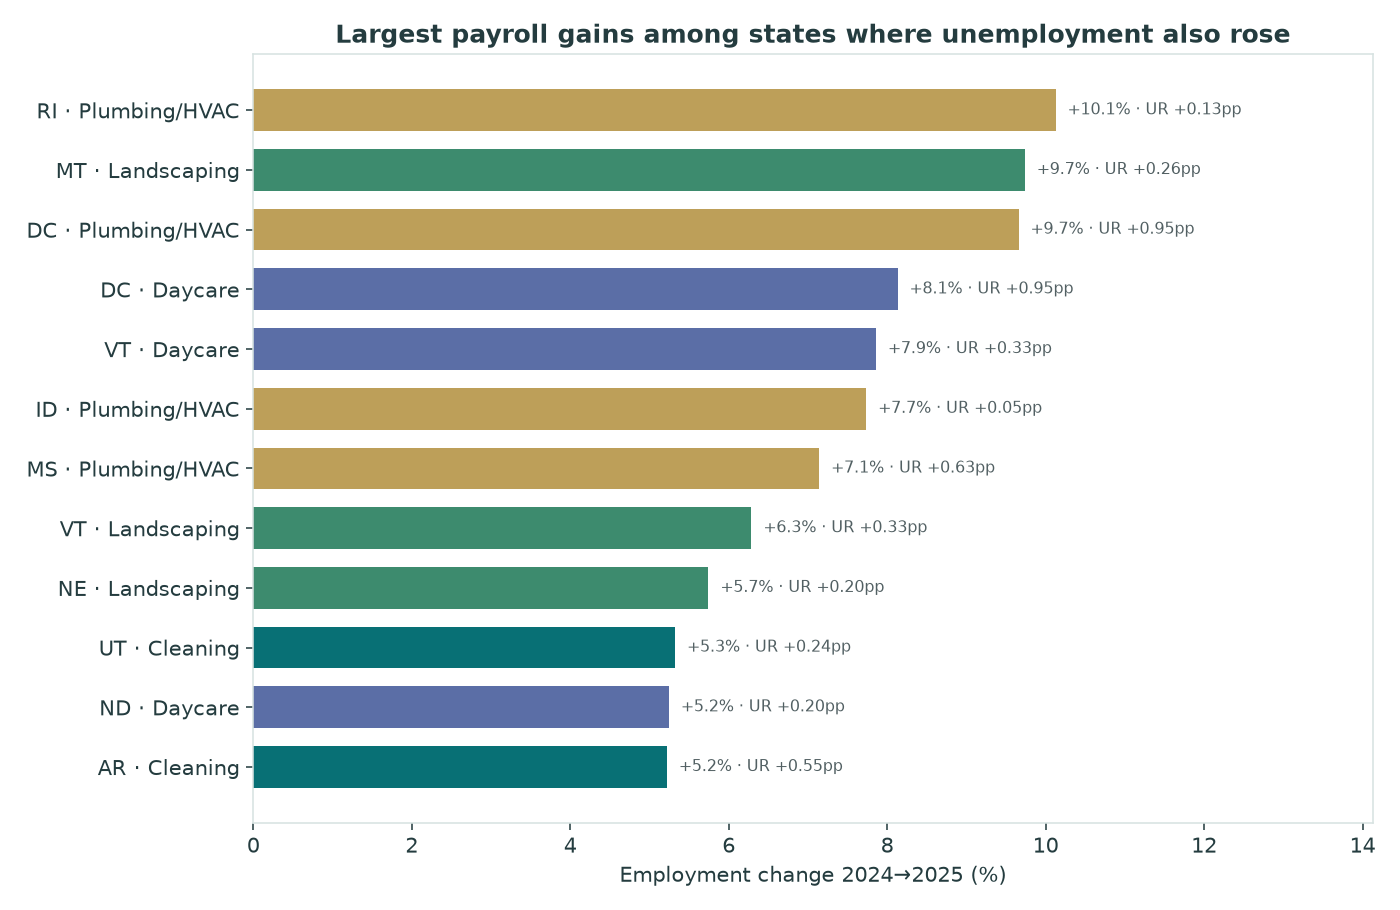
Hired despite rising unemployment
For a service business adding employees, turn the hiring decision into a costed role and coverage plan. Use electrical-business recruiting for the hiring workflow and HVAC insurance to budget coverage for an expanding HVAC crew.
These are descriptive outliers — states where both unemployment and industry payroll employment rose in 2024→2025 — sorted by employment gain. Small bases can produce large percentages.
| State | Industry | Δ emp | Δ UR (pp) | Employment |
|---|---|---|---|---|
| Rhode Island | Plumbing/HVAC | +10.1% | +0.13 | 4,227 → 4,655 |
| Montana | Landscaping | +9.7% | +0.26 | 3,615 → 3,967 |
| District of Columbia | Plumbing/HVAC | +9.7% | +0.95 | 1,636 → 1,794 |
| District of Columbia | Daycare | +8.1% | +0.95 | 3,702 → 4,003 |
| Vermont | Daycare | +7.9% | +0.33 | 2,965 → 3,198 |
| Idaho | Plumbing/HVAC | +7.7% | +0.05 | 9,761 → 10,516 |
| Mississippi | Plumbing/HVAC | +7.1% | +0.63 | 8,038 → 8,612 |
| Vermont | Landscaping | +6.3% | +0.33 | 2,243 → 2,384 |
State table (2024→2025)
Unemployment rates are FRED calendar-year averages of monthly {ST}UR series (2025 uses published months only). Employment changes are QCEW private annual averages.
| State | UR 2024 | UR 2025 | Δ UR (pp) | Δ cleaning % | Δ landscaping % | Δ HVAC % | Δ daycare % |
|---|---|---|---|---|---|---|---|
| District of Columbia | 5.31 | 6.25 | +0.95 | +2.6% | +1.1% | +9.7% | +8.1% |
| Oregon | 4.29 | 5.15 | +0.86 | -0.7% | -0.8% | -3.1% | +2.6% |
| Maryland | 3.17 | 4.00 | +0.83 | -0.6% | -0.4% | +0.8% | +5.0% |
| Delaware | 3.92 | 4.74 | +0.82 | +0.3% | +0.2% | +3.3% | +0.6% |
| Minnesota | 3.13 | 3.80 | +0.67 | +3.2% | +4.5% | +3.6% | +3.3% |
| Mississippi | 3.18 | 3.81 | +0.63 | -2.7% | +2.9% | +7.1% | -1.7% |
| New Jersey | 4.64 | 5.27 | +0.63 | -0.5% | +1.3% | +2.5% | +1.6% |
| Connecticut | 3.31 | 3.94 | +0.63 | -2.0% | -0.1% | +2.5% | +1.5% |
| Arizona | 3.70 | 4.30 | +0.60 | -0.7% | +1.1% | -2.3% | -4.4% |
| New Hampshire | 2.58 | 3.15 | +0.56 | +4.8% | +2.4% | +2.8% | +2.5% |
| Arkansas | 3.49 | 4.05 | +0.55 | +5.2% | -1.0% | +1.0% | +0.4% |
| Florida | 3.36 | 3.87 | +0.51 | +2.2% | +2.1% | +2.5% | -1.0% |
| Pennsylvania | 3.81 | 4.28 | +0.47 | +0.2% | +2.2% | +1.8% | +1.2% |
| Massachusetts | 3.98 | 4.45 | +0.47 | -0.5% | -1.4% | -1.0% | +3.8% |
| Virginia | 2.93 | 3.34 | +0.41 | +2.1% | +3.0% | +3.4% | +1.6% |
| Michigan | 4.68 | 5.08 | +0.40 | +1.6% | +3.2% | +4.1% | +3.4% |
| Iowa | 3.14 | 3.50 | +0.36 | +0.6% | +2.2% | +1.8% | +0.1% |
| Vermont | 2.28 | 2.62 | +0.33 | -1.9% | +6.3% | +4.1% | +7.9% |
| South Carolina | 4.11 | 4.42 | +0.31 | +0.7% | +2.4% | +3.7% | +3.2% |
| Maine | 2.99 | 3.30 | +0.31 | +4.8% | +2.6% | +3.9% | +5.0% |
| Missouri | 3.70 | 3.96 | +0.26 | -0.1% | +3.1% | +1.5% | -0.7% |
| Montana | 3.00 | 3.26 | +0.26 | -0.4% | +9.7% | +3.5% | +0.8% |
| Kansas | 3.52 | 3.77 | +0.26 | -2.2% | +1.8% | +4.8% | -0.9% |
| Utah | 3.27 | 3.51 | +0.24 | +5.3% | -0.4% | +3.3% | -0.9% |
| Ohio | 4.35 | 4.59 | +0.24 | -0.7% | +1.9% | +4.9% | -0.6% |
| South Dakota | 1.82 | 2.05 | +0.23 | +0.8% | +4.0% | +2.9% | +1.1% |
| Nebraska | 2.72 | 2.92 | +0.20 | +1.0% | +5.7% | +4.2% | +0.2% |
| North Dakota | 2.40 | 2.60 | +0.20 | +2.6% | +2.7% | +4.8% | +5.2% |
| North Carolina | 3.64 | 3.83 | +0.19 | -0.8% | +2.4% | +3.2% | -0.2% |
| New York | 4.15 | 4.33 | +0.18 | -1.3% | -0.1% | -0.2% | +3.0% |
| Wyoming | 3.12 | 3.29 | +0.17 | -1.6% | +3.9% | +0.8% | -0.3% |
| California | 5.29 | 5.46 | +0.17 | -0.9% | -0.5% | -0.4% | +3.3% |
| Wisconsin | 3.01 | 3.16 | +0.16 | +1.5% | +1.6% | +4.6% | +1.3% |
| Tennessee | 3.38 | 3.52 | +0.14 | +1.1% | -0.1% | +3.5% | +2.1% |
| Rhode Island | 4.25 | 4.38 | +0.13 | +4.9% | -0.4% | +10.1% | +1.8% |
| Oklahoma | 3.20 | 3.31 | +0.11 | +0.2% | +0.7% | +3.6% | -2.6% |
| West Virginia | 4.05 | 4.15 | +0.10 | +2.9% | -1.0% | +4.7% | +0.2% |
| Alaska | 4.54 | 4.64 | +0.09 | +1.3% | -2.9% | +3.3% | -1.8% |
| Washington | 4.50 | 4.59 | +0.09 | -1.1% | -0.4% | -0.8% | +3.3% |
| Texas | 4.12 | 4.17 | +0.06 | +0.2% | +2.3% | +3.7% | -2.1% |
| Idaho | 3.57 | 3.62 | +0.05 | +4.6% | +4.9% | +7.7% | -3.9% |
| New Mexico | 4.09 | 4.12 | +0.03 | +2.3% | +3.3% | +4.5% | +3.4% |
| Louisiana | 4.27 | 4.26 | -0.01 | +1.0% | +1.3% | +4.0% | -2.1% |
| Georgia | 3.40 | 3.38 | -0.02 | +1.2% | +3.2% | +4.6% | -5.3% |
| Colorado | 4.12 | 4.03 | -0.10 | -1.6% | +1.8% | -1.3% | -0.1% |
| Alabama | 2.98 | 2.87 | -0.11 | +3.3% | +0.4% | +4.1% | +2.0% |
| Nevada | 5.39 | 5.25 | -0.14 | +1.7% | -1.1% | +6.1% | -3.7% |
| Kentucky | 4.82 | 4.61 | -0.21 | -1.1% | +2.5% | -0.6% | +0.0% |
| Indiana | 4.02 | 3.69 | -0.33 | +2.7% | +2.2% | +3.5% | +1.1% |
| Hawaii | 2.77 | 2.34 | -0.43 | -3.2% | -2.1% | +3.3% | +1.0% |
| Illinois | 4.98 | 4.52 | -0.47 | -2.0% | +0.3% | +2.5% | +3.0% |
Related research on this site
Our summer 2026 heat versus earlier plumbing/HVAC employment comparison pairs NOAA cooling-degree days with a pre-summer BLS baseline across 48 states. Its descriptive correlations do not establish causation, hiring flows or technician shortages.
- Service employer pay by state — annual QCEW pay levels and employees per establishment (not YoY hiring vs unemployment).
- Partnership ordinary income by state — IRS SOI Form 1065 ordinary income by state × 3-digit industry (not payroll hiring).
- Wages by state — OEWS occupation wage levels.
- Landscaping seasonal employment by state — within-year quarterly swing for NAICS 561730.
- Home prices vs home-services employment — FRED/FHFA Δ house prices vs landscaping and plumbing/HVAC payroll (another correlation check, not unemployment).
- Industry stats hubs: cleaning, landscaping, HVAC, daycare.
- Business formation statistics and business survival rates by state — startup/exit context, not payroll hiring.
- Personal income vs business formation — BEA SAINC1 income growth vs Census BFS applications (correlation check, not causation).
- Guides: cleaning, landscaping, HVAC, daycare.
- jobless claims by state: first-time unemployment claims in 2026 vs. 2025, updated weekly.
For statewide job openings, hires, and quits rates (JOLTS total nonfarm tightness) — distinct from unemployment×service hiring correlation — see JOLTS labor-market tightness by state.
Your next step: plan electrical-business hiring
Methods and limitations
Data sources and period matching
Unemployment: FRED monthly series {ST}UR for all 50 states + D.C. (51 series). Calendar-year average of published monthly values. For 2025, most states have 11 published months (one month often missing as .); averages use available months only.
Employment: BLS QCEW annual open CSV slices, private ownership, NAICS 561720 (janitorial), 561730 (landscaping), 23822 (plumbing & HVAC contractors — 5-digit rollup after the 2022 split of former 238220), 624410 (child day care). Years 2022–2025 fetched 2026-09-16.
Matching: Same calendar years for UR and employment — no intentional lag. Primary window 2024→2025; robustness windows 2022→2023 and 2023→2024. Suppressions (N) are never treated as zero; this pull had zero state×industry suppressions for these cells.
Limitations
- Correlation ≠ causation. Demographics, migration, weather, housing, and industry mix all affect hiring.
- QCEW is UI-covered payroll only — most nonemployers sit outside this frame.
- Plumbing/HVAC cannot be split to HVAC-only at state grain in current QCEW.
- 2025 FRED averages are slightly incomplete vs a full 12-month year; QCEW annual vintages can revise.
- Not a best-state score, wage study, or seasonal-amplitude study.
Hypothesis
We hypothesized that service hiring is not lockstep with state unemployment. The weak correlations and large “hired while UR rose” counts support that framing.
Download
Download CSV — unemployment vs service hiring by state (2024→2025). Columns include UR levels, ΔUR (pp), and employment levels/% changes for cleaning, landscaping, plumbing/HVAC, and daycare.
Primary sources: FRED; BLS QCEW.
Dataset license and reuse
Reuse terms, version September 27, 2026. You may quote our original findings and summary statistics with credit to StartBusinessByState.com and a link to this page. Keep the source names, data years, units and relevant limitations with quoted figures.
This permission covers our original contributions to this dataset. It does not relicense underlying source data or grant blanket permission to redistribute third-party datasets. Source data retains its provider’s terms, and public-domain material remains public domain. Any additional reuse permissions stated elsewhere on this page still apply. For other reuse of our original material, contact us.