Original research · FRED/FHFA All-Transactions House Price Index ({ST}STHPI) × BLS QCEW private employment · Primary window 2021→2025 cumulative · YoY panel 2021–2025 · Published September 16, 2026
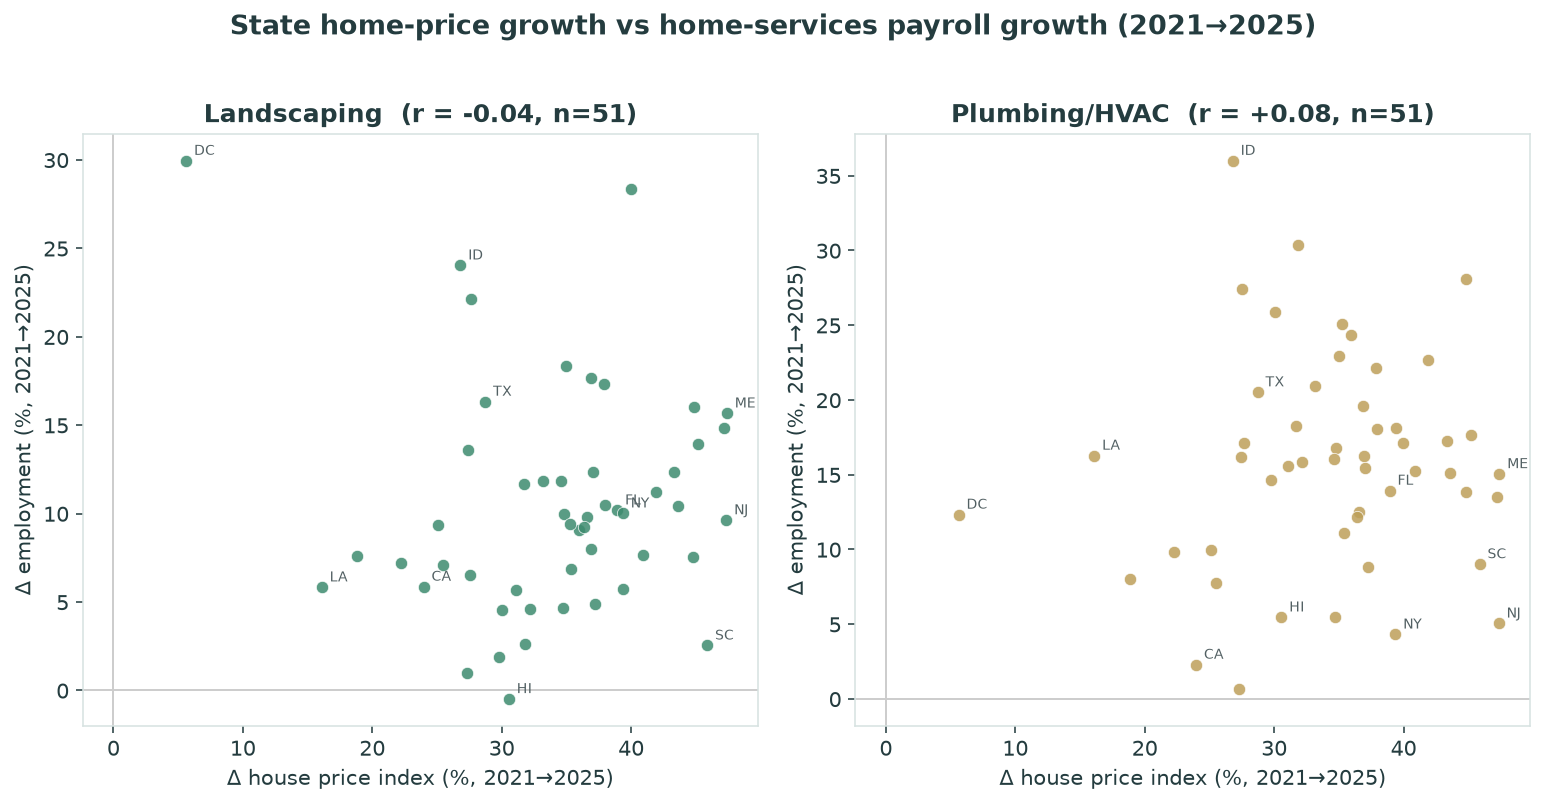
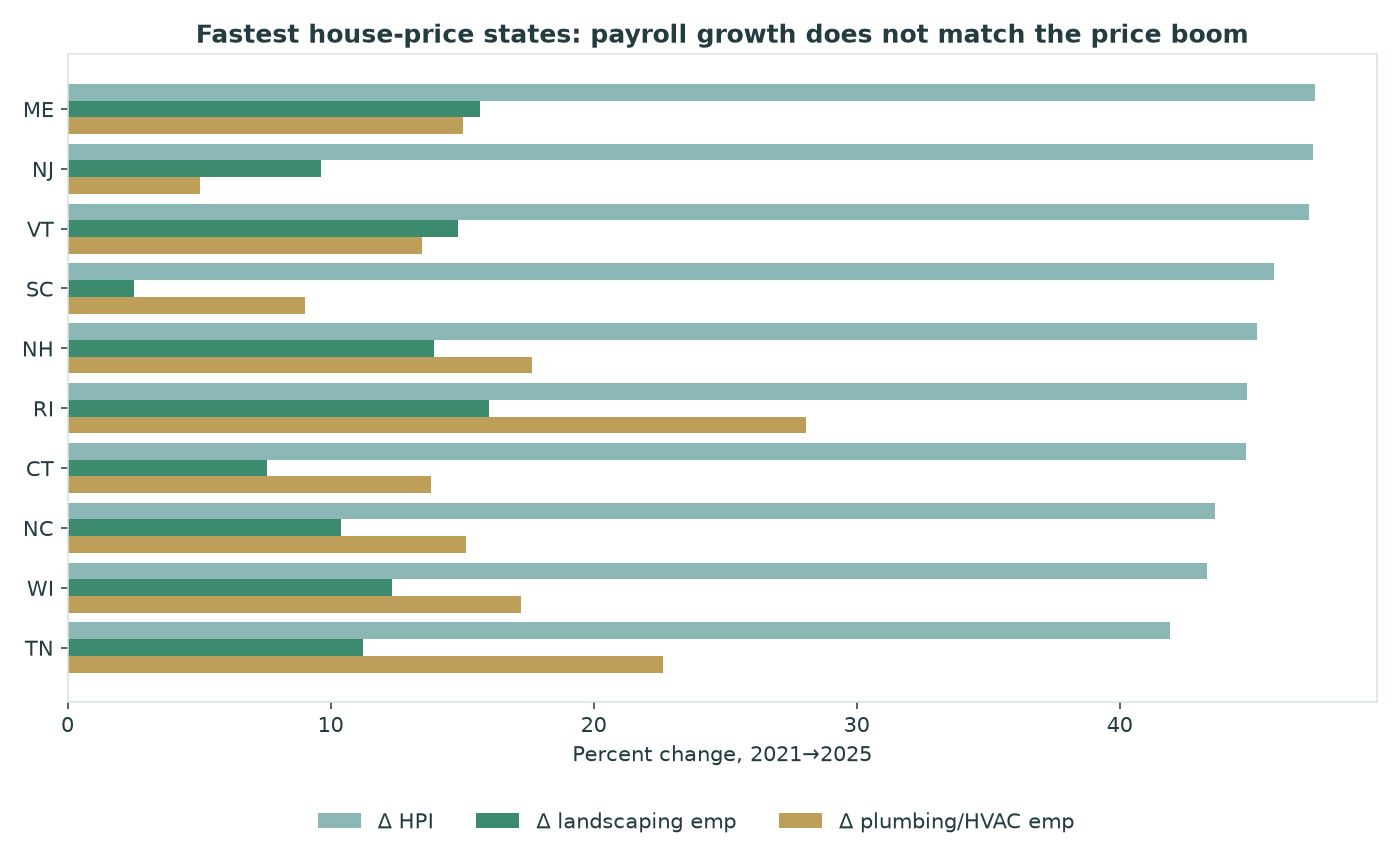
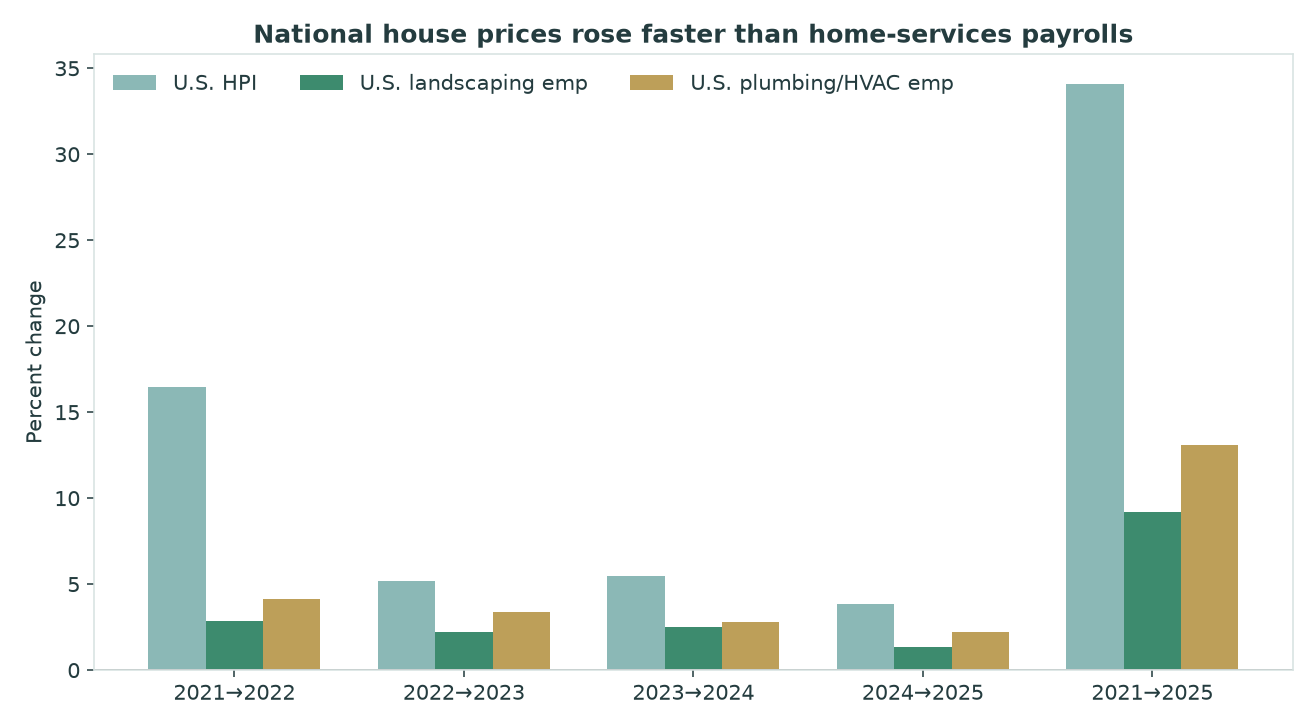
Faster home-price growth is not a reliable signal of faster landscaping or HVAC hiring. From 2021 to 2025, house prices rose in every state and D.C. (U.S. HPI +34.1%) and so did payrolls in landscaping (+9.2%) and plumbing/HVAC (+13.1%). But the ranking of price growth barely tracks the ranking of hiring: Pearson r is -0.04 for landscaping and +0.08 for plumbing/HVAC. This is a correlation check / demand-context story — not a claim that house prices cause lawn or HVAC work, and not a best-state ranking.
Key findings
- Near-zero coupling over 2021–2025. Landscaping Pearson r=-0.04 (Spearman ρ=+0.23); plumbing/HVAC r=+0.08 (ρ=+0.07); n=51. Q4-to-Q4 HPI robustness is the same (r=-0.10 / -0.00).
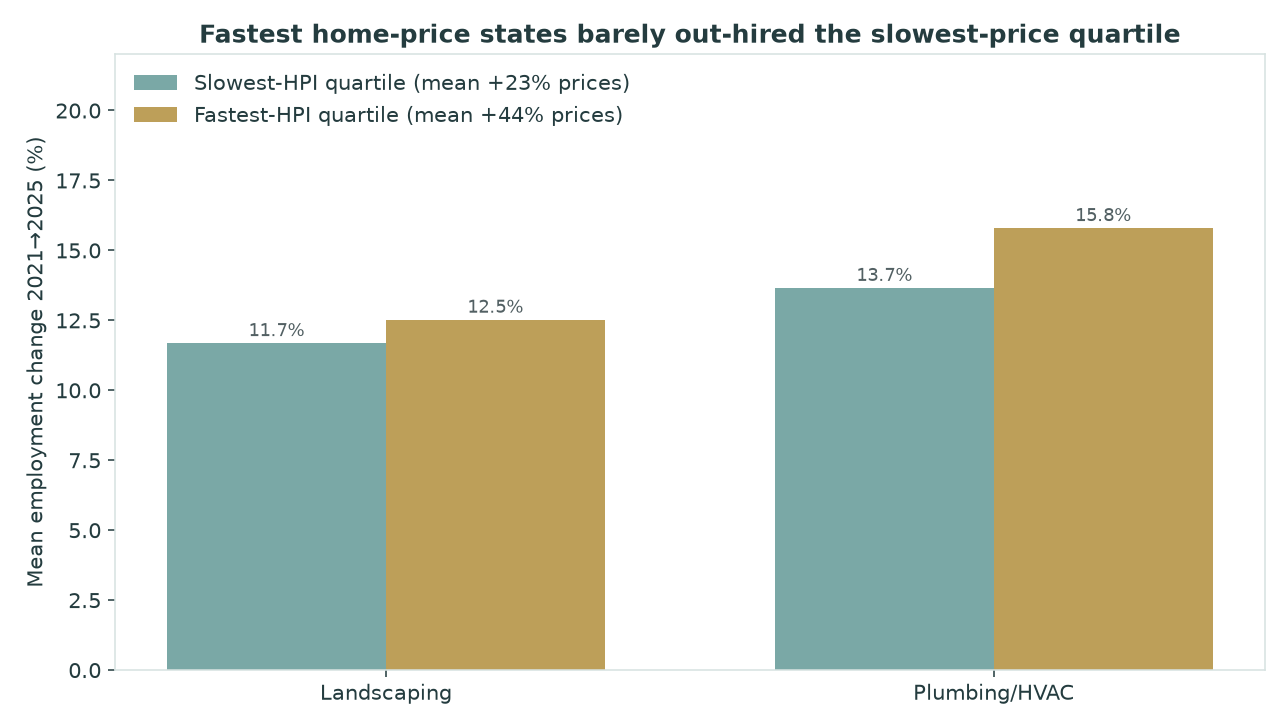
- The fastest-price quartile barely out-hired the slowest. Mean HPI +44% vs +23%, but landscaping employment +12.5% vs +11.7% and HVAC +15.8% vs +13.7%.
- National prices outran payrolls. U.S. HPI +34.1% vs landscaping payroll +9.2% (836,041 → 912,821) and plumbing/HVAC +13.1% (1,163,261 → 1,315,566).
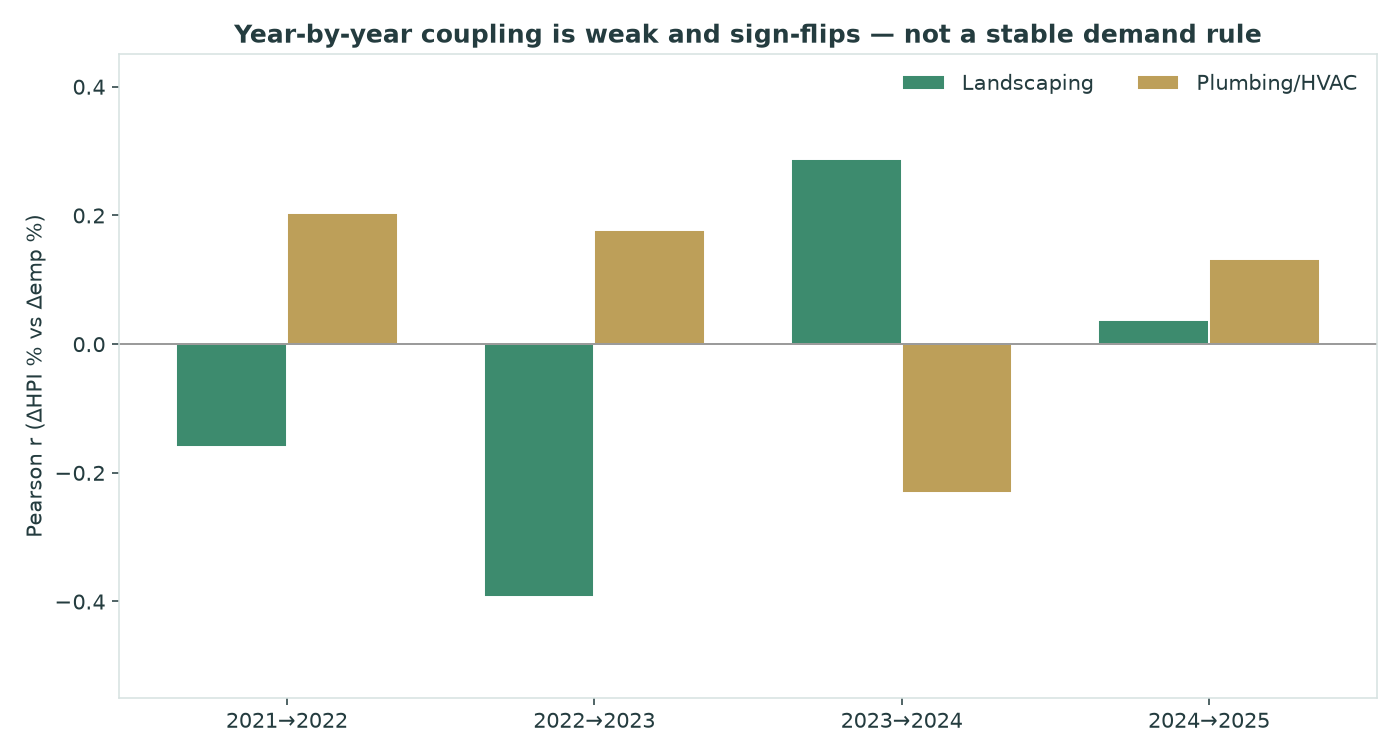
- Year-by-year correlations flip sign — landscaping r=-0.39 in 2022→2023 and r=+0.29 in 2023→2024. Pooled YoY r=+0.01 landscaping / +0.21 HVAC (n=204).
- Small bases can look like demand explosions. D.C. landscaping +30% (217 → 282 jobs) on the slowest HPI (+5.6%). Drop D.C. and landscaping r becomes +0.21; keep only bases ≥5,000 employees and it falls to +0.03. Hawaii is the only HPI-up / landscaping-down case (−0.5%).
Correlations at a glance
| Industry | NAICS | r (2021→2025) | ρ (2021→2025) | r (pooled YoY) | r (2024→2025) | U.S. Δemp 2021→2025 |
|---|---|---|---|---|---|---|
| Landscaping | 561730 | -0.04 | +0.23 | +0.01 | +0.04 | +9.2% |
| Plumbing/HVAC | 23822 | +0.08 | +0.07 | +0.21 | +0.13 | +13.1% |
How to read r: +1 would mean price growth and payroll growth move in lockstep; 0 means no linear link. Values near zero mean a state’s house-price boom is a poor predictor of landscaping or HVAC hiring speed. Spearman ρ is rank-based and less sensitive to D.C.’s tiny landscaping base.
Charts
Quartiles, outliers, and small bases
Almost every jurisdiction is a “both rose” case: landscaping 50/51, plumbing/HVAC 51/51. That is the national backdrop, not evidence that faster prices produced faster hiring. The interesting variation is relative speed — and small payroll bases.
| State | Δ HPI | Δ landscaping | Landscaping jobs | Δ HVAC | HVAC jobs |
|---|---|---|---|---|---|
| Maine | +47.4% | +15.7% | 4,767 → 5,514 | +15.0% | 4,871 → 5,604 |
| New Jersey | +47.4% | +9.6% | 26,376 → 28,916 | +5.1% | 29,564 → 31,058 |
| District of Columbia | +5.6% | +30.0% | 217 → 282 | +12.3% | 1,597 → 1,794 |
| Idaho | +26.8% | +24.0% | 6,119 → 7,590 | +36.0% | 7,732 → 10,516 |
| Hawaii | +30.6% | -0.5% | 4,571 → 4,549 | +5.5% | 4,798 → 5,060 |
| South Carolina | +45.9% | +2.5% | 13,375 → 13,715 | +9.0% | 16,854 → 18,374 |
Idaho’s HVAC payroll +36% (7,732 → 10,516) arrived with mid-pack HPI (+27%). D.C. landscaping’s +30% is 65 extra jobs. Population and construction mix can dwarf a house-price index as a demand proxy — this page does not normalize by population; it flags base size instead.
State table (2021→2025 and 2024→2025)
House prices are FRED/FHFA All-Transactions HPI calendar-year averages of four quarterly observations (index 1980:Q1=100, not seasonally adjusted). Employment changes are QCEW private annual averages. State names link to state hubs — this is cross-industry housing/labor context, not an industry score.
| State | FRED series | Δ HPI 2021–25 | Δ landscaping 2021–25 | Δ HVAC 2021–25 | Δ HPI 2024–25 | Δ landscaping 2024–25 | Δ HVAC 2024–25 |
|---|---|---|---|---|---|---|---|
| Maine | MESTHPI |
+47.4% | +15.7% | +15.0% | +5.8% | +2.6% | +3.9% |
| New Jersey | NJSTHPI |
+47.4% | +9.6% | +5.1% | +6.9% | +1.3% | +2.5% |
| Vermont | VTSTHPI |
+47.2% | +14.8% | +13.5% | +4.5% | +6.3% | +4.1% |
| South Carolina | SCSTHPI |
+45.9% | +2.5% | +9.0% | +4.9% | +2.4% | +3.7% |
| New Hampshire | NHSTHPI |
+45.2% | +13.9% | +17.6% | +5.7% | +2.4% | +2.8% |
| Rhode Island | RISTHPI |
+44.8% | +16.0% | +28.1% | +6.3% | -0.4% | +10.1% |
| Connecticut | CTSTHPI |
+44.8% | +7.6% | +13.8% | +7.2% | -0.1% | +2.5% |
| North Carolina | NCSTHPI |
+43.6% | +10.4% | +15.1% | +3.6% | +2.4% | +3.2% |
| Wisconsin | WISTHPI |
+43.3% | +12.3% | +17.2% | +6.2% | +1.6% | +4.6% |
| Tennessee | TNSTHPI |
+41.9% | +11.2% | +22.6% | +3.6% | -0.1% | +3.5% |
| Georgia | GASTHPI |
+40.9% | +7.6% | +15.2% | +3.3% | +3.2% | +4.6% |
| Montana | MTSTHPI |
+40.0% | +28.4% | +17.1% | +4.0% | +9.7% | +3.5% |
| Ohio | OHSTHPI |
+39.4% | +5.7% | +18.2% | +5.8% | +1.9% | +4.9% |
| New York | NYSTHPI |
+39.4% | +10.0% | +4.3% | +7.0% | -0.1% | -0.2% |
| Florida | FLSTHPI |
+38.9% | +10.2% | +13.9% | +0.7% | +2.1% | +2.5% |
| Indiana | INSTHPI |
+37.9% | +10.5% | +18.1% | +5.2% | +2.2% | +3.5% |
| Arkansas | ARSTHPI |
+37.9% | +17.3% | +22.2% | +4.2% | -1.0% | +1.0% |
| Illinois | ILSTHPI |
+37.2% | +4.9% | +8.8% | +6.6% | +0.3% | +2.5% |
| Missouri | MOSTHPI |
+37.0% | +12.3% | +15.5% | +4.7% | +3.1% | +1.5% |
| Michigan | MISTHPI |
+36.9% | +17.7% | +16.2% | +5.7% | +3.2% | +4.1% |
| Kentucky | KYSTHPI |
+36.9% | +8.0% | +19.6% | +4.9% | +2.5% | -0.6% |
| Delaware | DESTHPI |
+36.6% | +9.8% | +12.5% | +4.7% | +0.2% | +3.3% |
| Virginia | VASTHPI |
+36.4% | +9.2% | +12.1% | +4.7% | +3.0% | +3.4% |
| Kansas | KSSTHPI |
+36.0% | +9.1% | +24.3% | +4.9% | +1.8% | +4.8% |
| Pennsylvania | PASTHPI |
+35.4% | +6.9% | +11.1% | +5.8% | +2.2% | +1.8% |
| New Mexico | NMSTHPI |
+35.3% | +9.4% | +25.1% | +4.0% | +3.3% | +4.5% |
| South Dakota | SDSTHPI |
+35.0% | +18.4% | +22.9% | +3.7% | +4.0% | +2.9% |
| Alabama | ALSTHPI |
+34.8% | +10.0% | +16.8% | +3.8% | +0.4% | +4.1% |
| Massachusetts | MASTHPI |
+34.7% | +4.7% | +5.5% | +4.8% | -1.4% | -1.0% |
| Nebraska | NESTHPI |
+34.6% | +11.8% | +16.0% | +3.9% | +5.7% | +4.2% |
| Oklahoma | OKSTHPI |
+33.2% | +11.8% | +20.9% | +3.6% | +0.7% | +3.6% |
| Wyoming | WYSTHPI |
+32.2% | +4.6% | +15.9% | +5.0% | +3.9% | +0.8% |
| Mississippi | MSSTHPI |
+31.8% | +2.6% | +30.4% | +4.4% | +2.9% | +7.1% |
| West Virginia | WVSTHPI |
+31.7% | +11.7% | +18.2% | +5.5% | -1.0% | +4.7% |
| Iowa | IASTHPI |
+31.1% | +5.7% | +15.6% | +4.0% | +2.2% | +1.8% |
| Hawaii | HISTHPI |
+30.6% | -0.5% | +5.5% | +2.1% | -2.1% | +3.3% |
| Arizona | AZSTHPI |
+30.0% | +4.6% | +25.9% | +1.9% | +1.1% | -2.3% |
| Alaska | AKSTHPI |
+29.8% | +1.9% | +14.6% | +4.6% | -2.9% | +3.3% |
| Texas | TXSTHPI |
+28.7% | +16.3% | +20.5% | +1.8% | +2.3% | +3.7% |
| Utah | UTSTHPI |
+27.6% | +22.1% | +17.1% | +3.2% | -0.4% | +3.3% |
| Nevada | NVSTHPI |
+27.5% | +6.5% | +27.4% | +2.7% | -1.1% | +6.1% |
| North Dakota | NDSTHPI |
+27.4% | +13.6% | +16.2% | +5.4% | +2.7% | +4.8% |
| Maryland | MDSTHPI |
+27.3% | +1.0% | +0.7% | +3.7% | -0.4% | +0.8% |
| Idaho | IDSTHPI |
+26.8% | +24.0% | +36.0% | +3.1% | +4.9% | +7.7% |
| Washington | WASTHPI |
+25.5% | +7.1% | +7.8% | +3.0% | -0.4% | -0.8% |
| Minnesota | MNSTHPI |
+25.1% | +9.4% | +10.0% | +3.6% | +4.5% | +3.6% |
| California | CASTHPI |
+24.0% | +5.9% | +2.3% | +1.9% | -0.5% | -0.4% |
| Colorado | COSTHPI |
+22.2% | +7.2% | +9.8% | +1.3% | +1.8% | -1.3% |
| Oregon | ORSTHPI |
+18.8% | +7.6% | +8.0% | +2.1% | -0.8% | -3.1% |
| Louisiana | LASTHPI |
+16.1% | +5.8% | +16.3% | +3.0% | +1.3% | +4.0% |
| District of Columbia | DCSTHPI |
+5.6% | +30.0% | +12.3% | +1.4% | +1.1% | +9.7% |
Related research on this site
- Landscaping seasonal employment by state — within-year quarterly peak/trough for NAICS 561730, not multi-year HPI.
- Service employer pay by state — annual QCEW pay levels and employees per establishment.
- Unemployment vs service hiring by state — FRED Δ unemployment vs QCEW Δ payroll (a different X variable, same hiring frame).
- Home-services demand by state — ACS 2024 owner-occupied housing stock and young-child households vs landscaping/HVAC jobs per house (stock levels, not HPI growth).
- Industry stats: landscaping, HVAC.
- Guides: start a landscaping business, start an HVAC business.
Methods and limitations
Data sources and period matching
House prices: FRED series {ST}STHPI — FHFA All-Transactions House Price Index for 50 states + D.C. (51 series) plus national USSTHPI. Quarterly, index 1980:Q1=100, not seasonally adjusted. Calendar-year average of four quarterly observations (2021 and 2025 are complete in this pull). Percent change of those annual averages is the primary HPI metric. FRED series metadata in this pull: last_updated 2026-08-25; latest observation 2026-04-01 (2026:Q2, unused).
Employment: BLS QCEW annual open CSV slices, private ownership, NAICS 561730 (landscaping services) and 23822 (plumbing & HVAC contractors — 5-digit rollup after the 2022 split of former 238220). Years 2021–2025 fetched 2026-09-16.
Matching: Same calendar years — no intentional lag. Primary window 2021→2025 cumulative; YoY robustness 2021→2022 through 2024→2025; HPI Q4-to-Q4 as a second price metric. Suppressions (N) are never treated as zero; this pull had zero state×industry suppressions.
Limitations
- Correlation ≠ causation. Migration, population, new construction, weather, insurance, and wage competition all move service payrolls. House prices are not housing starts or homeowner spending.
- Percent changes on small employment bases (D.C. landscaping 217 jobs in 2021) inflate ranks. Dropping D.C. or restricting to bases ≥5,000 is labeled in findings.
- QCEW is UI-covered payroll only — most nonemployers sit outside this frame.
- Plumbing/HVAC cannot be split to HVAC-only at state grain in current QCEW.
- This page does not population-normalize employment; that would be a different study with ACS denominators.
- Not a best-state score, wage study, or seasonal-amplitude study.
Hypothesis
We tested whether faster home-price growth coincides with faster landscaping and HVAC/plumbing hiring. The weak correlations, tiny quartile gaps, and sign-flipping YoY windows do not support that as a useful demand shortcut. Both series rose almost everywhere; relative speed does not line up.
Download
Download CSV — home prices vs home-services employment (2021→2025). Columns include FRED series IDs, annual-average HPI, cumulative and 2024→2025 percent changes, and QCEW employment levels/% changes for landscaping and plumbing/HVAC.
Primary sources: FRED USSTHPI and state {ST}STHPI (FHFA All-Transactions House Price Index); BLS QCEW.