Original research · Census ACS 2024 1-year housing stock & household structure × BLS QCEW 2024 private landscaping (561730) and plumbing/HVAC (23822) · Published September 16, 2026
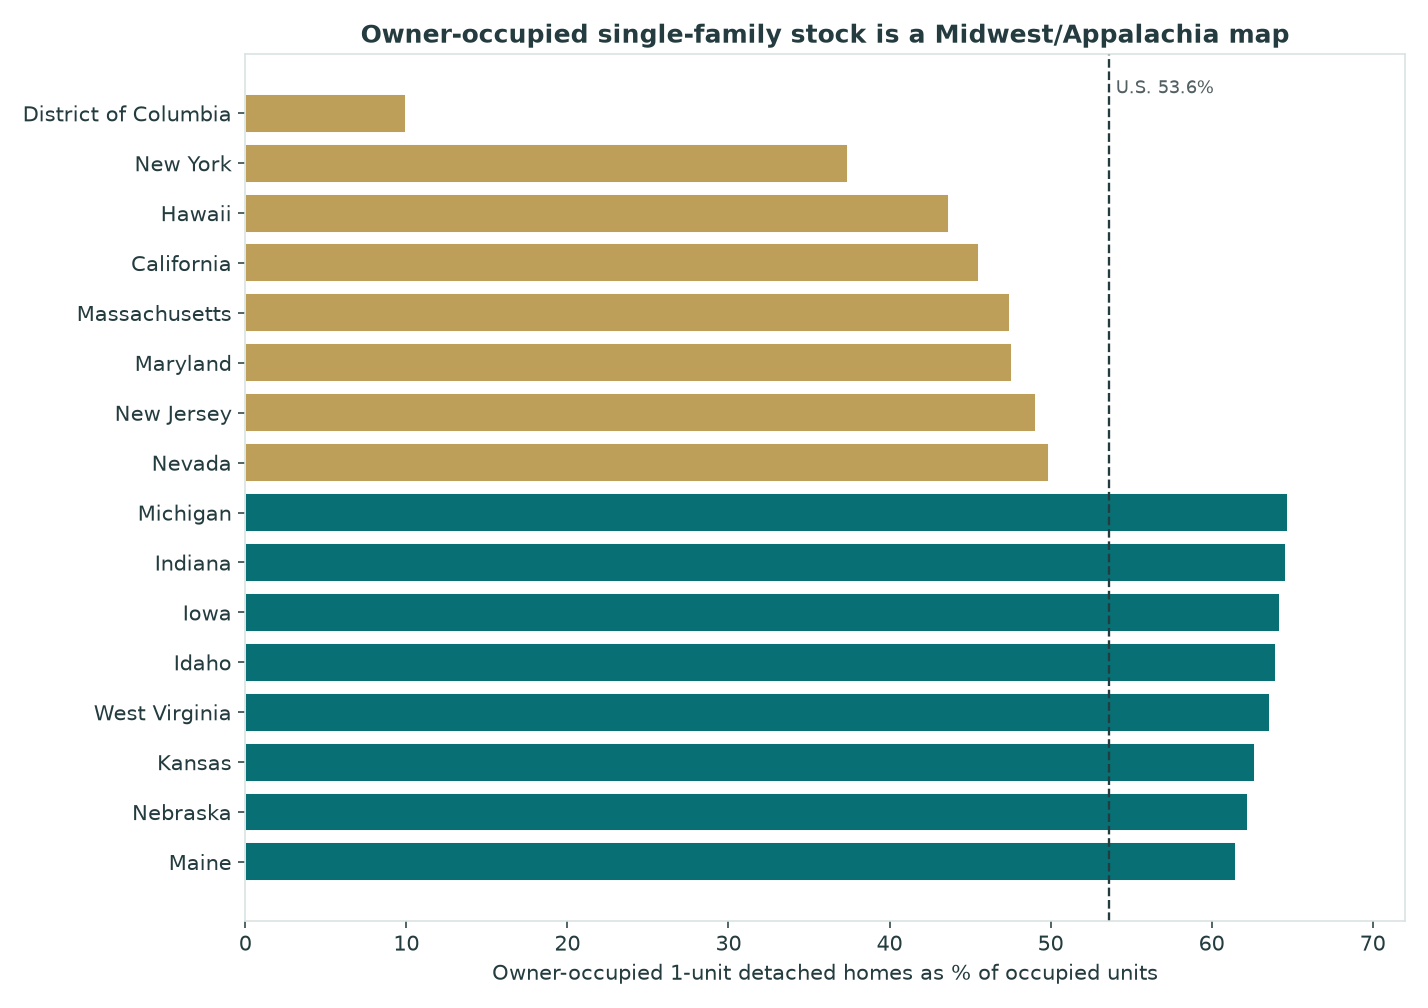
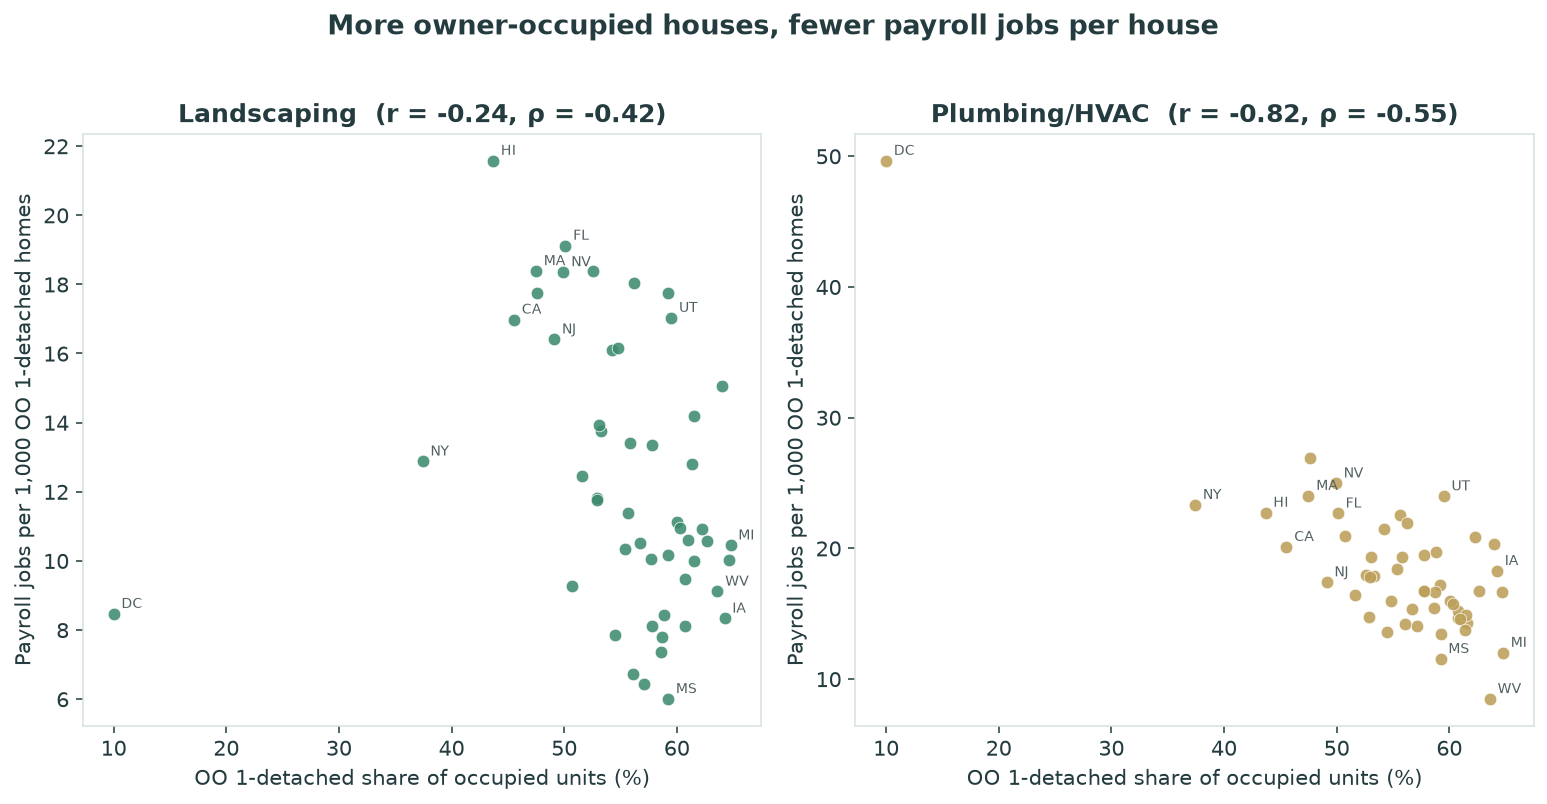
More owner-occupied houses are not a shortcut to more landscaping or HVAC payroll jobs per house. In ACS 2024, 53.6% of U.S. occupied units are owner-occupied 1-unit detached homes (71,212,423). States with the densest stock (Michigan 64.8%) sit below the U.S. landscaping intensity of 12.6 jobs per 1,000 of those houses. Pearson r of stock share vs jobs-per-house is -0.24 for landscaping and -0.82 for plumbing/HVAC (-0.58 without D.C.). Young-child households and working-parent shares are a different map from housing stock — and from kids-per-provider. ACS housing is demand context, not landscaping jobs.
Key findings
- Stock ≠ intensity. OO 1-detached share vs landscaping jobs per 1,000 of those houses: r=-0.24 (ρ=-0.42). Plumbing/HVAC: r=-0.82 (ρ=-0.55); -0.58 without D.C. Highest-stock quartile averages 11.0 landscaping and 15.5 HVAC jobs per 1,000 houses; lowest-stock quartile averages 15.8 and 23.9.
- Midwest/Appalachia lead stock; Sunbelt/coast lead jobs-per-house. Top OO-SFH shares: Michigan 64.8%, Indiana 64.6%, Iowa 64.2%, Idaho 64.0%, West Virginia 63.6%. Top landscaping intensity: Hawaii 21.6, Florida 19.1, Massachusetts 18.4, Rhode Island 18.4, Nevada 18.4 — all below-average stock. Michigan’s landscaping intensity is 10.4 vs U.S. 12.6.
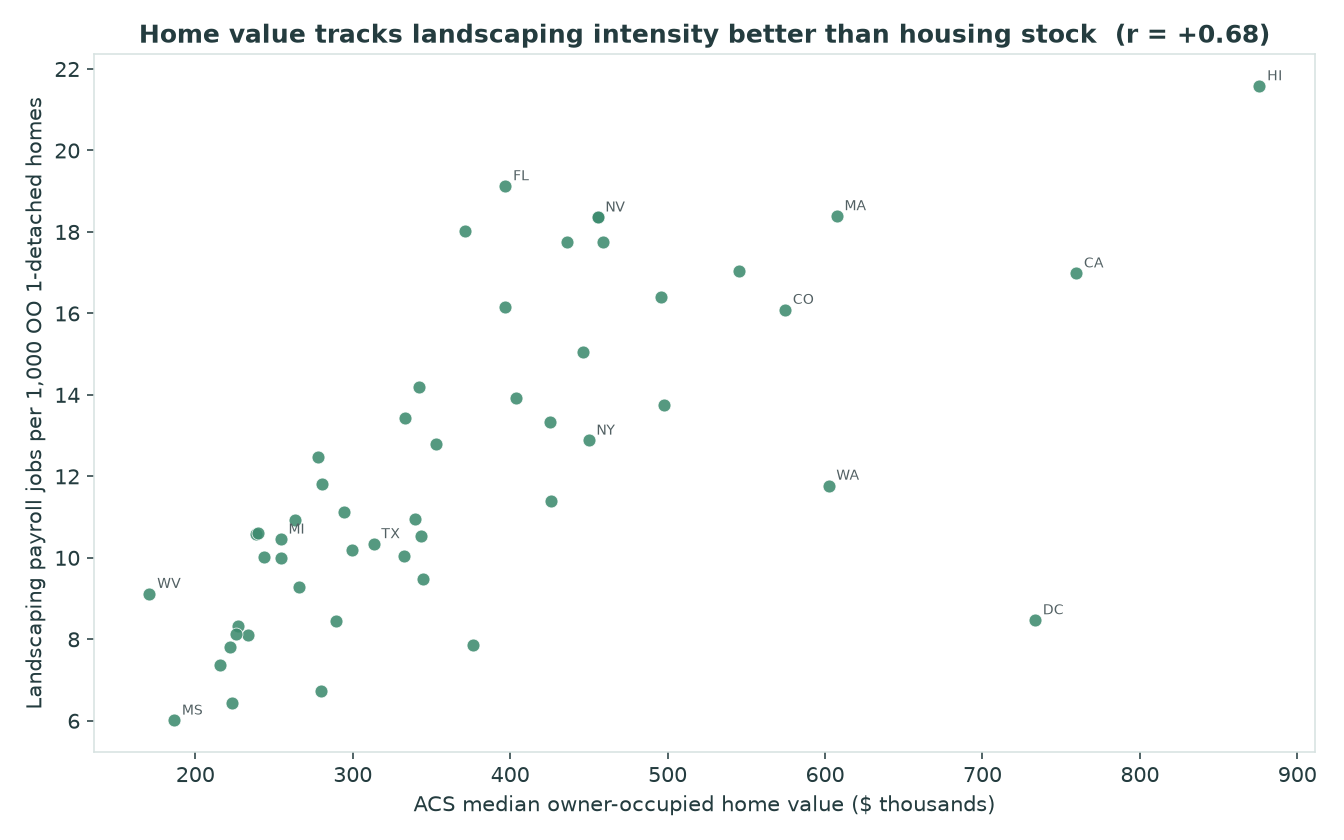
- Median home value tracks landscaping intensity; stock does not. Value vs landscaping jobs/1,000: r=+0.68 (ρ=+0.76). Hawaii ($875,900) and California ($759,500) sit high; West Virginia ($170,800) and Mississippi ($186,500) sit low. Distinct from HPI growth vs hiring growth (near-zero r).
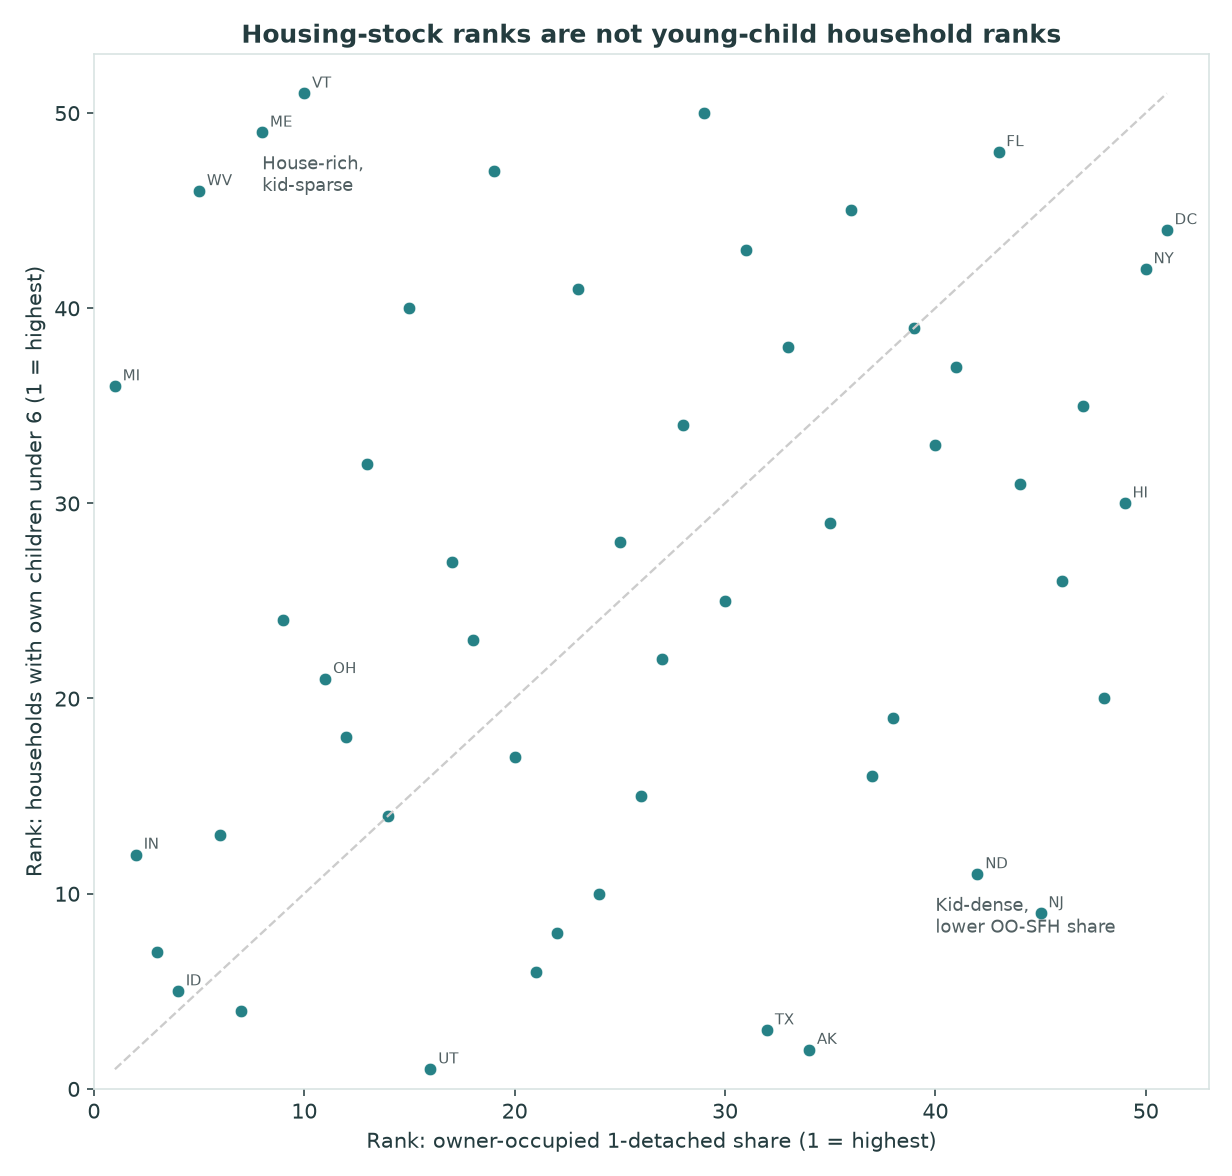
- Young-child households are not the housing-stock map. Households with own children under 6: Utah 14.2% vs Vermont 7.6% (U.S. 10.2%). Maine/Vermont/West Virginia are ~41 ranks higher on housing stock than on young-child households; New Jersey is the reverse (stock rank 45, young-child rank 9). Not the same as kids-per-provider.
- Working-parent share is a third daycare layer. Share of own children under 6 with all resident parent(s) in the labor force: Minnesota 78.9% vs Utah 55.6% (U.S. 69.6%). Utah has the most young-child households and the lowest working-parent share (r with young-child HH share = -0.37).
What the housing stock shows
ACS table B25032 counts occupied units by tenure and structure. The magnet metric is owner-occupied 1-unit detached as a share of all occupied units — a cleaner home-services proxy than “all detached units” (which include rentals) or raw owner-occupied %. U.S.: 71,212,423 OO 1-detached homes out of 132,737,146 occupied units (53.6%). Overall owner-occupied share is 65.3% (DP04 65.3%). Median year built 1981; median owner-occupied value $360,600.
Read the MOEs. ACS 1-year estimates are sample-based. OO-SFH share MOEs in this pull are typically 0.2–1.3 percentage points (Michigan 64.8% ±0.3; D.C. 10.0% ±0.7). Adjacent mid-pack ranks can swap within MOE; D.C. vs Michigan cannot.
| State | OO 1-det. share | Owner % | Land. jobs / 1k OO-SFH | HVAC jobs / 1k | HH w/ kids <6 | Working-parent share (kids <6) | Median value |
|---|---|---|---|---|---|---|---|
| Michigan | 64.8% | 73.5% | 10.45 | 12.01 | 9.5% | 68.6% | $254,200 |
| Hawaii | 43.7% | 61.6% | 21.58 | 22.73 | 10.0% | 65.4% | $875,900 |
| Utah | 59.5% | 69.6% | 17.03 | 23.98 | 14.2% | 55.6% | $545,200 |
| Vermont | 61.4% | 73.2% | 12.80 | 13.74 | 7.6% | 72.4% | $352,800 |
| New Jersey | 49.1% | 63.9% | 16.41 | 17.40 | 11.0% | 75.2% | $496,000 |
| District of Columbia | 10.0% | 40.9% | 8.47 | 49.65 | 9.2% | 71.1% | $733,400 |
| West Virginia | 63.6% | 75.5% | 9.11 | 8.47 | 9.0% | 70.8% | $170,800 |
| Mississippi | 59.2% | 70.5% | 6.00 | 11.53 | 10.3% | 71.2% | $186,500 |
D.C.’s plumbing/HVAC intensity (49.6 per 1,000 OO-SFH) reflects a tiny single-family denominator and a large multifamily/commercial base — not “49 HVAC jobs per house.” Drop D.C. and the HVAC stock-vs-intensity r softens from -0.82 to -0.58, still negative.
Charts
Young-child households and working parents (daycare demand layers)
From ACS B11003, 13,515,035 U.S. family households (10.2% of all households) have own children under 6. From B23008, 69.6% of own children under 6 live with all resident parent(s) in the labor force. That is household structure demand for care — not licensed seats, not tuition, and not kids-per-provider.
- Highest young-child household shares: Utah 14.2%, Alaska 12.5%, Texas 11.9%, Nebraska 11.9%, Idaho 11.9%.
- Lowest: Vermont 7.6%, New Mexico 8.1%, Maine 8.1%, Florida 8.5%, New Hampshire 8.5%.
- Highest working-parent shares: Minnesota 78.9%, Delaware 77.9%, Massachusetts 77.7%, Connecticut 77.4%, Iowa 76.9%.
- Utah pairs the highest young-child household share with the lowest working-parent share (55.6%).
Pair these layers with childcare availability by state (business density) and childcare prices by state (parent prices) — do not treat this page as a redo of either. HUD rents are on Fair Market Rent vs daycare prices.
State table (ACS 2024 × QCEW 2024)
OO 1-detached share = owner-occupied 1-unit detached ÷ occupied units (B25032). Jobs per 1,000 = QCEW private annual employment ÷ OO 1-detached × 1,000. Young-child % = B11003 under-6 family households ÷ all households. Working-parent share = B23008 all-parents-in-labor-force ÷ own children under 6. State names link to state hubs — cross-industry housing/household context, not an industry score.
| State | OO 1-det. share | Owner % | OO 1-det. homes | Land. / 1k | HVAC / 1k | HH kids <6 % | Working-parent % | Median value | Median year built |
|---|---|---|---|---|---|---|---|---|---|
| Michigan | 64.8% | 73.5% | 2,675,492 | 10.45 | 12.01 | 9.5% | 68.6% | $254,200 | 1972 |
| Indiana | 64.6% | 70.7% | 1,794,213 | 10.01 | 16.69 | 10.9% | 68.4% | $243,500 | 1977 |
| Iowa | 64.2% | 71.3% | 862,883 | 8.33 | 18.27 | 11.3% | 76.9% | $227,300 | 1973 |
| Idaho | 64.0% | 71.7% | 480,605 | 15.06 | 20.31 | 11.9% | 57.1% | $446,400 | 1993 |
| West Virginia | 63.6% | 75.5% | 471,164 | 9.11 | 8.47 | 9.0% | 70.8% | $170,800 | 1977 |
| Kansas | 62.7% | 68.1% | 754,798 | 10.58 | 16.76 | 10.9% | 70.3% | $238,700 | 1976 |
| Nebraska | 62.3% | 66.7% | 513,110 | 10.93 | 20.87 | 11.9% | 75.7% | $263,100 | 1976 |
| Maine | 61.5% | 73.3% | 378,580 | 14.19 | 14.24 | 8.1% | 72.9% | $341,900 | 1978 |
| Missouri | 61.5% | 68.6% | 1,576,243 | 9.98 | 14.87 | 10.3% | 69.3% | $254,400 | 1978 |
| Vermont | 61.4% | 73.2% | 175,278 | 12.80 | 13.74 | 7.6% | 72.4% | $352,800 | 1977 |
| Ohio | 61.0% | 68.0% | 3,004,535 | 10.62 | 14.57 | 10.3% | 70.4% | $239,800 | 1971 |
| Minnesota | 60.8% | 71.6% | 1,435,986 | 9.48 | 15.22 | 10.5% | 78.9% | $344,600 | 1979 |
| Alabama | 60.7% | 71.0% | 1,250,940 | 8.10 | 14.67 | 9.7% | 69.0% | $233,300 | 1987 |
| Wyoming | 60.3% | 71.7% | 154,523 | 10.94 | 15.75 | 10.9% | 67.8% | $339,500 | 1982 |
| Wisconsin | 60.0% | 68.0% | 1,521,781 | 11.12 | 15.94 | 9.4% | 74.5% | $294,700 | 1976 |
| Utah | 59.5% | 69.6% | 704,735 | 17.03 | 23.98 | 14.2% | 55.6% | $545,200 | 1994 |
| South Carolina | 59.2% | 72.3% | 1,316,661 | 10.18 | 13.46 | 10.2% | 67.4% | $299,500 | 1993 |
| Mississippi | 59.2% | 70.5% | 696,862 | 6.00 | 11.53 | 10.3% | 71.2% | $186,500 | 1987 |
| New Hampshire | 59.2% | 72.6% | 337,860 | 17.75 | 17.22 | 8.5% | 72.8% | $458,800 | 1980 |
| South Dakota | 58.8% | 68.3% | 224,953 | 8.44 | 19.72 | 10.7% | 76.6% | $289,600 | 1984 |
| Oklahoma | 58.7% | 65.7% | 941,345 | 7.80 | 16.64 | 11.6% | 64.2% | $222,100 | 1982 |
| Arkansas | 58.6% | 67.1% | 730,795 | 7.36 | 15.44 | 11.2% | 66.4% | $215,600 | 1989 |
| Montana | 57.8% | 68.6% | 270,991 | 13.34 | 19.45 | 9.3% | 69.2% | $425,400 | 1983 |
| Kentucky | 57.8% | 68.1% | 1,077,790 | 8.12 | 16.70 | 11.0% | 66.1% | $226,000 | 1983 |
| Tennessee | 57.7% | 66.8% | 1,691,012 | 10.04 | 16.71 | 10.1% | 65.5% | $332,600 | 1988 |
| Louisiana | 57.1% | 68.1% | 1,055,925 | 6.43 | 14.05 | 10.8% | 73.8% | $223,200 | 1983 |
| Georgia | 56.7% | 66.3% | 2,392,932 | 10.52 | 15.36 | 10.3% | 69.4% | $343,300 | 1993 |
| Delaware | 56.2% | 73.8% | 231,861 | 18.03 | 21.92 | 9.7% | 77.9% | $371,600 | 1988 |
| New Mexico | 56.1% | 71.1% | 480,675 | 6.73 | 14.24 | 8.1% | 63.3% | $279,900 | 1985 |
| North Carolina | 55.8% | 66.8% | 2,509,636 | 13.42 | 19.30 | 10.3% | 68.2% | $333,000 | 1993 |
| Arizona | 55.7% | 67.8% | 1,659,808 | 11.38 | 22.53 | 9.3% | 66.2% | $426,000 | 1994 |
| Texas | 55.4% | 62.3% | 6,341,786 | 10.33 | 18.42 | 11.9% | 65.6% | $313,200 | 1994 |
| Connecticut | 54.8% | 66.7% | 797,157 | 16.15 | 15.95 | 9.5% | 77.4% | $396,900 | 1967 |
| Alaska | 54.5% | 66.5% | 149,310 | 7.86 | 13.57 | 12.5% | 63.2% | $376,500 | 1986 |
| Colorado | 54.2% | 65.9% | 1,344,674 | 16.08 | 21.48 | 10.0% | 68.1% | $574,600 | 1989 |
| Oregon | 53.3% | 63.1% | 929,337 | 13.75 | 17.86 | 9.1% | 67.0% | $497,500 | 1982 |
| Virginia | 53.1% | 67.1% | 1,830,496 | 13.93 | 19.33 | 10.8% | 70.5% | $403,500 | 1985 |
| Washington | 52.9% | 62.9% | 1,677,476 | 11.77 | 17.78 | 10.4% | 65.6% | $602,200 | 1987 |
| Illinois | 52.9% | 67.6% | 2,700,285 | 11.81 | 14.78 | 9.5% | 73.5% | $280,700 | 1971 |
| Rhode Island | 52.6% | 63.5% | 235,659 | 18.37 | 17.94 | 9.7% | 73.3% | $455,700 | 1964 |
| Pennsylvania | 51.6% | 69.3% | 2,766,277 | 12.46 | 16.44 | 9.5% | 71.7% | $277,600 | 1966 |
| North Dakota | 50.7% | 61.2% | 177,308 | 9.27 | 20.93 | 11.0% | 72.9% | $266,100 | 1985 |
| Florida | 50.1% | 68.0% | 4,580,094 | 19.12 | 22.67 | 8.5% | 69.7% | $396,900 | 1990 |
| Nevada | 49.9% | 60.1% | 618,612 | 18.35 | 24.97 | 9.8% | 71.2% | $455,500 | 1997 |
| New Jersey | 49.1% | 63.9% | 1,740,383 | 16.41 | 17.40 | 11.0% | 75.2% | $496,000 | 1971 |
| Maryland | 47.6% | 67.8% | 1,143,058 | 17.74 | 26.92 | 10.3% | 76.2% | $436,300 | 1980 |
| Massachusetts | 47.5% | 62.4% | 1,343,953 | 18.39 | 24.02 | 9.5% | 77.7% | $607,400 | 1965 |
| California | 45.5% | 55.8% | 6,284,014 | 16.98 | 20.11 | 10.3% | 68.6% | $759,500 | 1977 |
| Hawaii | 43.7% | 61.6% | 215,426 | 21.58 | 22.73 | 10.0% | 65.4% | $875,900 | 1981 |
| New York | 37.4% | 54.3% | 2,930,193 | 12.88 | 23.32 | 9.3% | 71.9% | $449,800 | 1959 |
| District of Columbia | 10.0% | 40.9% | 32,953 | 8.47 | 49.65 | 9.2% | 71.1% | $733,400 | 1960 |
Related research on this site
- Childcare availability by state — under-5 population per child-care establishment (kids-per-provider), not ACS household structure.
- Childcare prices by state — DOL NDCP parent prices.
- Home prices vs home-services employment — FRED/FHFA HPI growth vs QCEW hiring growth (near-zero coupling).
- Fair Market Rent vs daycare prices — HUD renter housing cost, not ACS owner stock.
- Service wages vs Fair Market Rent — OEWS wages vs HUD 2BR FMR.
- Landscaping seasonal employment by state — within-year QCEW swing.
- Industry stats: landscaping, HVAC, cleaning, daycare.
- Guides: landscaping, HVAC, cleaning, daycare.
Methods and limitations
Data sources and vintage
ACS 2024 1-year via Census API (acs/acs1, profile, subject). Tables: B25032 (tenure × structure), B25003, B25035 (median year built), B25077 (median value), B01003, B11003 (own children under 6), B23008 (parent labor force), B09001, S1101 (household totals; 006/007 are percents of under-18 households, not counts), DP04/DP02. Chosen over the 5-year for currency at state grain. 2025 ACS 1-year is delayed (Census Aug 2026 advisory; Commerce disclosure-avoidance order) and was not in the API on 2026-09-16.
QCEW 2024 annual private employment for NAICS 561730 (landscaping) and 23822 (plumbing & HVAC rollup). Same calendar year as ACS — no lag. Zero state×industry suppressions in this pull. Jobs per 1,000 OO-SFH is a density proxy; those payroll jobs are not assigned to those houses.
Margins of error
ACS estimates have published MOEs. Derived percentage MOEs use the Census ACS Compass (ch. 8) ratio approximation. Treat mid-pack ranks as fuzzy; extremes are stable. CSV includes MOE columns where archived.
Limitations
- ACS housing is not landscaping jobs. Do not read OO-SFH counts as TAM revenue.
- QCEW is UI-covered payroll only — most nonemployers sit outside.
- Plumbing/HVAC
23822includes rentals, multifamily, and commercial work; D.C. illustrates the denominator trap. - Correlation ≠ causation. Climate, wages, HOAs, and commercial mix matter.
- Not HUD FMR, not FRED HPI growth, not kids-per-provider, not a best-state ranking.
Hypothesis
We tested whether denser owner-occupied single-family stock coincides with denser landscaping/HVAC payroll per house, and whether young-child households rank like that stock. The negative stock-vs-intensity correlations, quartile reversal, value-vs-intensity contrast, and large housing-vs-kids rank gaps support treating stock as context — not a demand shortcut — and treating young-child/working-parent layers as distinct from kids-per-provider.
Download
Download CSV — home-services demand by state (ACS 2024 × QCEW 2024). Includes shares, MOEs where archived, ranks, young-child and working-parent metrics, and jobs per 1,000 OO-SFH.
Primary sources: U.S. Census Bureau, American Community Survey; BLS Quarterly Census of Employment and Wages.