Original research · BLS QCEW + Census Nonemployer Statistics + BLS OEWS + EIA diesel prices · Last updated October 6, 2026
Data through: diesel prices for the week of September 28, 2026; trucking jobs for March 2026 (QCEW 2026 Q1); driver wages May 2025; owner-operator counts 2023 (latest Census release).
Truckers are paying $2.63 more per gallon of diesel than a year ago, and freight rates haven’t kept up. U.S. diesel averaged $6.38 the week of September 28, 2026. The producer price index for diesel is up 78% from a year earlier, while long-distance truckload rates are up 14%. Employer trucking companies had 1,426,011 jobs in March 2026, 39,445 fewer than a year before. Another 879,215 trucking businesses have no employees, most of them owner-operators.
Key findings
- A long-haul truck now spends about $40,431 more a year on diesel. 15,385 gallons (100,000 miles at 6.5 mpg) × the $2.63 rise in the U.S. average price (week of Sep 28, 2026 vs. Sep 29, 2025). Modeled
- Trucking payrolls fell 2.7% in a year. 1,426,011 private truck transportation jobs in March 2026, down 39,445. Jobs fell in 44 states and DC (BLS QCEW, NAICS 484).
- North Dakota (-8.9%), Minnesota (-6.4%) and Arkansas (-5.9%) lost the largest shares of trucking jobs among states with at least 1,000 trucking jobs. Only 6 states added jobs. The biggest gain was in Delaware (+2.4%).
- Diesel is up 78%, freight rates 14%. BLS PPI No. 2 diesel (WPU057303) vs. long-distance truckload trucking (PCU484121484121), August 2026 vs. a year earlier. Since January 2021, diesel’s index has risen to 234 and truckload rates to 142.
- 879,215 trucking businesses have no employees. They took in $100.4 billion in 2023, about $114,222 each on average (Census Nonemployer Statistics). Texas has the most (129,002), then California and Florida.
- 2,062,040 heavy and tractor-trailer truck drivers earned a median $58,640 a year in May 2025 (BLS OEWS, occupation 53-3032). The extra diesel for one long-haul truck is about 69% of that median pay. Modeled comparison
Diesel costs vs. what trucking pays
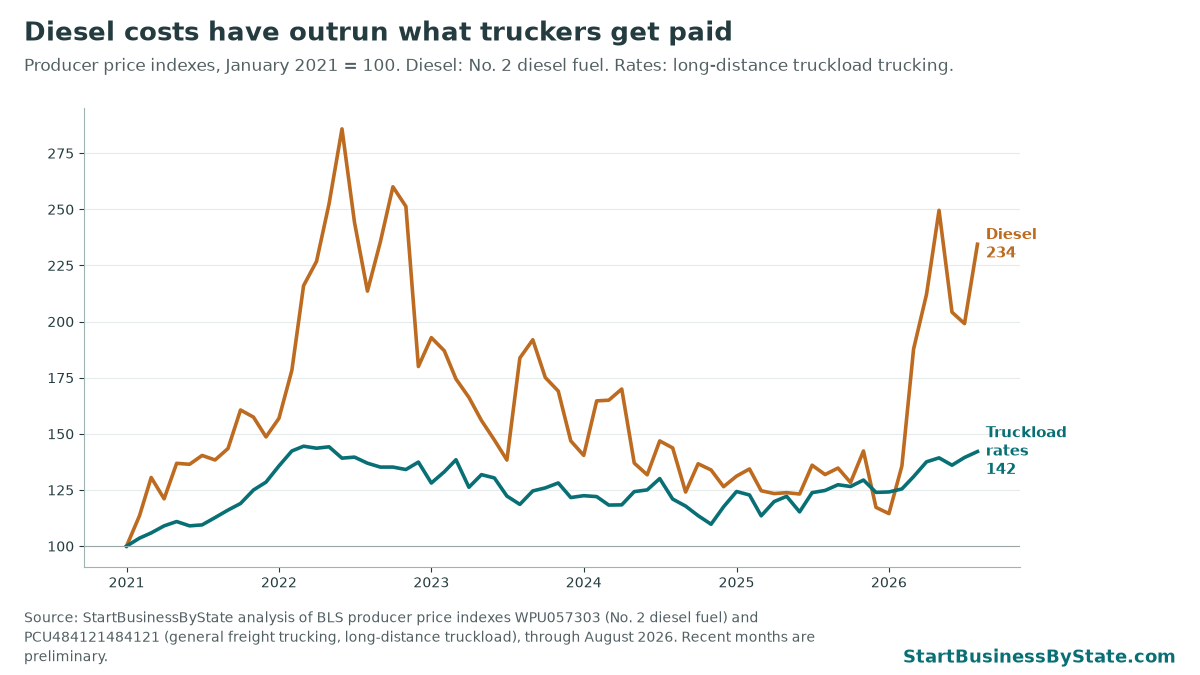
Fuel and driver pay are a trucking company’s two biggest costs. When diesel jumps and rates don’t, the difference comes out of the carrier’s margin. Large fleets with fuel surcharges built into contracts recover much of it. Small carriers hauling spot-market loads often can’t.
Trucking and diesel, every state
Click a column header to sort. Diesel prices are EIA regional averages, so states in the same region show the same change. State names link to each state’s business startup hub.
| State | Trucking jobs (Mar 2026) | Change from a year earlier | Trucking employers | Owner-operators and other nonemployers (2023) | Avg. receipts per nonemployer | Heavy truck drivers (May 2025) | Driver median pay | Diesel change, per gal. | Extra diesel per truck, per year Modeled |
|---|---|---|---|---|---|---|---|---|---|
| United States | 1,426,011 | -2.7% | 171,098 | 879,215 | $114,222 | 2,062,040 | $58,640 | +$2.63 | $40,431 |
| Texas | 147,664 | -1.9% | 13,666 | 129,002 | $120,087 | 209,680 | $56,290 | +$2.54 | $39,108 |
| California | 137,102 | -2.7% | 24,451 | 104,485 | $123,366 | 205,090 | $60,230 | +$3.20 | $49,231 |
| Illinois | 70,631 | -2.1% | 14,811 | 60,424 | $106,230 | 84,200 | $60,320 | +$2.79 | $43,000 |
| Ohio | 64,893 | -2.5% | 6,142 | 32,815 | $129,121 | 83,060 | $59,800 | +$2.79 | $43,000 |
| Florida | 63,898 | -1.4% | 9,908 | 102,102 | $92,788 | 112,920 | $50,640 | +$2.28 | $35,077 |
| Pennsylvania | 62,568 | -3.4% | 6,283 | 26,925 | $121,461 | 87,550 | $58,580 | +$2.63 | $40,446 |
| Georgia | 59,414 | -2.1% | 5,633 | 37,730 | $94,394 | 74,840 | $57,050 | +$2.28 | $35,077 |
| Tennessee | 52,505 | -4.7% | 3,185 | 15,100 | $113,592 | 64,890 | $58,620 | +$2.79 | $43,000 |
| Indiana | 50,647 | -0.7% | 4,557 | 17,745 | $120,524 | 59,090 | $60,290 | +$2.79 | $43,000 |
| North Carolina | 45,785 | -1.7% | 5,763 | 22,923 | $104,417 | 62,400 | $51,530 | +$2.28 | $35,077 |
| Michigan | 43,806 | -3.2% | 4,951 | 21,422 | $106,714 | 60,800 | $57,180 | +$2.79 | $43,000 |
| Wisconsin | 38,594 | -4.6% | 3,766 | 9,459 | $144,310 | 53,330 | $58,610 | +$2.79 | $43,000 |
| New Jersey | 36,166 | -2.8% | 3,687 | 25,779 | $115,906 | 47,980 | $63,570 | +$2.63 | $40,446 |
| Missouri | 35,636 | -5.7% | 3,868 | 13,735 | $127,064 | 47,760 | $54,550 | +$2.79 | $43,000 |
| New York | 34,888 | -4.5% | 4,683 | 37,145 | $85,603 | 63,700 | $62,050 | +$2.63 | $40,446 |
| Arkansas | 29,460 | -5.9% | 2,070 | 7,478 | $116,910 | 32,220 | $51,550 | +$2.54 | $39,108 |
| Virginia | 28,556 | -3.4% | 3,237 | 14,436 | $105,881 | 48,750 | $56,860 | +$2.28 | $35,077 |
| Alabama | 25,049 | -3.8% | 2,830 | 10,477 | $111,993 | 36,650 | $52,120 | +$2.54 | $39,108 |
| Arizona | 24,850 | -2.1% | 2,558 | 11,895 | $120,787 | 40,150 | $58,080 | +$2.50 | $38,462 |
| Iowa | 23,757 | -4.4% | 2,652 | 8,263 | $147,900 | 35,040 | $58,070 | +$2.79 | $43,000 |
| Kentucky | 23,526 | -1.3% | 2,579 | 11,029 | $122,507 | 31,760 | $56,340 | +$2.79 | $43,000 |
| Minnesota | 22,938 | -6.4% | 3,082 | 17,907 | $133,381 | 38,770 | $61,990 | +$2.79 | $43,000 |
| South Carolina | 22,870 | +1.2% | 2,550 | 12,702 | $104,898 | 34,170 | $51,130 | +$2.28 | $35,077 |
| Washington | 22,343 | -2.2% | 2,392 | 14,877 | $138,467 | 40,530 | $64,760 | +$2.50 | $38,462 |
| Nebraska | 20,687 | -3.7% | 1,841 | 5,868 | $138,512 | 23,160 | $58,390 | +$2.79 | $43,000 |
| Utah | 20,356 | -1.3% | 1,858 | 4,493 | $132,033 | 25,060 | $60,620 | +$2.67 | $41,154 |
| Mississippi | 18,839 | -2.1% | 2,078 | 10,551 | $108,068 | 24,160 | $51,820 | +$2.54 | $39,108 |
| Oklahoma | 17,479 | -3.1% | 1,835 | 8,158 | $130,815 | 27,840 | $54,410 | +$2.79 | $43,000 |
| Maryland | 17,413 | -1.3% | 2,129 | 10,942 | $104,388 | 29,150 | $59,360 | +$2.63 | $40,446 |
| Colorado | 17,056 | -3.2% | 2,423 | 10,161 | $129,078 | 25,350 | $61,500 | +$2.67 | $41,154 |
| Oregon | 16,958 | -3.8% | 1,923 | 5,248 | $139,028 | 23,970 | $61,980 | +$2.50 | $38,462 |
| Kansas | 16,820 | +1.1% | 1,628 | 5,713 | $159,698 | 24,220 | $58,920 | +$2.79 | $43,000 |
| Louisiana | 16,436 | -1.6% | 2,432 | 11,304 | $94,958 | 28,540 | $49,320 | +$2.54 | $39,108 |
| Massachusetts | 15,056 | -1.8% | 1,870 | 6,377 | $102,736 | 30,890 | $63,030 | +$2.55 | $39,200 |
| Nevada | 10,016 | -0.9% | 1,007 | 6,776 | $115,822 | 15,010 | $62,290 | +$2.50 | $38,462 |
| Idaho | 9,502 | -2.1% | 1,747 | 3,718 | $149,088 | 15,920 | $58,770 | +$2.67 | $41,154 |
| New Mexico | 8,336 | -0.1% | 860 | 3,716 | $137,237 | 11,820 | $50,500 | +$2.54 | $39,108 |
| North Dakota | 7,665 | -8.9% | 1,062 | 2,166 | $163,078 | 11,870 | $60,910 | +$2.79 | $43,000 |
| Connecticut | 7,621 | +1.7% | 983 | 4,362 | $112,616 | 15,740 | $60,490 | +$2.55 | $39,200 |
| West Virginia | 6,475 | -2.1% | 921 | 1,855 | $125,128 | 12,190 | $49,480 | +$2.28 | $35,077 |
| Maine | 4,684 | -3.4% | 703 | 1,176 | $128,346 | 9,980 | $57,050 | +$2.55 | $39,200 |
| South Dakota | 4,490 | -4.3% | 978 | 2,322 | $160,784 | 6,470 | $58,690 | +$2.79 | $43,000 |
| Montana | 4,067 | -5.8% | 853 | 1,609 | $143,925 | 7,830 | $58,870 | +$2.67 | $41,154 |
| Wyoming | 3,334 | -3.8% | 589 | 1,159 | $150,131 | 6,050 | $60,310 | +$2.67 | $41,154 |
| Alaska | 3,081 | +0.3% | 238 | 528 | $124,133 | 3,420 | $70,100 | +$2.50 | $38,462 |
| Hawaii | 2,978 | -2.3% | 289 | 350 | $88,234 | 4,070 | $59,820 | +$2.50 | $38,462 |
| New Hampshire | 2,828 | +0.1% | 415 | 904 | $129,637 | 6,960 | $60,280 | +$2.55 | $39,200 |
| Delaware | 2,429 | +2.4% | 417 | 1,541 | $119,625 | 9,040 | $57,590 | +$2.63 | $40,446 |
| Rhode Island | 1,983 | -2.6% | 409 | 1,334 | $84,997 | 3,620 | $60,190 | +$2.55 | $39,200 |
| Vermont | 1,801 | -2.0% | 258 | 583 | $126,702 | 3,560 | $60,830 | +$2.55 | $39,200 |
| District of Columbia | 75 | -14.8% | 48 | 446 | $57,489 | 830 | $64,170 | +$2.63 | $40,446 |
Trucking jobs and employers: BLS QCEW 2026 Q1, NAICS 484, private, March employment. Nonemployers: Census Nonemployer Statistics 2023, NAICS 484. Drivers: BLS OEWS May 2025, occupation 53-3032 (all industries). Diesel: EIA weekly on-highway diesel, week of September 28, 2026 vs. Sep 29, 2025. Extra diesel per truck = 15,385 gallons × regional price change.
Download the data (CSV)Where trucking jobs are shrinking
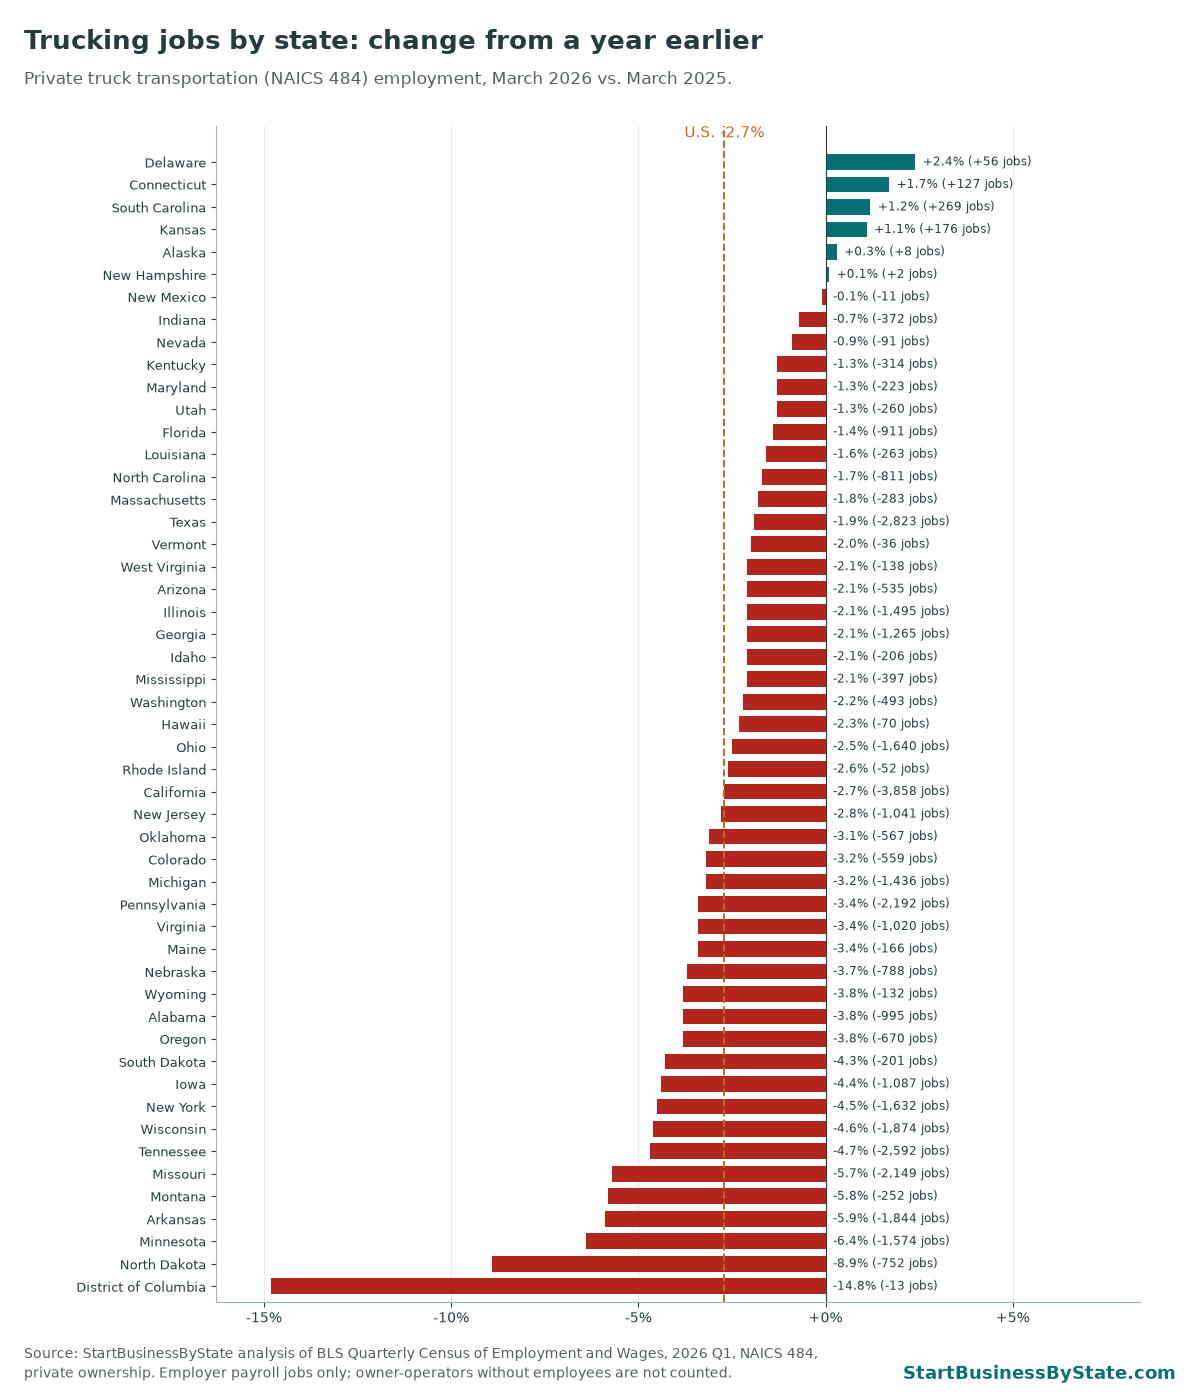
These counts cover payroll jobs at trucking companies. They miss owner-operators who work alone, and drivers employed by retailers, builders and other non-trucking companies. That’s why the driver count from OEWS (2,062,040) is higher than the trucking industry job count. Florida has the largest share of trucking businesses with no employees (91%), followed by Texas and New York.
If you’re starting a trucking business now
Getting your own operating authority is the easy part. Keeping a truck running in a year like this is harder. Sort these out first.
- Price every load with today’s diesel, not last month’s. Divide the trip miles by your real mpg, multiply by this week’s price in the region where you’ll fuel, and add it to your cost before you accept the rate. Check prices in our diesel prices by state tracker.
- Get a fuel surcharge in writing. Most surcharge tables follow EIA’s weekly diesel average. If a broker or shipper won’t add one, assume you’re carrying the fuel risk yourself and price it in.
- Know whether your state cut fuel taxes. Ohio and Georgia suspended diesel taxes, and other states changed dyed-diesel rules for farm and timber hauls. See the fuel tax holiday tracker, and keep every receipt for your IFTA return.
- Leased to a carrier, or your own authority? If you drive under someone else’s authority, your state’s independent contractor rules decide whether you’re a contractor or an employee. If you hire drivers, check workers’ comp requirements and new employer unemployment tax rates in your state.
- Keep three months of fuel money in the bank. At about $8,182 a month in diesel for a 100,000-mile year at today’s average, one slow-paying broker can drain a new carrier fast.
Not hauling freight yourself but feeling it in delivery fees? Landscapers, HVAC companies and food trucks see it as fuel surcharges. See fuel costs for mobile service businesses and how many businesses are paying higher prices.
How we did this
- Trucking jobs and employers. BLS Quarterly Census of Employment and Wages, open data file data.bls.gov/cew/data/api/2026/1/industry/484.csv: own_code 5 (private), agglvl_code 55 (state, NAICS 3-digit), size_code 0. Third-month employment (March), quarterly establishments, average weekly wage, and BLS’s over-the-year change fields. U.S. row: agglvl_code 15.
- Nonemployer businesses. Census Bureau Nonemployer Statistics 2023, API dataset 2023/nonemp, NAICS2022=484, variables NESTAB (establishments) and NRCPTOT (receipts, $1,000).
- Truck drivers. BLS Occupational Employment and Wage Statistics, May 2025, occupation 53-3032 (heavy and tractor-trailer truck drivers), cross-industry. Series OEUS[state FIPS]00000000000533032 + 01 (employment) and 13 (annual median wage); U.S. OEUN000000000000053303201/13.
- Diesel prices. EIA weekly retail on-highway diesel, API route petroleum/pri/gnd, product EPD2D, series EMD_EPD2D_PTE_[region]_DPG. Week of September 28, 2026 vs. Sep 29, 2025.
- Price indexes. BLS PPI WPU057303 (No. 2 diesel fuel) and PCU484121484121 (general freight trucking, long-distance truckload), monthly since January 2021.
Caveats
- QCEW counts payroll jobs by where the employer reports them. A carrier’s drivers may be counted in its home state even if they drive elsewhere.
- Nonemployer counts are from 2023, before this year’s diesel spike.
- Recent PPI months are preliminary and may be revised.
BLS, Census and EIA data are public domain. This page has no ads or affiliate links. Cite as: StartBusinessByState, “The Trucking Squeeze by State,” updated October 6, 2026, https://startbusinessbystate.com/trucking-industry-by-state-diesel-squeeze/
Related research
- The diesel shock bill by state: what $6 diesel adds to each state’s diesel spending.
- Diesel and gas prices by state.
- Fuel tax holidays and dyed-diesel waivers by state.
- Nonemployer share of service businesses by state.
- Business survival rates by state.
- truck driver fatality data: driver deaths and rates from the 2024 BLS census.
FAQ
How much more does diesel cost a trucker this year?
About $40,431 more a year for a truck driving 100,000 miles at 6.5 mpg, based on the U.S. average diesel price the week of Sep 28, 2026 ($6.38) vs. a year earlier ($3.75). That is our estimate. Your number depends on miles, fuel economy and where you fill up.
Are trucking jobs declining?
Yes. Private truck transportation employment was 1,426,011 in March 2026, down 2.7% from a year earlier, and fell in 44 states and DC, according to the BLS Quarterly Census of Employment and Wages.
How many owner-operators are there?
The Census Bureau counted 879,215 trucking businesses with no employees in 2023, the latest year. Most are owner-operators, though some are part-time. They averaged about $114,222 in receipts.
Are freight rates going up with diesel?
Not as fast. The BLS producer price index for long-distance truckload trucking is up 13.9% from a year earlier, against 77.8% for diesel fuel (August 2026). Fuel surcharges cover part of the gap on contract freight.
Which state has the most trucking jobs?
Texas, with 147,664 private trucking jobs in March 2026, followed by California (137,102) and Illinois (70,631).
How often is this updated?
Diesel prices update weekly after EIA’s Monday release. Trucking jobs update each quarter when BLS publishes new QCEW data, driver wages once a year, and owner-operator counts when Census releases new Nonemployer Statistics.
Last updated October 6, 2026. Diesel through the week of September 28, 2026. Trucking jobs: QCEW 2026 Q1.