Original research · Census American Community Survey microdata · Last updated October 6, 2026
Data through: ACS 2020–2024 5-year Public Use Microdata Sample (the latest five-year file), checked against the 2024 1-year file. Updated once a year.
More than 1 in 5 U.S. childcare workers is an immigrant. Census survey data for 2020–2024 put the foreign-born share at 22.5%, and 12.2% are not U.S. citizens. New York (43.6%), California (39.0%) and Maryland (35.6%) rely on immigrants most. Immigrants make up 32.3% of childcare workers in private homes.
Key findings
- 22.5% of U.S. childcare workers were born abroad (±0.4 points). That is about 207,800 people, compared with 17.0% of all U.S. adults. The 2024 1-year survey gives nearly the same share, 22.5%.
- New York leads at 43.6%. Next come California (39.0%), Maryland (35.6%), Florida (35.2%) and New Jersey (35.0%). The District of Columbia (42.7%) and Rhode Island (34.7%) are also high, but their samples are small.
- 12.2% are not U.S. citizens. That is roughly 113,000 workers. The noncitizen share is highest in Maryland (22.1%). Citizenship status in the survey does not show legal status.
- Immigrants are a bigger share of in-home childcare. In private households, 32.3% of childcare workers are foreign-born. In the childcare services industry, which includes centers and licensed home daycares, it is 22.2%.
- 18 states have a clearly higher immigrant share in childcare than among adults overall. The biggest gaps among states with solid samples are New York (+16.3 points), Maryland (+15.8) and Virginia (+14.3).
- Immigration enforcement is already moving these workers. A May 2026 study in PNAS linked a doubling of ICE apprehensions to about 52,900 fewer foreign-born women working in center-based childcare and about 28,400 more in private-household care, a net loss of about 24,500. U.S.-born workers did not broadly fill the gap.
The 20 states where childcare relies most on immigrants
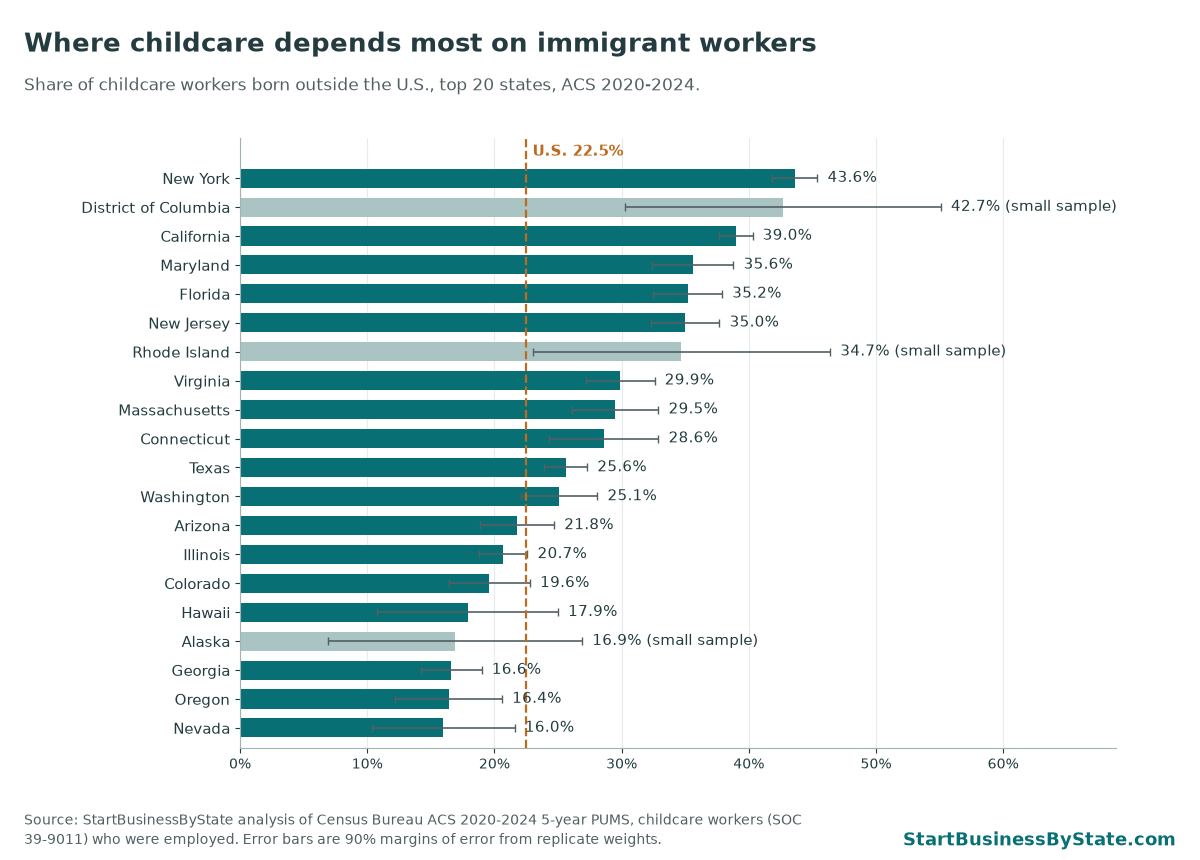
The top states all have large immigrant populations: New York, California, Florida, New Jersey and Maryland. In New York, about 34,000 of the state’s 78,100 childcare workers were born abroad. California has the most immigrant childcare workers by number, about 49,800.
At the other end, immigrants are a small part of the childcare workforce in much of the South and Midwest. Alabama, Kentucky and Kansas are at 3.5%, 4.5% and 4.7%, though these estimates are less precise.
Immigrant childcare workers in every state
Click a column header to sort. The ± column is the 90% margin of error. Rows shaded and marked “Use with caution” have fewer than 100 survey responses or a margin of error that is large compared with the estimate. State names link to our guide to opening a daycare there.
| Rank | State | Foreign-born share of childcare workers | ± (90% MOE) | Foreign-born childcare workers | All childcare workers | Not U.S. citizens | Foreign-born share of all adults | Gap (points) | Survey responses | Reliability |
|---|---|---|---|---|---|---|---|---|---|---|
| 1 | New York | 43.6% | ±1.8 | 34,025 | 78,093 | 20.3% | 27.3% | +16.3 | 3,336 | OK |
| 2 | District of Columbia | 42.7% | ±12.4 | 689 | 1,612 | 33.6% | 16.8% | +25.9 | 99 | Use with caution |
| 3 | California | 39.0% | ±1.3 | 49,784 | 127,505 | 20.7% | 33.2% | +5.9 | 5,690 | OK |
| 4 | Maryland | 35.6% | ±3.2 | 7,519 | 21,112 | 22.1% | 19.8% | +15.8 | 938 | OK |
| 5 | Florida | 35.2% | ±2.7 | 14,024 | 39,853 | 18.7% | 25.5% | +9.7 | 1,562 | OK |
| 6 | New Jersey | 35.0% | ±2.7 | 9,890 | 28,250 | 20.7% | 28.7% | +6.3 | 1,214 | OK |
| 7 | Rhode Island | 34.7% | ±11.7 | 688 | 1,984 | 17.8% | 17.6% | +17.1 | 79 | Use with caution |
| 8 | Virginia | 29.9% | ±2.7 | 7,874 | 26,300 | 15.9% | 15.6% | +14.3 | 1,165 | OK |
| 9 | Massachusetts | 29.5% | ±3.4 | 6,468 | 21,948 | 15.4% | 21.0% | +8.5 | 970 | OK |
| 10 | Connecticut | 28.6% | ±4.3 | 3,623 | 12,657 | 16.0% | 18.5% | +10.1 | 540 | OK |
| 11 | Texas | 25.6% | ±1.7 | 19,729 | 77,091 | 16.1% | 21.8% | +3.8 | 3,075 | OK |
| 12 | Washington | 25.1% | ±3.0 | 5,458 | 21,729 | 15.7% | 18.4% | +6.7 | 974 | OK |
| 13 | Arizona | 21.8% | ±2.9 | 3,923 | 17,984 | 11.9% | 15.8% | +6.0 | 727 | OK |
| 14 | Illinois | 20.7% | ±1.9 | 8,641 | 41,839 | 10.7% | 18.0% | +2.7 | 1,898 | OK |
| 15 | Colorado | 19.6% | ±3.2 | 3,254 | 16,638 | 12.0% | 11.7% | +7.9 | 729 | OK |
| 16 | Hawaii | 17.9% | ±7.1 | 509 | 2,845 | 5.9% | 21.5% | −3.6 | 141 | OK |
| 17 | Alaska | 16.9% | ±10.0 | 421 | 2,486 | 13.9% | 9.5% | +7.4 | 109 | Use with caution |
| 18 | Georgia | 16.6% | ±2.4 | 4,078 | 24,551 | 7.9% | 13.5% | +3.1 | 1,009 | OK |
| 19 | Oregon | 16.4% | ±4.2 | 1,808 | 11,017 | 9.7% | 11.7% | +4.8 | 504 | OK |
| 20 | Nevada | 16.0% | ±5.6 | 767 | 4,802 | 10.5% | 23.6% | −7.6 | 215 | OK |
| 21 | Pennsylvania | 12.1% | ±2.4 | 3,802 | 31,444 | 6.9% | 9.0% | +3.1 | 1,442 | OK |
| 22 | New Mexico | 12.1% | ±5.8 | 521 | 4,305 | 6.7% | 11.5% | +0.6 | 157 | OK |
| 23 | Delaware | 11.1% | ±7.6 | 198 | 1,791 | 8.4% | 12.6% | −1.5 | 68 | Use with caution |
| 24 | Minnesota | 11.0% | ±3.2 | 2,541 | 23,121 | 3.9% | 10.3% | +0.7 | 1,054 | OK |
| 25 | North Carolina | 10.6% | ±2.2 | 2,345 | 22,175 | 7.2% | 10.7% | −0.1 | 1,000 | OK |
| 26 | Maine | 7.9% | ±4.1 | 283 | 3,580 | 6.7% | 4.5% | +3.4 | 182 | Use with caution |
| 27 | Michigan | 7.8% | ±1.8 | 2,030 | 26,145 | 4.5% | 8.5% | −0.8 | 1,209 | OK |
| 28 | Idaho | 7.3% | ±3.4 | 349 | 4,804 | 5.2% | 7.3% | −0.1 | 217 | OK |
| 29 | Arkansas | 7.1% | ±4.3 | 444 | 6,296 | 4.2% | 6.6% | +0.5 | 314 | Use with caution |
| 30 | South Carolina | 6.9% | ±2.6 | 775 | 11,153 | 2.3% | 6.8% | +0.1 | 509 | OK |
| 31 | Utah | 6.8% | ±2.3 | 670 | 9,861 | 4.3% | 11.5% | −4.7 | 464 | OK |
| 32 | Louisiana | 6.8% | ±2.7 | 538 | 7,894 | 5.5% | 5.8% | +1.1 | 364 | OK |
| 33 | Oklahoma | 6.7% | ±2.7 | 652 | 9,762 | 3.8% | 7.8% | −1.1 | 492 | OK |
| 34 | Ohio | 6.6% | ±1.5 | 1,841 | 27,838 | 3.6% | 6.2% | +0.5 | 1,360 | OK |
| 35 | Vermont | 6.6% | ±6.2 | 121 | 1,845 | 2.9% | 4.9% | +1.6 | 87 | Use with caution |
| 36 | Wisconsin | 6.6% | ±3.0 | 1,077 | 16,422 | 3.0% | 6.1% | +0.4 | 754 | OK |
| 37 | Wyoming | 6.3% | ±6.5 | 105 | 1,665 | 4.5% | 4.3% | +2.0 | 77 | Use with caution |
| 38 | Tennessee | 6.2% | ±2.0 | 994 | 15,970 | 3.8% | 7.0% | −0.8 | 702 | OK |
| 39 | Nebraska | 6.2% | ±2.9 | 556 | 8,991 | 3.5% | 9.6% | −3.4 | 454 | OK |
| 40 | Iowa | 6.2% | ±2.6 | 948 | 15,355 | 2.7% | 7.0% | −0.8 | 821 | OK |
| 41 | New Hampshire | 5.8% | ±3.7 | 221 | 3,801 | 4.1% | 7.1% | −1.3 | 156 | Use with caution |
| 42 | West Virginia | 5.4% | ±4.6 | 185 | 3,411 | 5.1% | 2.1% | +3.3 | 149 | Use with caution |
| 43 | Indiana | 5.3% | ±2.0 | 962 | 18,216 | 4.4% | 7.5% | −2.2 | 839 | OK |
| 44 | Missouri | 5.0% | ±1.7 | 845 | 16,739 | 2.0% | 5.3% | −0.3 | 838 | OK |
| 45 | Kansas | 4.7% | ±2.2 | 521 | 11,185 | 2.8% | 9.0% | −4.3 | 528 | OK |
| 46 | Kentucky | 4.5% | ±2.1 | 463 | 10,193 | 2.5% | 5.3% | −0.8 | 477 | OK |
| 47 | Alabama | 3.5% | ±1.6 | 355 | 10,231 | 1.8% | 4.7% | −1.2 | 496 | OK |
| 48 | North Dakota | 3.1% | ±2.2 | 172 | 5,549 | 1.2% | 5.5% | −2.4 | 257 | Use with caution |
| 49 | Mississippi | 1.6% | ±1.3 | 105 | 6,467 | 0.9% | 2.9% | −1.3 | 294 | Use with caution |
| 50 | South Dakota | 0.7% | ±0.9 | 30 | 4,464 | 0.1% | 4.6% | −3.9 | 228 | Use with caution |
| 51 | Montana | 0.6% | ±0.9 | 17 | 2,655 | 0.1% | 2.7% | −2.1 | 141 | Use with caution |
Childcare workers: occupation code 39-9011, employed (at work or with a job but not at work, civilian or Armed Forces), Census ACS 2020–2024 5-year PUMS, weighted. Worker counts are five-year averages. Foreign-born share of all adults: people 18 and older, ACS 2020–2024 5-year table B05003. U.S. total: 22.5% foreign-born (±0.4), 12.2% noncitizen, from 41,104 survey responses.
Download the data (CSV)Childcare compared with the adult population
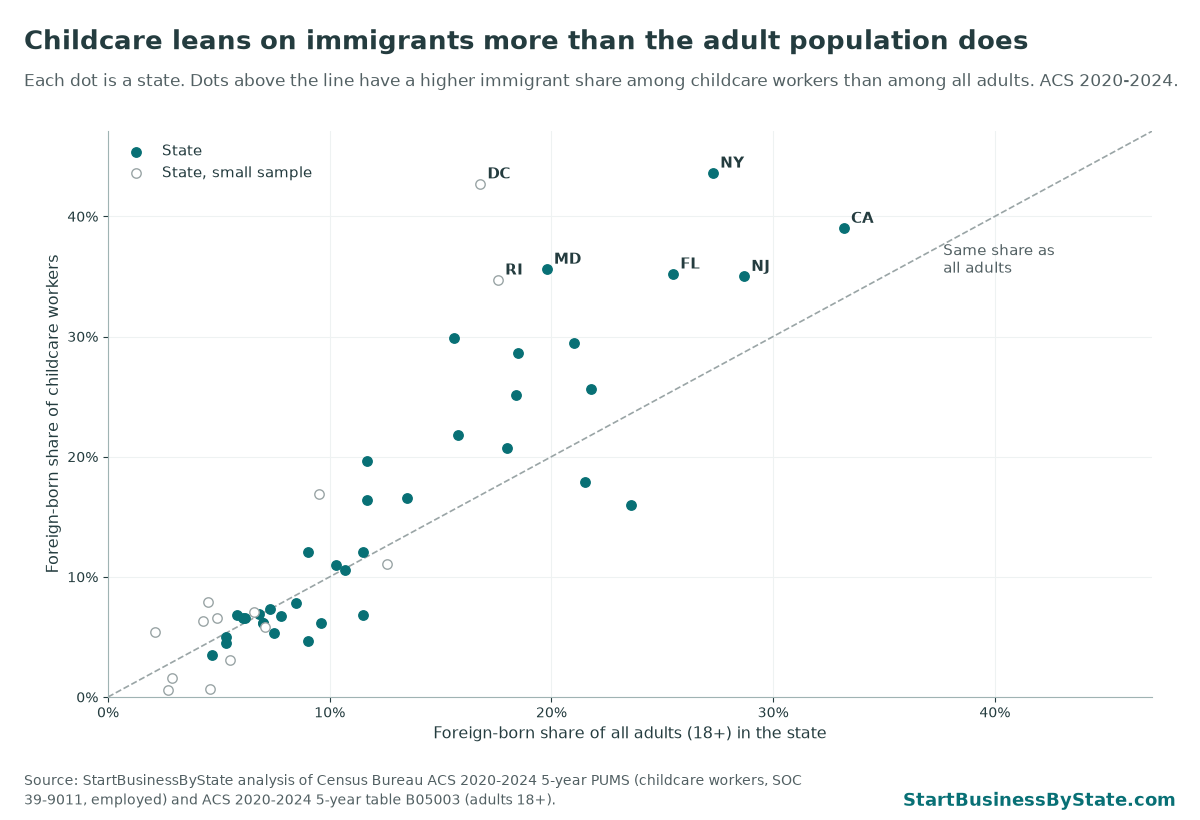
In most states, immigrants hold a bigger share of childcare jobs than their share of the adult population. Nationally the gap is 5.5 points: 22.5% of childcare workers against 17.0% of adults. In 18 states, the childcare share is higher even after allowing for the margin of error.
The gap is widest in New York, Maryland and Virginia. In those states, immigrant workers fill a much larger part of childcare than you would expect from the adult population alone.
Setting matters too. In private households, where nannies and babysitters work, 32.3% of childcare workers are foreign-born. In the childcare services industry it is 22.2%. The PNAS study found ICE activity pushed some immigrant women out of centers and into private-household work (Aslim, Currie, Herbst and Tekin, PNAS, 2026).
What this means if you’re starting a daycare
For a provider in New York or California, the workforce markets highlighted above, compare New York daycare insurance or California daycare insurance. Build the staffing plan around the qualifications, checks and coverage required for your own setting.
Hiring is one of the biggest jobs in opening a daycare, and in many states a large share of the people doing this work are immigrants. Plan your staffing with that in mind.
- Know your local labor pool. If you are opening in New York, Maryland, Florida, New Jersey or California, more than a third of childcare workers are foreign-born. Staffing there is more exposed to changes in immigration enforcement, so build a bench of substitute staff and keep in touch with past applicants.
- Verify work eligibility the same way for everyone. Federal law requires a Form I-9 for every new hire. Complete it on time for each employee, keep it on file, and don’t single anyone out for extra checks based on how they look or sound.
- Budget for higher wages. If enforcement shrinks the labor pool, pay may need to rise to fill shifts. Check how pay compares with tuition in your state with our daycare wage vs. price analysis, then test your numbers in the daycare break-even calculator.
- Staffing limits enrollment. State ratio rules cap how many children each staff member can watch. A vacancy can close a classroom, so plan tuition and cash flow for months when you are short-staffed.
- Look at where demand outruns supply. Our childcare availability by state and childcare prices by state pages show where families have the fewest options. Subsidy dollars also vary a lot; see childcare subsidy funding by state.
Getting started? Read our guide to starting a daycare and compare markets in the best states to open a daycare.
How we did this
- Childcare workers. Census Bureau American Community Survey 2020–2024 5-year Public Use Microdata Sample (PUMS), pulled from the Census API (route 2024/acs/acs5/pums) on October 6, 2026. We kept people with occupation SOCP 399011 (childcare workers) whose employment status (ESR) was employed: civilian at work (1), civilian with a job but not at work (2), or Armed Forces (4, 5). All figures use the person weight PWGTP.
- Foreign-born and citizenship. NATIVITY = 2 is foreign-born. CIT = 5 is not a U.S. citizen.
- Setting. Industry INDP 8470 (child care services) and 9290 (private households). The rest work in other industries such as schools, religious groups and social services.
- Margins of error. We used the 80 replicate weights (PWGTP1 to PWGTP80) and the Census successive-difference formula: SE = √(4/80 × Σ(replicate − estimate)²). The 90% margin is 1.645 × SE. We flag a state when it has fewer than 100 survey responses or a coefficient of variation above 30%.
- Adult comparison. ACS 2020–2024 5-year table B05003: foreign-born men and women 18 and over (B05003_010 + B05003_021) divided by all men and women 18 and over (B05003_008 + B05003_019).
- National check. ACS 2024 1-year PUMS, same filters: 22.5% foreign-born.
- Enforcement research. Aslim, E.G., Currie, J., Herbst, C.M. and Tekin, E. (2026), “How rising ICE activity influences the childcare workforce,” Proceedings of the National Academy of Sciences 123(21), doi:10.1073/pnas.2602686123. The study uses Current Population Survey data from September 2023 to September 2025 linked to ICE arrest records from the Deportation Data Project.
Caveats
- The ACS asks about citizenship, not immigration status. Some immigrants may avoid the survey, which could understate the foreign-born share.
- Childcare worker (39-9011) does not include preschool teachers, childcare center directors or teacher assistants in schools.
- Small states have wide margins of error. Use the ± column and the reliability flag before quoting a state figure.
- Worker counts are averages over five years and will not match current payroll counts from other sources.
Census data are public domain. This page has no ads or affiliate links. Cite as: StartBusinessByState, “Immigrant Childcare Workers by State,” updated October 6, 2026, https://startbusinessbystate.com/immigrant-childcare-workers-by-state/
Related research
- Immigrant workers by trade and state: construction, landscaping and cleaning.
- Daycare industry statistics.
- Daycare wages vs. prices by state.
- Childcare availability by state.
- Childcare jobs by state: where private childcare employment rose and fell over the past year.
- Employer childcare tax credits by state.
FAQ
What percentage of childcare workers are immigrants?
22.5% of U.S. childcare workers were born outside the United States, according to our analysis of Census American Community Survey data for 2020–2024. That is about 207,800 of 923,600 workers. The share among all U.S. adults is 17.0%.
Which state has the most immigrant childcare workers?
By share, New York (43.6%), among states with solid samples. By number, California has the most, about 49,800 foreign-born childcare workers, followed by New York with about 34,000.
How are ICE arrests affecting daycare staffing?
A peer-reviewed study in PNAS (Aslim, Currie, Herbst and Tekin, May 2026) used Current Population Survey data from September 2023 to September 2025. It found that a doubling of ICE apprehensions was linked to about 52,900 fewer foreign-born women in center-based childcare, partly offset by about 28,400 more in private-household care. U.S.-born workers did not broadly replace them.
Does “foreign-born” mean undocumented?
No. Foreign-born means born outside the U.S. to non-citizen parents, and it includes naturalized citizens and green card holders. About 12.2% of childcare workers are not citizens, but the Census survey does not ask about legal status.
Who counts as a childcare worker here?
People whose job is “childcare worker” (occupation code 39-9011) and who were employed at the time of the survey. This includes daycare staff, nannies and babysitters. Preschool teachers and childcare center directors are separate occupations and are not included.
How often is this updated?
Once a year, when the Census Bureau releases new five-year American Community Survey microdata, usually in January. We also add new research on immigration and the childcare workforce as it is published.
Last updated October 6, 2026. Data: ACS 2020–2024 5-year PUMS. Next update: after the Census Bureau releases the 2021–2025 file.