Original research · BLS AI exposure categories and BLS job counts by state · Updated September 28, 2026
Data through: jobs by occupation and state, May 2025 (BLS OEWS) · AI exposure categories published August 27, 2026 (BLS) · Microsoft AI applicability scores v1.1 (December 2025) · Anthropic job exposure file (March 2026) · business AI use survey through September 6, 2026 (Census)
Nearly 1 in 3 U.S. jobs is in work where AI overlaps the most. 31.7% of jobs (49.2 million) are in occupations the Bureau of Labor Statistics (BLS) rates “Very high” for AI exposure. Only 17.6% (27.4 million) are rated “Low.” D.C. has the highest share at 48.9%, followed by Colorado (36.4%) and Maryland (36.1%). Wyoming (24.6%) and Mississippi (24.9%) have the lowest. Exposure is not job loss. It means AI could help with or do some of the tasks in a job. It does not mean the job goes away.
Key findings
- 49.2 million U.S. jobs (31.7%) are in “Very high” AI exposure occupations. Another 24.7% are “High,” 26.0% “Moderate” and 17.6% “Low.” The biggest “Very high” job isn’t in an office. It’s retail salespersons (3.9 million jobs), then customer service reps and general office clerks.
- D.C. stands alone. After that, the states are closer than you might think. In D.C., 48.9% of jobs are “Very high,” 12.6 points ahead of #2 Colorado. Every state falls between 24.6% (Wyoming) and 36.4% (Colorado). The top five: D.C. (48.9%), Colorado (36.4%), Maryland (36.1%), Virginia (35.8%), Massachusetts (35.3%). The bottom five: Wyoming (24.6%), Mississippi (24.9%), North Dakota (25.3%), West Virginia (25.5%), Louisiana (26.0%).
- Hands-on small-business work is rated Low or Moderate. Of the 20 hands-on jobs we checked, 9 are “Low” (carpenters, roofers, painters, landscapers, tree trimmers, janitors, maids, massage therapists and general maintenance workers) and 11 are “Moderate” (including electricians, plumbers, HVAC techs, hairstylists and childcare workers). None is “High” or “Very high.” 7 of the 9 common desk jobs we compared are “Very high.”
- More-exposed jobs tend to pay more. The typical job in the “Very high” group is in an occupation with median pay of $69,990. In the “Low” group it’s $42,260, and in “Moderate” $38,020. But some hands-on trades pay well with little AI overlap: electricians ($63,190), plumbers ($63,800) and HVAC techs ($61,010).
- Three different AI measures put the states in nearly the same order. Microsoft’s AI applicability score matches the BLS ranking with a rank correlation of 0.93, and Anthropic’s observed exposure with 0.96 (1.00 = identical). Of the 10 most exposed states on the BLS measure, 9 are also in Microsoft’s top 10 and 8 in Anthropic’s. They agree less on individual jobs (rank correlation 0.58 between Microsoft and Anthropic).
- States with more highly exposed jobs also report more business AI use. The share of “Very high” jobs lines up with the share of businesses using AI in the Census Bureau’s survey (correlation 0.60 across the 49 states with survey data). See our small-business AI use by state study.
Map: where the most jobs are highly exposed to AI
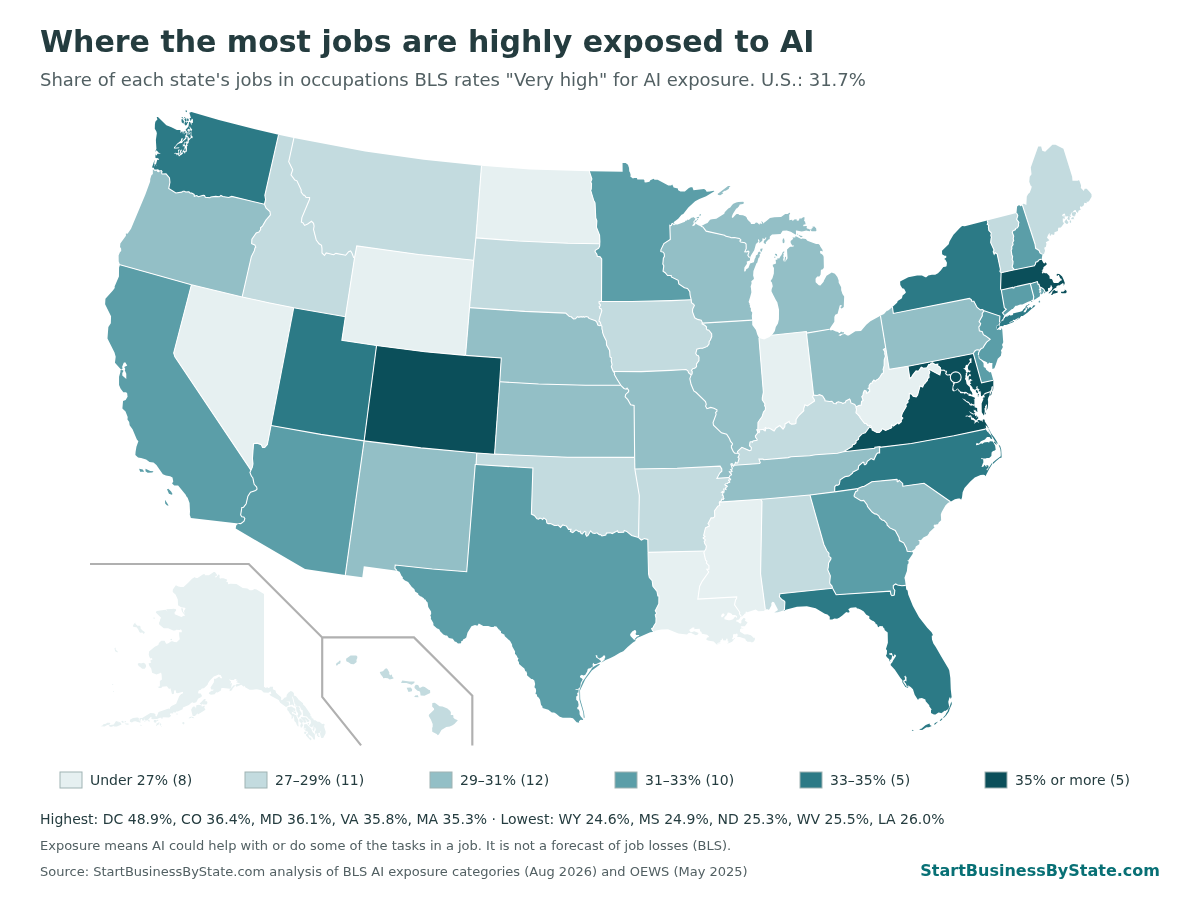
The pattern follows office work. The bigger a state’s share of management, business and finance, computer and legal jobs, the higher its “Very high” share (correlation 0.94). Those jobs make up 42.9% of all jobs in D.C. and 23.5% in Maryland, compared with 18.2% nationwide and 10.2% in Mississippi.
Most and least exposed states
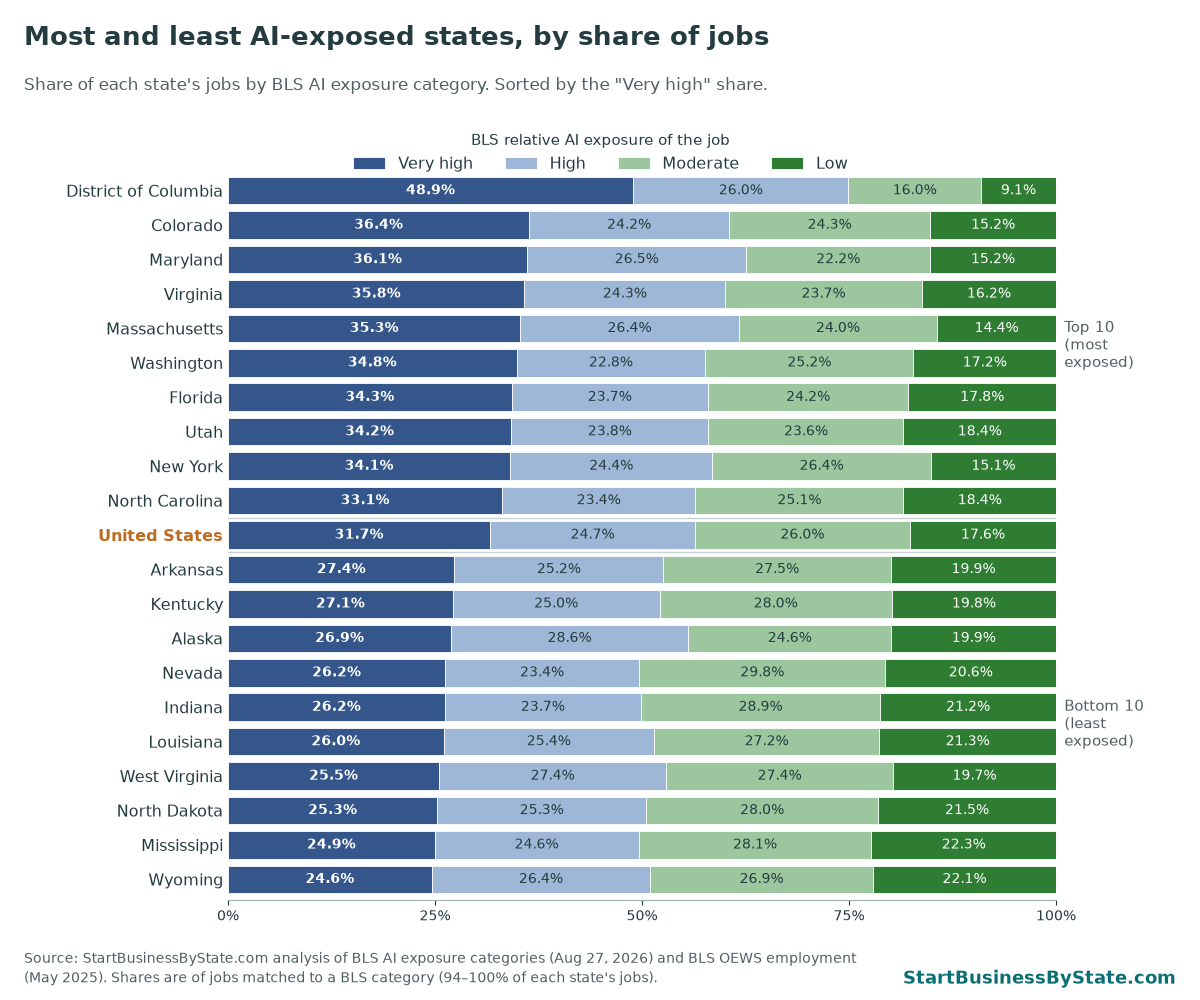
Flip the list around and you get the states with the most “Low” exposure jobs: Mississippi (22.3%), Wyoming (22.1%), South Dakota (21.7%), North Dakota (21.5%), Louisiana (21.3%). D.C. has the fewest, at 9.1%.
Big states sit near the middle. California ranks #18 (31.7%), Texas #16 (32.4%), Florida #7 (34.3%) and New York #9 (34.1%). In raw numbers, that is still a lot of people: 5,757,260 “Very high” jobs in California and 4,546,430 in Texas.
What “AI exposure” means (and doesn’t)
In August 2026, BLS gave every occupation it tracks one of four labels: Low, Moderate, High or Very high. The label says how much of the job’s work AI tools could help with or do, compared with other jobs. BLS built it from five research sources. Three score what AI could do in theory. Two, from Microsoft and Anthropic, look at what people actually ask AI chatbots to do.
In BLS’s own words: “Exposure does not imply job loss, productivity gains, automation probability, or wage effects.” A “Very high” job may change a lot or very little. A “Low” job isn’t guaranteed to stay the same. No job is truly AI-proof. When we say “AI-proof” on this page, we mean the jobs where AI overlaps least today.
The labels are relative. Each group holds roughly a quarter of the 831 occupations. They don’t hold equal numbers of workers, because some jobs are much bigger than others.
| BLS AI exposure | Occupations | U.S. jobs, May 2025 | Share of jobs | Typical pay (median)* | BLS projected growth, 2025–35 |
|---|---|---|---|---|---|
| Low | 212 | 27.4 million | 17.6% | $42,260 | +2.5% |
| Moderate | 206 | 40.4 million | 26.0% | $38,020 | +6.2% |
| High | 206 | 38.4 million | 24.7% | $69,250 | +3.1% |
| Very high | 206 | 49.2 million | 31.7% | $69,990 | +2.0% |
*Pay of the middle job when every job in the group is lined up by its occupation’s median pay. Growth uses BLS projections, which cover more workers (including the self-employed) than the May 2025 job counts.
BLS expects the “Moderate” group to grow fastest (+6.2% by 2035) and the “Very high” group slowest (+2.0%). That’s a slower-growth outlook, not a forecast of layoffs.
“AI-proof” small-business jobs: trades and personal services
If you’re choosing a business to start, the jobs AI overlaps least are the ones where you have to show up. Someone has to run the wire, clear the drain, trim the tree, clean the office and watch the kids.
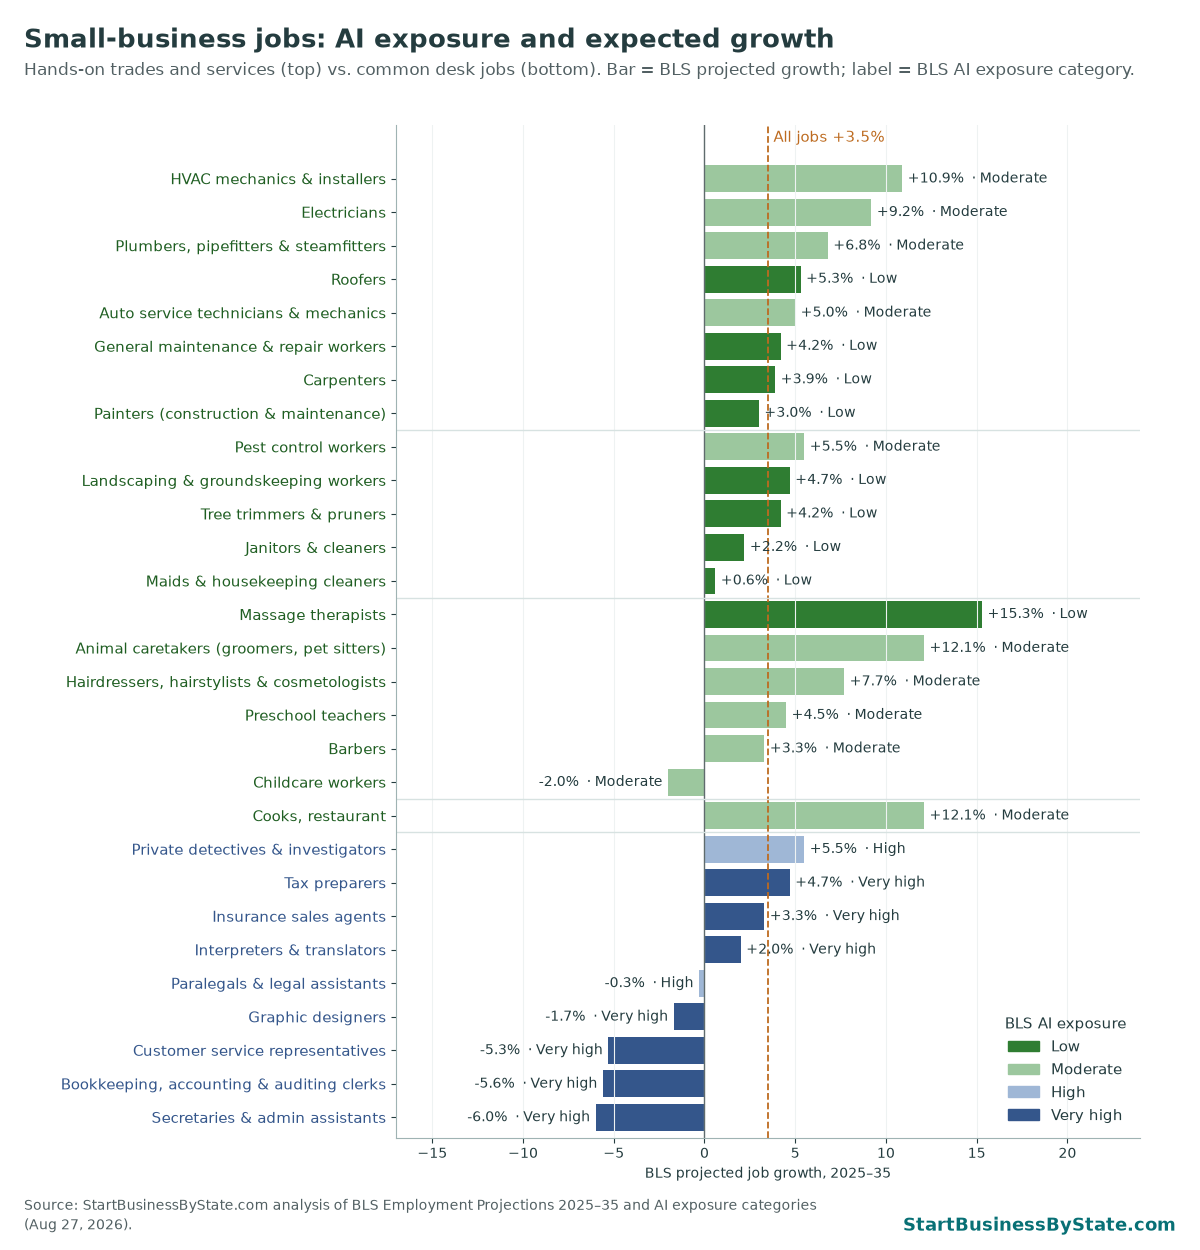
A few things stand out:
- The licensed trades are “Moderate,” not “Low.” Electricians, plumbers and HVAC techs spend part of their day on things AI can help with: quotes, code lookups, diagnostics, scheduling and paperwork. The hands-on work is still the job. BLS expects all three to grow faster than the +3.5% average for all jobs: HVAC +10.9%, electricians +9.2% and plumbers +6.8%.
- Many “Low” jobs are natural one-person businesses. 31.3% of painters, 25.1% of carpenters, 24.4% of tree trimmers and 20.2% of landscapers are self-employed. So are 48.1% of hairstylists (“Moderate”).
- Personal services are growing. BLS projects massage therapists +15.3% (“Low”), animal caretakers +12.1% and hairstylists +7.7%. Childcare is the exception: childcare worker jobs are projected at -2.0%, though preschool teachers grow +4.5%.
- The desk jobs look different. Bookkeeping clerks (-5.6%), secretaries (-6.0%) and customer service reps (-5.3%) are “Very high” and expected to shrink. If you plan a bookkeeping, admin or design business, expect clients to ask what you add beyond what AI tools do.
Low-exposure business ideas with a startup guide on our site:
- Start an HVAC business (Moderate)
- Start a landscaping business (Low)
- Start a tree service (Low)
- Start a cleaning business (Low)
- Start a massage business (Low)
- Open a hair salon (Moderate)
- Start a daycare (Moderate)
- Start a food truck (cooks: Moderate)
| Occupation | BLS AI exposure | U.S. jobs, May 2025 | Median pay | Projected growth, 2025–35 | Self-employed | Our guide |
|---|---|---|---|---|---|---|
| Skilled trades | ||||||
| Electricians | Moderate | 757,220 | $63,190 | +9.2% | 7.1% | — |
| Plumbers, pipefitters & steamfitters | Moderate | 465,840 | $63,800 | +6.8% | 8.0% | — |
| HVAC mechanics & installers | Moderate | 409,670 | $61,010 | +10.9% | 6.3% | HVAC business guide |
| Carpenters | Low | 670,090 | $60,580 | +3.9% | 25.1% | — |
| Painters (construction & maintenance) | Low | 225,190 | $49,400 | +3.0% | 31.3% | — |
| Roofers | Low | 135,490 | $55,440 | +5.3% | 19.8% | — |
| Auto service technicians & mechanics | Moderate | 704,640 | $50,620 | +5.0% | 14.6% | — |
| General maintenance & repair workers | Low | 1,529,700 | $49,590 | +4.2% | 0.9% | — |
| Outdoor and cleaning work | ||||||
| Landscaping & groundskeeping workers | Low | 952,640 | $39,150 | +4.7% | 20.2% | Landscaping business guide |
| Tree trimmers & pruners | Low | 55,160 | $50,960 | +4.2% | 24.4% | Tree service guide |
| Pest control workers | Moderate | 102,620 | $45,250 | +5.5% | 5.4% | — |
| Janitors & cleaners | Low | 2,209,760 | $36,840 | +2.2% | 4.8% | Cleaning business guide |
| Maids & housekeeping cleaners | Low | 860,670 | $35,510 | +0.6% | 13.7% | Cleaning business guide |
| Personal services | ||||||
| Childcare workers | Moderate | 518,910 | $34,980 | -2.0% | 24.2% | Daycare guide |
| Preschool teachers | Moderate | 478,780 | $38,140 | +4.5% | 0.9% | Daycare guide |
| Hairdressers, hairstylists & cosmetologists | Moderate | 305,710 | $35,790 | +7.7% | 48.1% | Hair salon guide |
| Barbers | Moderate | 15,000 | $38,210 | +3.3% | 79.9% | Hair salon guide |
| Massage therapists | Low | 98,790 | $58,450 | +15.3% | 35.6% | Massage business guide |
| Animal caretakers (groomers, pet sitters) | Moderate | 266,910 | $35,360 | +12.1% | 24.8% | — |
| Food | ||||||
| Cooks, restaurant | Moderate | 1,409,890 | $37,390 | +12.1% | — | Food truck guide |
| For comparison: common desk jobs in small firms | ||||||
| Bookkeeping, accounting & auditing clerks | Very high | 1,373,680 | $50,670 | -5.6% | 5.6% | — |
| Tax preparers | Very high | 76,480 | $54,920 | +4.7% | 17.6% | — |
| Secretaries & admin assistants | Very high | 1,706,790 | $47,540 | -6.0% | 1.5% | — |
| Customer service representatives | Very high | 2,595,750 | $44,770 | -5.3% | 0.5% | — |
| Graphic designers | Very high | 197,830 | $62,960 | -1.7% | 20.5% | — |
| Interpreters & translators | Very high | 52,060 | $60,170 | +2.0% | 27.6% | — |
| Paralegals & legal assistants | High | 392,880 | $62,890 | -0.3% | 2.1% | — |
| Insurance sales agents | Very high | 479,100 | $62,280 | +3.3% | 11.8% | — |
| Private detectives & investigators | High | 35,580 | $51,220 | +5.5% | 9.8% | PI business guide |
Job counts and pay: BLS OEWS, May 2025 (employees only; the self-employed aren’t counted). Growth and self-employed share: BLS Employment Projections 2025–35. “—” = not published.
For how common these trades are in each state, see our trade labor density by state study. For how trade job postings compare with tech postings, see trade jobs vs. tech jobs since ChatGPT.
Exposure and pay
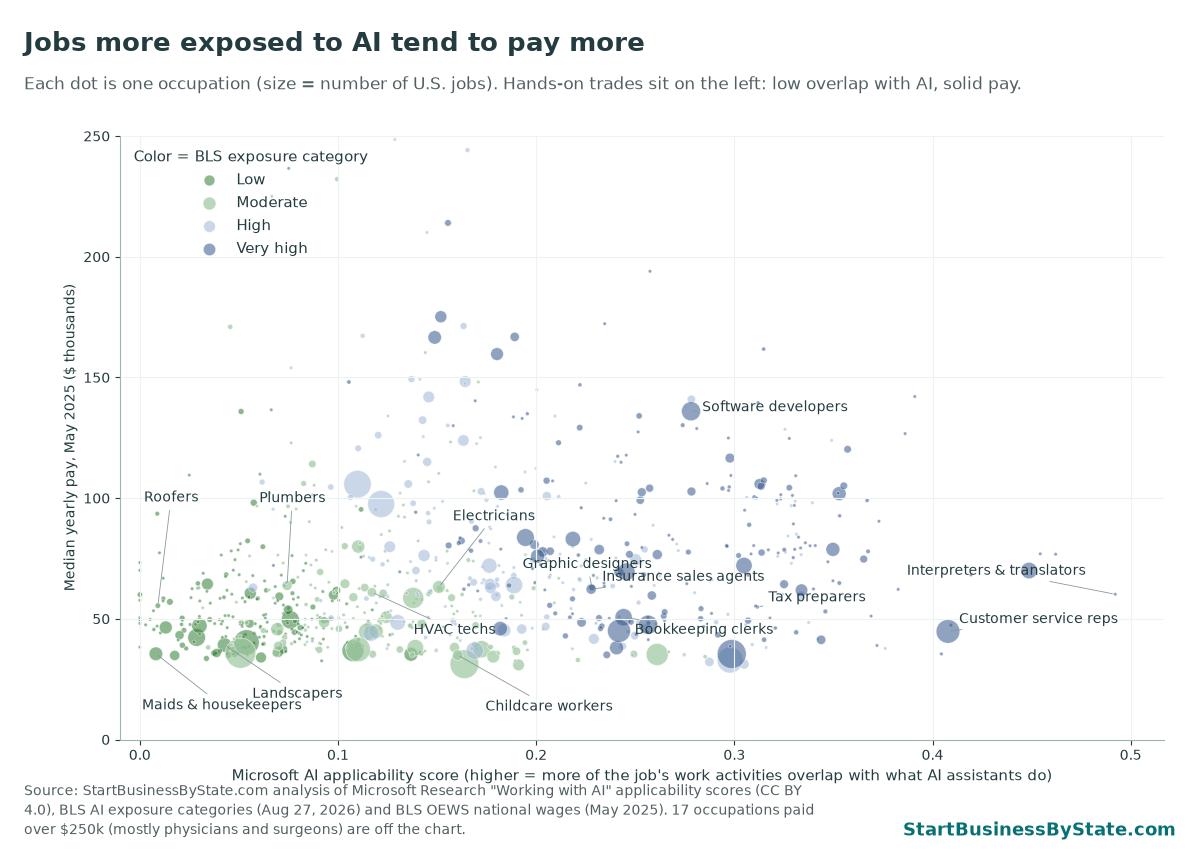
AI chatbots are mostly good at reading, writing, summarizing and answering questions. That’s a big part of many well-paid office jobs, so higher-exposure jobs tend to pay more. Lower-paid service jobs, like maids ($35,510) and childcare workers ($34,980), sit at the low-exposure end.
The skilled trades stand out on this chart: little AI overlap and pay in the $60,000s. The median electrician earned $63,190 in May 2025.
Do other AI measures agree?
There’s no single right way to measure AI exposure, so we checked the BLS ranking against two other measures:
- Microsoft’s AI applicability score (Microsoft Research, “Working with AI,” 2025). It is based on what people asked Microsoft’s Bing Copilot to help with, and how well it did. It is scored from 0 to 1.
- Anthropic’s observed exposure (Anthropic Economic Index, 2026). It is based on how people use Claude for work tasks. It gives extra weight to tasks where AI does the work rather than helps.
For each state we averaged each score across all jobs, weighting by how many people hold each job. Then we ranked the states.
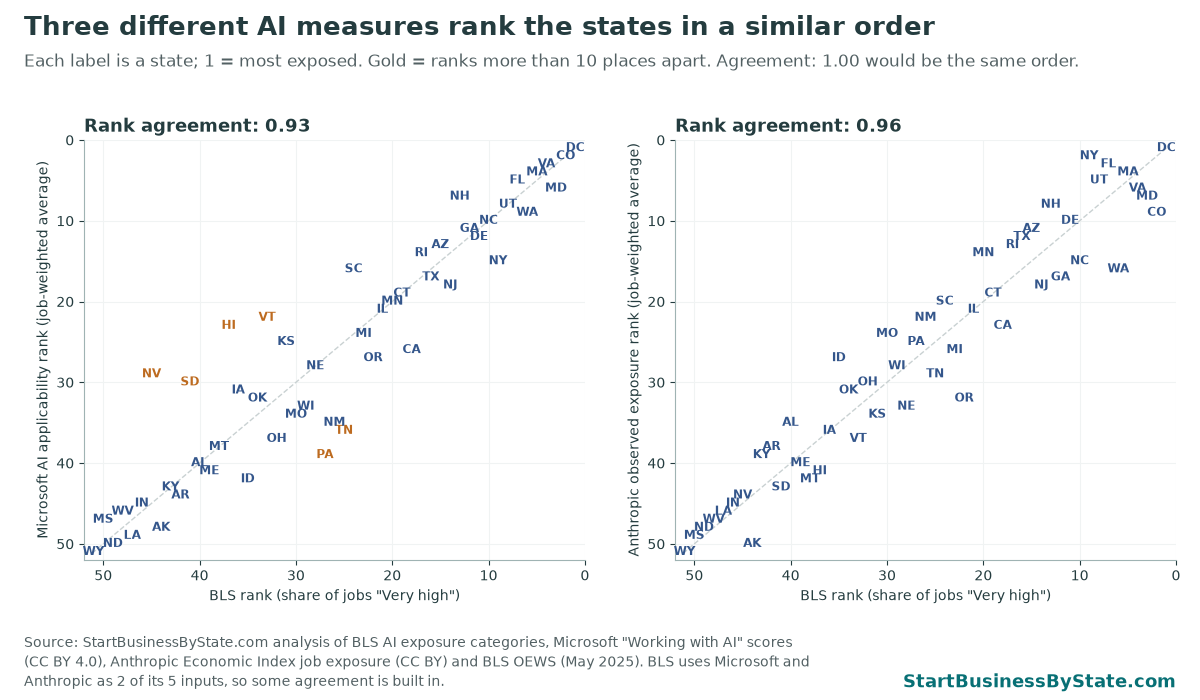
The rankings line up well. D.C. is #1 and Wyoming #51 on all three. The biggest gaps: Nevada, South Dakota, Hawaii and Vermont rank higher on Microsoft’s measure than on BLS’s. New York ranks #2 on Anthropic’s measure but #9 on BLS’s.
One honest caveat: BLS uses Microsoft’s and Anthropic’s data as 2 of its 5 inputs, so some agreement is built in. The two company measures also disagree more on single jobs than on states. Across 800 occupations their rank correlation is 0.58. State totals smooth those differences out.
On the question that matters most here, they agree fully. None of the jobs BLS rates “Low” lands in the most-exposed group on either company’s measure. We defined that group as the top-scoring jobs that together hold the same 31.7% share of U.S. jobs as BLS’s “Very high” group.
AI exposure in every state
Click a column heading to sort. State names link to our guides for starting a business in each state. Download the full data (CSV).
| Rank | State | Very high | High | Moderate | Low | Very high jobs | Low jobs | Jobs matched | Microsoft rank | Anthropic rank |
|---|---|---|---|---|---|---|---|---|---|---|
| 1 | District of Columbia | 48.9% | 26.0% | 16.0% | 9.1% | 334,740 | 62,060 | 97.5% | 1 | 1 |
| 2 | Colorado | 36.4% | 24.2% | 24.3% | 15.2% | 1,037,680 | 434,090 | 99.3% | 2 | 9 |
| 3 | Maryland | 36.1% | 26.5% | 22.2% | 15.2% | 982,910 | 414,600 | 98.5% | 6 | 7 |
| 4 | Virginia | 35.8% | 24.3% | 23.7% | 16.2% | 1,453,170 | 658,010 | 98.8% | 3 | 6 |
| 5 | Massachusetts | 35.3% | 26.4% | 24.0% | 14.4% | 1,263,380 | 513,850 | 98.4% | 4 | 4 |
| 6 | Washington | 34.8% | 22.8% | 25.2% | 17.2% | 1,221,670 | 603,550 | 98.7% | 9 | 16 |
| 7 | Florida | 34.3% | 23.7% | 24.2% | 17.8% | 3,362,830 | 1,750,420 | 98.9% | 5 | 3 |
| 8 | Utah | 34.2% | 23.8% | 23.6% | 18.4% | 581,370 | 313,350 | 98.0% | 8 | 5 |
| 9 | New York | 34.1% | 24.4% | 26.4% | 15.1% | 3,285,550 | 1,458,130 | 99.5% | 15 | 2 |
| 10 | North Carolina | 33.1% | 23.4% | 25.1% | 18.4% | 1,627,090 | 906,000 | 99.5% | 10 | 15 |
| 11 | Delaware | 32.9% | 24.5% | 26.2% | 16.3% | 153,630 | 76,290 | 96.3% | 12 | 10 |
| 12 | Georgia | 32.8% | 24.2% | 25.4% | 17.6% | 1,585,590 | 852,070 | 99.0% | 11 | 17 |
| 13 | New Hampshire | 32.7% | 27.1% | 24.2% | 16.1% | 220,270 | 108,410 | 98.7% | 7 | 8 |
| 14 | New Jersey | 32.6% | 26.1% | 23.9% | 17.4% | 1,388,080 | 740,540 | 99.3% | 18 | 18 |
| 15 | Arizona | 32.4% | 24.3% | 25.6% | 17.7% | 1,037,580 | 565,850 | 98.9% | 13 | 11 |
| 16 | Texas | 32.4% | 25.2% | 25.8% | 16.7% | 4,546,430 | 2,342,310 | 99.8% | 17 | 12 |
| 17 | Rhode Island | 31.8% | 25.8% | 24.8% | 17.7% | 149,910 | 83,450 | 94.2% | 14 | 13 |
| 18 | California | 31.7% | 23.9% | 27.2% | 17.2% | 5,757,260 | 3,122,880 | 99.6% | 26 | 23 |
| 19 | Connecticut | 31.6% | 27.1% | 25.7% | 15.6% | 526,060 | 258,920 | 98.0% | 19 | 19 |
| 20 | Minnesota | 31.6% | 24.8% | 26.9% | 16.8% | 926,890 | 493,090 | 99.5% | 20 | 14 |
| 21 | Illinois | 30.6% | 25.9% | 25.2% | 18.4% | 1,855,620 | 1,112,870 | 99.4% | 21 | 21 |
| 22 | Oregon | 30.6% | 24.6% | 26.7% | 18.1% | 596,540 | 354,050 | 99.2% | 27 | 32 |
| 23 | Michigan | 30.5% | 24.3% | 27.4% | 17.8% | 1,338,490 | 780,120 | 99.5% | 24 | 26 |
| 24 | South Carolina | 30.4% | 24.1% | 26.6% | 18.9% | 696,280 | 433,440 | 99.3% | 16 | 20 |
| 25 | Tennessee | 30.0% | 23.3% | 27.2% | 19.5% | 980,710 | 636,430 | 99.6% | 36 | 29 |
| 26 | New Mexico | 29.7% | 24.8% | 27.1% | 18.3% | 255,690 | 157,720 | 98.8% | 35 | 22 |
| 27 | Pennsylvania | 29.7% | 25.5% | 27.1% | 17.7% | 1,797,530 | 1,072,900 | 99.9% | 39 | 25 |
| 28 | Nebraska | 29.6% | 25.3% | 25.6% | 19.4% | 300,010 | 196,710 | 98.8% | 28 | 33 |
| 29 | Wisconsin | 29.3% | 23.2% | 27.8% | 19.7% | 856,120 | 573,610 | 99.2% | 33 | 28 |
| 30 | Missouri | 29.1% | 26.0% | 27.1% | 17.7% | 846,580 | 515,110 | 99.0% | 34 | 24 |
| 31 | Kansas | 29.1% | 25.0% | 26.6% | 19.2% | 414,110 | 273,690 | 98.9% | 25 | 34 |
| 32 | Ohio | 29.0% | 25.9% | 26.7% | 18.4% | 1,607,340 | 1,019,250 | 99.7% | 37 | 30 |
| 33 | Vermont | 28.8% | 30.1% | 23.9% | 17.3% | 83,560 | 50,050 | 95.4% | 22 | 37 |
| 34 | Oklahoma | 28.8% | 25.4% | 25.4% | 20.5% | 489,360 | 348,180 | 99.6% | 32 | 31 |
| 35 | Idaho | 28.4% | 24.8% | 26.4% | 20.4% | 239,960 | 171,880 | 98.5% | 42 | 27 |
| 36 | Iowa | 28.2% | 25.2% | 27.6% | 19.0% | 437,830 | 294,760 | 99.4% | 31 | 36 |
| 37 | Hawaii | 28.1% | 26.6% | 26.2% | 19.1% | 171,040 | 116,110 | 97.1% | 23 | 41 |
| 38 | Montana | 28.0% | 27.0% | 26.2% | 18.7% | 140,510 | 93,980 | 98.0% | 38 | 42 |
| 39 | Maine | 28.0% | 26.4% | 26.5% | 19.1% | 175,520 | 119,680 | 97.8% | 41 | 40 |
| 40 | Alabama | 28.0% | 24.4% | 27.6% | 20.1% | 580,940 | 416,620 | 98.2% | 40 | 35 |
| 41 | South Dakota | 27.5% | 24.9% | 25.8% | 21.7% | 124,680 | 98,530 | 99.1% | 30 | 43 |
| 42 | Arkansas | 27.4% | 25.2% | 27.5% | 19.9% | 353,320 | 257,440 | 99.1% | 44 | 38 |
| 43 | Kentucky | 27.1% | 25.0% | 28.0% | 19.8% | 539,470 | 394,260 | 99.4% | 43 | 39 |
| 44 | Alaska | 26.9% | 28.6% | 24.6% | 19.9% | 85,420 | 63,000 | 97.4% | 48 | 50 |
| 45 | Nevada | 26.2% | 23.4% | 29.8% | 20.6% | 401,860 | 315,710 | 98.8% | 29 | 44 |
| 46 | Indiana | 26.2% | 23.7% | 28.9% | 21.2% | 834,010 | 677,120 | 99.6% | 45 | 45 |
| 47 | Louisiana | 26.0% | 25.4% | 27.2% | 21.3% | 499,390 | 409,460 | 99.1% | 49 | 46 |
| 48 | West Virginia | 25.5% | 27.4% | 27.4% | 19.7% | 176,970 | 136,820 | 99.0% | 46 | 47 |
| 49 | North Dakota | 25.3% | 25.3% | 28.0% | 21.5% | 106,670 | 90,830 | 98.4% | 50 | 48 |
| 50 | Mississippi | 24.9% | 24.6% | 28.1% | 22.3% | 284,540 | 254,270 | 98.1% | 47 | 49 |
| 51 | Wyoming | 24.6% | 26.4% | 26.9% | 22.1% | 67,140 | 60,370 | 97.2% | 51 | 51 |
| — | United States | 31.7% | 24.7% | 26.0% | 17.6% | 49,233,970 | 27,442,170 | 100.0% | — | — |
Shares are of each state’s jobs that could be matched to a BLS category. “Jobs matched” is that share of all jobs in the state. The rest are small job counts BLS doesn’t publish. Rank 1 = highest “Very high” share. Microsoft and Anthropic ranks use job-weighted average scores.
What this means if you’re starting a business
For a practical path from trade experience to business ownership, see our guide to plumbing contractor business setup, including qualifications, insurance, pricing and customers.
Wyoming electrical business owners. Lower measured AI exposure does not remove the need for trade qualification or establish local demand. Our guide to starting an electrical business in Wyoming covers the master of record, contractor license, state workers’ compensation registration and permits needed to turn trade experience into an operating business.
South Carolina electrical startups. Hands-on work still needs a qualified business behind it. Our guide to starting an electrical business in South Carolina explains the residential and commercial licensing routes, coverage, local approvals and cash planning before taking customers.
For a practical path from trade experience to business ownership, see our guide to electrical contractor business setup, including qualifications, insurance, pricing and customers.
In Georgia, turn that trade-business idea into a practical checklist with our guide to starting an electrical business in Georgia, covering the current license classes, insurance, registration and first-job preparations.
- Hands-on work is the safer bet for now. If a customer needs you on site, AI can help you run the business but can’t do the job. Trades and personal services all sit in BLS’s two lower groups.
- Use AI for the office side. Quotes, invoices, scheduling, reviews and marketing are the “exposed” parts of almost any small business. That’s where AI tools can save you time. Construction firms are picking it up faster than any other industry; see small-business AI use by industry.
- In high-exposure places, more businesses already use AI. D.C. and Colorado, #1 and #2 here, rank #2 and #4 of 49 for business AI use (30.7% and 28.1% of businesses in recent Census surveys). Expect competitors there to use AI for quotes, ads and customer messages.
- Look at local demand, not just the label. A “Low” exposure job still needs customers. Check how many workers and businesses your state already has in our trade labor density data before you pick a trade.
- Where AI gets built is a different map. California, Washington and Massachusetts lead for AI patents per resident. See AI patents by state.
- It can’t tell you which jobs will disappear. BLS says exposure is not job loss, lower pay or automation.
- The AI measures describe tools as of 2023–2025. AI changes fast, and robots for physical work aren’t included.
- Job counts are wage and salary jobs from May 2025. Self-employed owners aren’t counted, and many trade and salon workers are self-employed.
- Exposure labels are national. An electrician in Ohio gets the same label as one in Oregon, even if the work differs.
- Anthropic’s measure reflects how people use Claude, and Microsoft’s reflects Bing Copilot. Neither covers all AI use.
Cite or share this data
Journalists, researchers and educators are welcome to use these numbers with a link back to this page.
Source: StartBusinessByState.com analysis of BLS AI exposure categories (Aug. 2026) and BLS OEWS employment by state (May 2025). https://startbusinessbystate.com/ai-proof-jobs-by-state/
Embed the map:
<a href=”https://startbusinessbystate.com/ai-proof-jobs-by-state/”><img src=”https://startbusinessbystate.com/wp-content/uploads/2026/09/ai-exposed-jobs-map.png” alt=”Share of jobs highly exposed to AI by state” width=”1200″></a><br>Source: StartBusinessByState.com analysis of BLS data
Methodology and sources
- Jobs by occupation and state. BLS Occupational Employment and Wage Statistics (OEWS), May 2025 state and national files. We used the 830 detailed occupations for the 50 states and D.C. (155,495,730 jobs nationwide). OEWS counts wage and salary jobs. It leaves out the self-employed.
- Primary measure: BLS AI exposure categories. From BLS’s AI exposure categories table (published August 27, 2026), which labels 831 occupations Low, Moderate, High or Very high. BLS uses the same occupation codes as OEWS, so we matched on the exact 6-digit code. All 830 OEWS occupations matched. (One BLS occupation, fishers, isn’t in OEWS.)
- State shares. For each state we added up jobs in each category and divided by the state’s matched jobs. BLS doesn’t publish some small state counts to protect privacy, so matched jobs cover 94.2% (RI) to 99.9% (PA) of each state’s jobs (median 98.9%). Dividing by all jobs instead gives almost the same ranking (rank correlation 0.99).
- Cross-checks. Microsoft’s AI applicability scores (v1.1, CC BY 4.0) and Anthropic’s Economic Index job exposure (CC BY). We matched exact codes first. Where OEWS reports a combined or “all other” occupation the source doesn’t score, we used the average score of the source’s occupations in the same SOC broad group. That covers 99.4% of U.S. jobs for Microsoft and 93.9% for Anthropic. Anthropic’s file has no score for some large jobs, including home health and personal care aides, so its state averages leave those jobs out.
- Pay and growth. Median pay is from OEWS May 2025. Projected growth and self-employed shares are from BLS Employment Projections 2025–35, published with the AI exposure table.
- Business AI use. From our small-business AI use by state page: the Census Bureau’s Business Trends and Outlook Survey, average of the three surveys from July 27 to September 6, 2026.
All scripts and raw files are saved so the numbers can be rebuilt. We didn’t adjust or re-weight any source. This page won’t update automatically; BLS publishes new OEWS figures once a year.
FAQ
Which state has the most jobs exposed to AI?
D.C., where 48.9% of jobs are in occupations BLS rates “Very high.” Among states, Colorado (36.4%), Maryland (36.1%) and Virginia (35.8%) lead.
Which state has the fewest?
Wyoming (24.6%), then Mississippi (24.9%) and North Dakota (25.3%).
Does “exposed to AI” mean the job will be replaced?
No. BLS says exposure does not mean job loss, lower pay or automation. It means AI tools overlap with some of the job’s tasks. Many exposed workers will use AI as a tool.
What jobs are AI-proof?
None for sure. The least exposed are hands-on jobs: roofers, carpenters, painters, landscapers, tree trimmers, janitors, maids and massage therapists are all rated “Low.” Electricians, plumbers, HVAC techs, hairstylists and childcare workers are “Moderate.”
Why are electricians and plumbers “Moderate” and not “Low”?
Part of their work is paperwork, estimating, code lookups and troubleshooting, which AI can help with. The core of the job is still physical. BLS projects both to grow faster than average.
Are self-employed workers included?
Not in the state job counts. OEWS covers employees only. That matters for trades and salons, where many people work for themselves.
Related research: Small-business AI use by state · Trade jobs vs. tech jobs since ChatGPT · Trade labor density by state · Data center boom by state