Original research · U.S. Energy Information Administration weekly fuel prices · Updated September 30, 2026
Data through: the EIA survey for the week of September 28, 2026 (released Sep 29, 2026). Next EIA release: Oct 6, 2026.
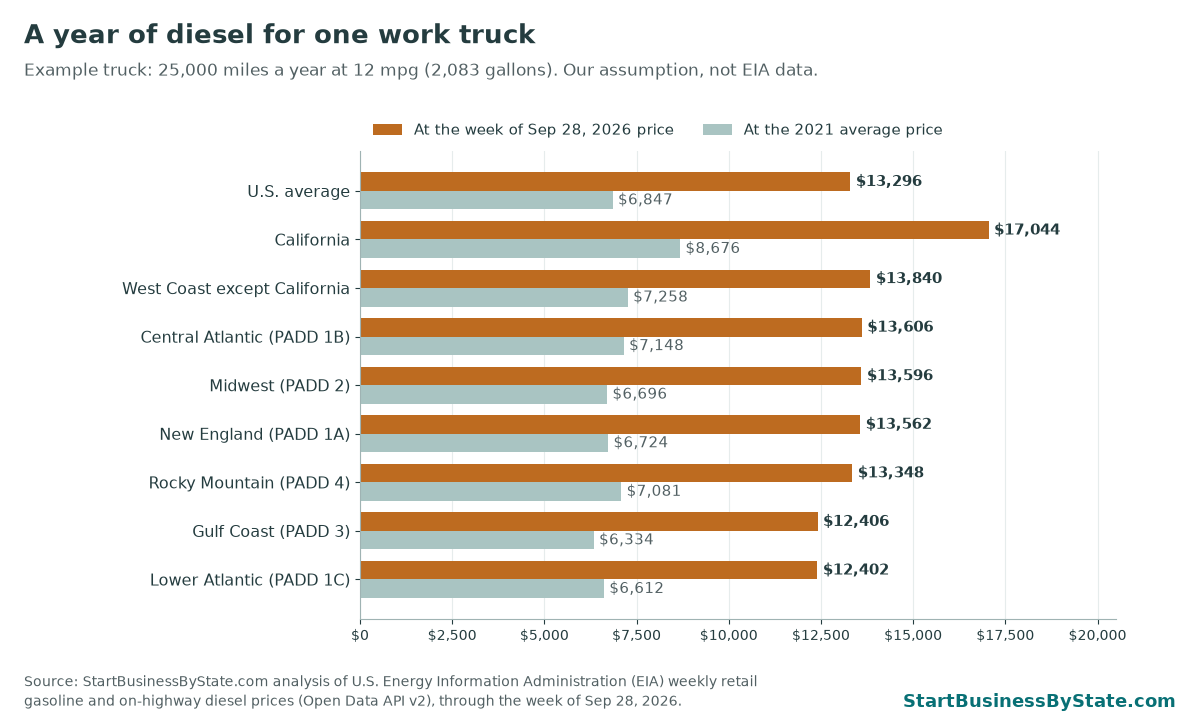
Diesel eased off its record high. The U.S. average for on-highway diesel was $6.38 a gallon the week of Sep 28, 2026, down from the $6.53 record set the week of Sep 21, 2026. EIA’s weekly records go back to 1994. Diesel is still 9.8% above the June 2022 peak of $5.81. Regular gas was $4.46. Diesel is up $2.63 from a year ago, and gas is up $1.35. At this week’s price, one diesel work truck driven 25,000 miles a year would burn about $13,296 in fuel, compared with $6,847 at 2021 prices.
Key findings
- Diesel is $0.15 below its record. $6.38 a gallon for the U.S. the week of Sep 28, 2026, down from last week’s record of $6.53 and up from $3.75 a year earlier. Before 2026, the high was $5.81 on June 20, 2022. These prices are not adjusted for inflation.
- Most of the jump came this summer. Diesel was $5.35 on June 1, 2026. It rose $1.03 (19.3%) in under four months. The 2026 low was $3.46 in January.
- Diesel costs $1.92 more than gas right now. In 2021 the gap averaged $0.28. Diesel trucks are taking the bigger hit.
- California pays the most. The Lower Atlantic pays the least. California diesel was $8.18. Among the seven main EIA regions, the West Coast was highest at $7.36 and the Lower Atlantic (Florida to West Virginia) lowest at $5.95. The Midwest ($6.53) is now above the national average.
- A year of fuel for one work truck is about $6,448 higher than at 2021 prices. That’s for our example diesel truck (25,000 miles, 12 mpg) at the U.S. price. For a gas pickup (20,000 miles, 15 mpg) the gap is $1,943. For a long-haul semi, it’s $47,619.
- EIA does not publish a diesel price for each state. It publishes diesel only for regions (the East Coast and its three parts, the Midwest, Gulf Coast, Rocky Mountain states and West Coast) and for California. It publishes regular gas for 9 states and 10 cities. For the other states, the table below shows the price for the region the state belongs to. We did not make up state prices.
Diesel and gas prices since 2021
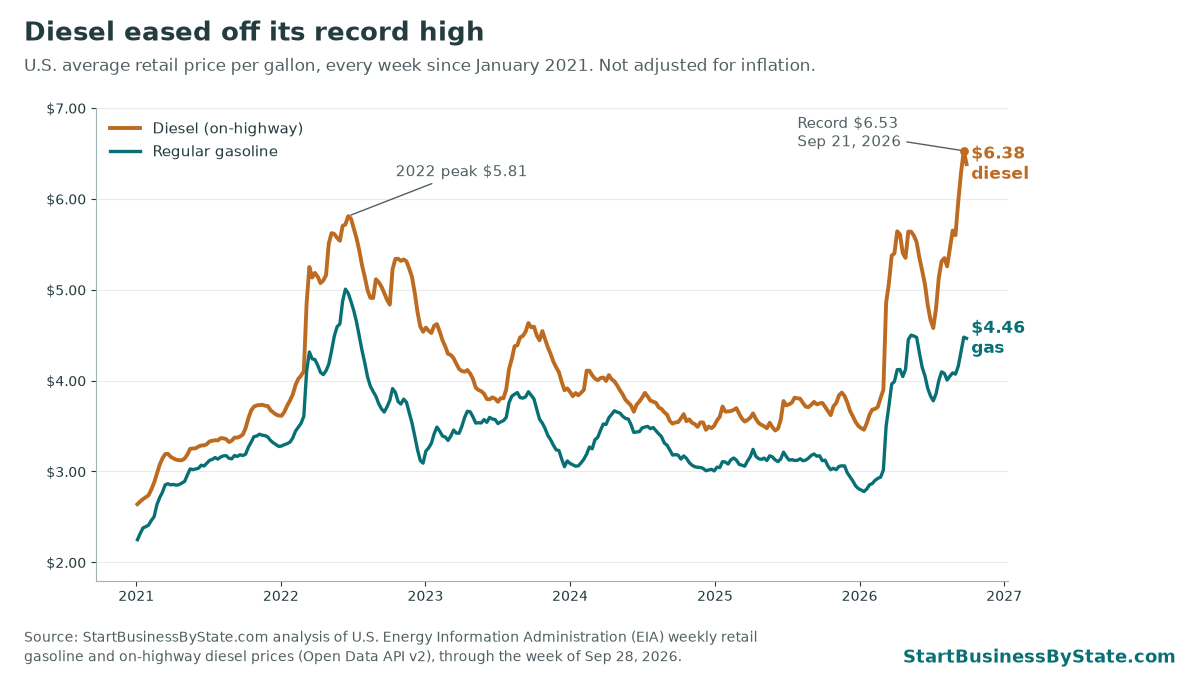
Prices climbed in 2021 and spiked in 2022. Diesel peaked at $5.81 and gas at $5.01 in June 2022. Both then fell for three years. Diesel averaged $3.66 in 2025, and gas averaged $3.10.
2026 is different. Diesel has averaged $5.01 so far this year and gas $3.82. Gas is still below its 2022 record. Diesel is not.
| Region | Diesel, week of Sep 28, 2026 | Diesel vs. Sep 29, 2025 | Diesel 2021 avg. | Diesel 2022 avg. | Diesel 2025 avg. | Regular gas, week of Sep 28, 2026 | Gas vs. Sep 29, 2025 | Gas 2021 avg. | |
|---|---|---|---|---|---|---|---|---|---|
| U.S. average | $6.38 | +$2.63 | $3.29 | $4.99 | $3.66 | $4.46 | +$1.35 | $3.01 | |
| New England (PADD 1A) | $6.51 | +$2.55 | $3.23 | $5.27 | $3.96 | $4.37 | +$1.33 | $2.96 | |
| Central Atlantic (PADD 1B) | $6.53 | +$2.63 | $3.43 | $5.35 | $3.90 | $4.41 | +$1.26 | $3.07 | |
| Lower Atlantic (PADD 1C) | $5.95 | +$2.28 | $3.17 | $4.92 | $3.62 | $4.20 | +$1.33 | $2.83 | |
| Midwest (PADD 2) | $6.53 | +$2.79 | $3.21 | $4.90 | $3.62 | $4.29 | +$1.36 | $2.89 | |
| Gulf Coast (PADD 3) | $5.96 | +$2.54 | $3.04 | $4.68 | $3.33 | $3.92 | +$1.25 | $2.69 | |
| Rocky Mountain (PADD 4) | $6.41 | +$2.67 | $3.40 | $4.97 | $3.58 | $4.49 | +$1.38 | $3.18 | |
| West Coast (PADD 5) | $7.36 | +$2.83 | $3.85 | $5.62 | $4.37 | $5.72 | +$1.49 | $3.70 | |
| West Coast except California | $6.64 | +$2.50 | $3.48 | $5.21 | $3.95 | $5.15 | +$1.14 | $3.34 | |
| California | $8.18 | +$3.20 | $4.16 | $6.03 | $4.85 | $6.19 | +$1.74 | $4.01 |
Dollars per gallon, including taxes. PADD = the regions EIA uses for fuel data. “West Coast except California” is the diesel price EIA publishes for Alaska, Arizona, Hawaii, Nevada, Oregon and Washington together.
Diesel prices by region
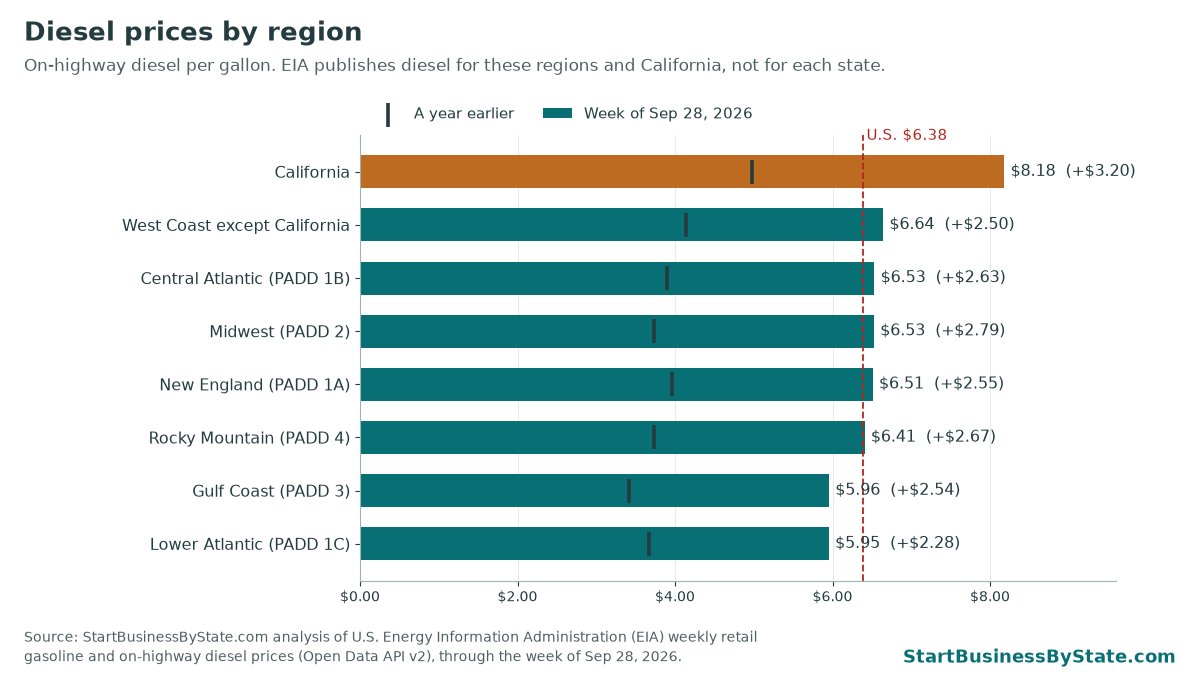
Every region is up at least $2.28 a gallon from a year ago. Only California rose more than the Midwest, which is up $2.79. A gallon of diesel in California costs $2.23 more than on the Gulf Coast.
What a year of fuel costs one trade truck
- Gas work pickup or van: 20,000 miles a year at 15 mpg = 1,333 gallons of regular gas. Think HVAC, plumbing or electrical service calls.
- Diesel heavy-duty pickup or box truck: 25,000 miles a year at 12 mpg = 2,083 gallons of diesel. Think a landscaping crew towing a trailer, or a contractor hauling material.
- Long-haul semi truck: 100,000 miles a year at 6.5 mpg = 15,385 gallons of diesel. Think an owner-operator.
Math: gallons × price per gallon. “At this week’s price” means every gallon for a full year costs what it did the week of Sep 28, 2026.
| Region | Gas pickup, 1 year at this week’s price | Diesel work truck, 1 year at this week’s price | Same diesel truck at 2021 avg. price | Extra per diesel truck vs. 2021 | Long-haul semi, 1 year at this week’s price |
|---|---|---|---|---|---|
| U.S. average | $5,953 | $13,296 | $6,847 | +$6,448 | $98,185 |
| New England (PADD 1A) | $5,825 | $13,562 | $6,724 | +$6,838 | $100,154 |
| Central Atlantic (PADD 1B) | $5,881 | $13,606 | $7,148 | +$6,458 | $100,477 |
| Lower Atlantic (PADD 1C) | $5,593 | $12,402 | $6,612 | +$5,790 | $91,585 |
| Midwest (PADD 2) | $5,721 | $13,596 | $6,696 | +$6,900 | $100,400 |
| Gulf Coast (PADD 3) | $5,232 | $12,406 | $6,334 | +$6,072 | $91,615 |
| Rocky Mountain (PADD 4) | $5,981 | $13,348 | $7,081 | +$6,267 | $98,569 |
| West Coast except California | $6,871 | $13,840 | $7,258 | +$6,581 | $102,200 |
| California | $8,252 | $17,044 | $8,676 | +$8,368 | $125,862 |
Prices won’t stay at one week’s level for a year. Over the past 52 weeks, diesel averaged $4.68 for the U.S. At that price, the same diesel truck used $9,755 of fuel and the gas pickup used $4,820. The full numbers for every region are in the CSV.
If you run three diesel crew trucks, multiply by three. A $1.00 rise in diesel adds about $2,083 a year to each of our example diesel trucks.
Diesel and gas prices for every state
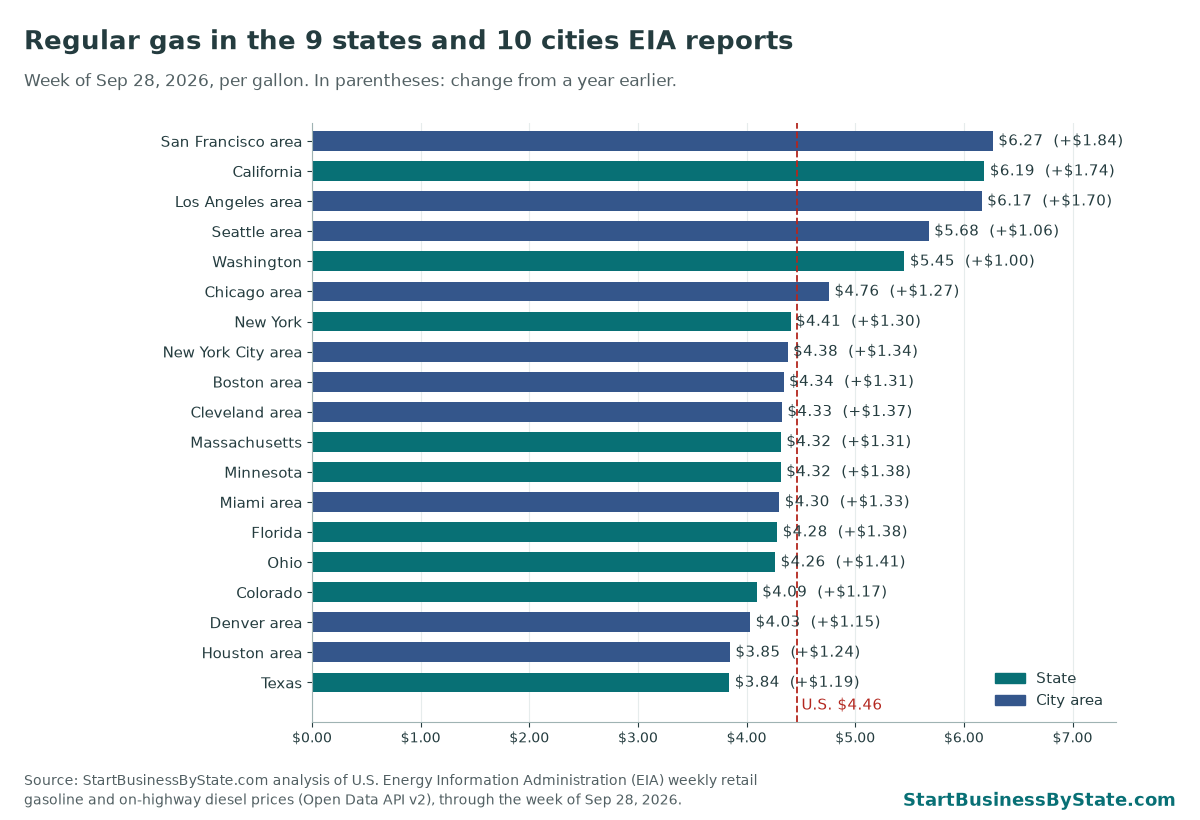
Here’s how to read this table. EIA surveys fuel prices by region. For diesel, it publishes a price for each region and for California. For regular gas, it also publishes 9 states: California $6.19, Washington $5.45, New York $4.41, Massachusetts $4.32, Minnesota $4.32, Florida $4.28, Ohio $4.26, Colorado $4.09, Texas $3.84. Every other state shows its region’s price, marked “region.” Two neighbors in the same region will show the same number, even though real pump prices differ.
| State | EIA region | Diesel, week of Sep 28, 2026 | Diesel vs. year ago | Regular gas, week of Sep 28, 2026 | Gas vs. year ago | Diesel work truck, 1 year* | Gas pickup, 1 year* |
|---|---|---|---|---|---|---|---|
| Alabama | Gulf Coast <span class="muted">(PADD 3)</span> | $5.96 region | +$2.54 | $3.92 region | +$1.25 | $12,406 | $5,232 |
| Alaska | West Coast <span class="muted">(PADD 5)</span> | $6.64 region | +$2.50 | $5.72 region | +$1.49 | $13,840 | $7,632 |
| Arizona | West Coast <span class="muted">(PADD 5)</span> | $6.64 region | +$2.50 | $5.72 region | +$1.49 | $13,840 | $7,632 |
| Arkansas | Gulf Coast <span class="muted">(PADD 3)</span> | $5.96 region | +$2.54 | $3.92 region | +$1.25 | $12,406 | $5,232 |
| California | West Coast <span class="muted">(PADD 5)</span> | $8.18 state | +$3.20 | $6.19 state | +$1.74 | $17,044 | $8,252 |
| Colorado | Rocky Mountain <span class="muted">(PADD 4)</span> | $6.41 region | +$2.67 | $4.09 state | +$1.17 | $13,348 | $5,459 |
| Connecticut | New England <span class="muted">(PADD 1A)</span> | $6.51 region | +$2.55 | $4.37 region | +$1.33 | $13,562 | $5,825 |
| Delaware | Central Atlantic <span class="muted">(PADD 1B)</span> | $6.53 region | +$2.63 | $4.41 region | +$1.26 | $13,606 | $5,881 |
| District of Columbia | Central Atlantic <span class="muted">(PADD 1B)</span> | $6.53 region | +$2.63 | $4.41 region | +$1.26 | $13,606 | $5,881 |
| Florida | Lower Atlantic <span class="muted">(PADD 1C)</span> | $5.95 region | +$2.28 | $4.28 state | +$1.38 | $12,402 | $5,709 |
| Georgia | Lower Atlantic <span class="muted">(PADD 1C)</span> | $5.95 region | +$2.28 | $4.20 region | +$1.33 | $12,402 | $5,593 |
| Hawaii | West Coast <span class="muted">(PADD 5)</span> | $6.64 region | +$2.50 | $5.72 region | +$1.49 | $13,840 | $7,632 |
| Idaho | Rocky Mountain <span class="muted">(PADD 4)</span> | $6.41 region | +$2.67 | $4.49 region | +$1.38 | $13,348 | $5,981 |
| Illinois | Midwest <span class="muted">(PADD 2)</span> | $6.53 region | +$2.79 | $4.29 region | +$1.36 | $13,596 | $5,721 |
| Indiana | Midwest <span class="muted">(PADD 2)</span> | $6.53 region | +$2.79 | $4.29 region | +$1.36 | $13,596 | $5,721 |
| Iowa | Midwest <span class="muted">(PADD 2)</span> | $6.53 region | +$2.79 | $4.29 region | +$1.36 | $13,596 | $5,721 |
| Kansas | Midwest <span class="muted">(PADD 2)</span> | $6.53 region | +$2.79 | $4.29 region | +$1.36 | $13,596 | $5,721 |
| Kentucky | Midwest <span class="muted">(PADD 2)</span> | $6.53 region | +$2.79 | $4.29 region | +$1.36 | $13,596 | $5,721 |
| Louisiana | Gulf Coast <span class="muted">(PADD 3)</span> | $5.96 region | +$2.54 | $3.92 region | +$1.25 | $12,406 | $5,232 |
| Maine | New England <span class="muted">(PADD 1A)</span> | $6.51 region | +$2.55 | $4.37 region | +$1.33 | $13,562 | $5,825 |
| Maryland | Central Atlantic <span class="muted">(PADD 1B)</span> | $6.53 region | +$2.63 | $4.41 region | +$1.26 | $13,606 | $5,881 |
| Massachusetts | New England <span class="muted">(PADD 1A)</span> | $6.51 region | +$2.55 | $4.32 state | +$1.31 | $13,562 | $5,755 |
| Michigan | Midwest <span class="muted">(PADD 2)</span> | $6.53 region | +$2.79 | $4.29 region | +$1.36 | $13,596 | $5,721 |
| Minnesota | Midwest <span class="muted">(PADD 2)</span> | $6.53 region | +$2.79 | $4.32 state | +$1.38 | $13,596 | $5,753 |
| Mississippi | Gulf Coast <span class="muted">(PADD 3)</span> | $5.96 region | +$2.54 | $3.92 region | +$1.25 | $12,406 | $5,232 |
| Missouri | Midwest <span class="muted">(PADD 2)</span> | $6.53 region | +$2.79 | $4.29 region | +$1.36 | $13,596 | $5,721 |
| Montana | Rocky Mountain <span class="muted">(PADD 4)</span> | $6.41 region | +$2.67 | $4.49 region | +$1.38 | $13,348 | $5,981 |
| Nebraska | Midwest <span class="muted">(PADD 2)</span> | $6.53 region | +$2.79 | $4.29 region | +$1.36 | $13,596 | $5,721 |
| Nevada | West Coast <span class="muted">(PADD 5)</span> | $6.64 region | +$2.50 | $5.72 region | +$1.49 | $13,840 | $7,632 |
| New Hampshire | New England <span class="muted">(PADD 1A)</span> | $6.51 region | +$2.55 | $4.37 region | +$1.33 | $13,562 | $5,825 |
| New Jersey | Central Atlantic <span class="muted">(PADD 1B)</span> | $6.53 region | +$2.63 | $4.41 region | +$1.26 | $13,606 | $5,881 |
| New Mexico | Gulf Coast <span class="muted">(PADD 3)</span> | $5.96 region | +$2.54 | $3.92 region | +$1.25 | $12,406 | $5,232 |
| New York | Central Atlantic <span class="muted">(PADD 1B)</span> | $6.53 region | +$2.63 | $4.41 state | +$1.30 | $13,606 | $5,873 |
| North Carolina | Lower Atlantic <span class="muted">(PADD 1C)</span> | $5.95 region | +$2.28 | $4.20 region | +$1.33 | $12,402 | $5,593 |
| North Dakota | Midwest <span class="muted">(PADD 2)</span> | $6.53 region | +$2.79 | $4.29 region | +$1.36 | $13,596 | $5,721 |
| Ohio | Midwest <span class="muted">(PADD 2)</span> | $6.53 region | +$2.79 | $4.26 state | +$1.41 | $13,596 | $5,684 |
| Oklahoma | Midwest <span class="muted">(PADD 2)</span> | $6.53 region | +$2.79 | $4.29 region | +$1.36 | $13,596 | $5,721 |
| Oregon | West Coast <span class="muted">(PADD 5)</span> | $6.64 region | +$2.50 | $5.72 region | +$1.49 | $13,840 | $7,632 |
| Pennsylvania | Central Atlantic <span class="muted">(PADD 1B)</span> | $6.53 region | +$2.63 | $4.41 region | +$1.26 | $13,606 | $5,881 |
| Rhode Island | New England <span class="muted">(PADD 1A)</span> | $6.51 region | +$2.55 | $4.37 region | +$1.33 | $13,562 | $5,825 |
| South Carolina | Lower Atlantic <span class="muted">(PADD 1C)</span> | $5.95 region | +$2.28 | $4.20 region | +$1.33 | $12,402 | $5,593 |
| South Dakota | Midwest <span class="muted">(PADD 2)</span> | $6.53 region | +$2.79 | $4.29 region | +$1.36 | $13,596 | $5,721 |
| Tennessee | Midwest <span class="muted">(PADD 2)</span> | $6.53 region | +$2.79 | $4.29 region | +$1.36 | $13,596 | $5,721 |
| Texas | Gulf Coast <span class="muted">(PADD 3)</span> | $5.96 region | +$2.54 | $3.84 state | +$1.19 | $12,406 | $5,121 |
| Utah | Rocky Mountain <span class="muted">(PADD 4)</span> | $6.41 region | +$2.67 | $4.49 region | +$1.38 | $13,348 | $5,981 |
| Vermont | New England <span class="muted">(PADD 1A)</span> | $6.51 region | +$2.55 | $4.37 region | +$1.33 | $13,562 | $5,825 |
| Virginia | Lower Atlantic <span class="muted">(PADD 1C)</span> | $5.95 region | +$2.28 | $4.20 region | +$1.33 | $12,402 | $5,593 |
| Washington | West Coast <span class="muted">(PADD 5)</span> | $6.64 region | +$2.50 | $5.45 state | +$1.00 | $13,840 | $7,271 |
| West Virginia | Lower Atlantic <span class="muted">(PADD 1C)</span> | $5.95 region | +$2.28 | $4.20 region | +$1.33 | $12,402 | $5,593 |
| Wisconsin | Midwest <span class="muted">(PADD 2)</span> | $6.53 region | +$2.79 | $4.29 region | +$1.36 | $13,596 | $5,721 |
| Wyoming | Rocky Mountain <span class="muted">(PADD 4)</span> | $6.41 region | +$2.67 | $4.49 region | +$1.38 | $13,348 | $5,981 |
*At this week’s price, using the example assumptions above. “state” = EIA publishes a price for that state. “region” = the price for the state’s EIA region. For diesel, Alaska, Arizona, Hawaii, Nevada, Oregon and Washington use EIA’s “West Coast except California” price.
What this means for trade businesses
Nevada service territories. A wider service radius adds fuel, unbilled driving and potential return visits to each estimate. Our guide to starting an electrical business in Nevada combines that cash planning with C-2 licensing, contract limits, bonds and residential payment rules.
Electrical service businesses. Count supply-house trips, return visits and travel between customers when budgeting a service van. Our guide to starting an electrical business in Arizona connects that operating budget with contractor licensing, bonds, insurance and job pricing.
- Landscaping. Crews drive every day and tow trailers, so fuel is a real line on every job. Mowers and blowers burn gas too. If you price by the job, check that your quote still covers fuel. Our landscaping job pricing calculator has a line for it. For the size of the industry in your state, see landscaping industry statistics.
- HVAC and plumbing. Service vans run all day between calls. Our example gas pickup costs $5,953 a year at this week’s U.S. price. A trip charge or a line on maintenance agreements can help cover it. For state numbers on the trade, see HVAC industry statistics.
- Contractors. Heavy-duty diesel pickups, dump trucks and equipment all feel the diesel price first. If you bid jobs weeks ahead, the price can move a lot before you start. It went up $1.03 a gallon since June 1.
- Trucking. A long-haul semi burns about 15,385 gallons a year in our example. At this week’s price that’s $98,185. Many freight contracts use a fuel surcharge tied to EIA’s weekly diesel price, and this is the number they use.
For weekly fleet fuel bills by business type, see our fuel costs for mobile service businesses page.
Fuel isn’t the only energy cost going up. Business electricity prices rose in most states this year. See where business electricity costs rose the most.
Methods and sources
- Data. EIA weekly retail prices from the EIA Open Data API v2, route petroleum/pri/gnd. Regular gasoline (all formulations) and on-highway No. 2 diesel, every week from January 4, 2021 to September 28, 2026. We pulled 300 weeks for every area EIA publishes. Full U.S. history (gas since 1990, diesel since 1994) was used for the record check. Pulled September 30, 2026.
- States and regions. EIA groups states into PADD regions (see EIA’s map of states in each region). We matched each state to its region. We used a state’s own price only where EIA publishes one.
- Averages. Yearly averages are simple averages of the weekly prices. “A year ago” is the week of Sep 29, 2025.
- Truck costs. Gallons (miles ÷ mpg) × price. The miles and mpg are our examples, not measured costs. They leave out idling, equipment and generators.
- Not adjusted for inflation. The record is a record in current dollars only. We did not adjust any price for inflation.
Caveats
- A region’s price is an average. Real prices vary by town, station and brand. Truck stops and fleet cards may price differently.
- Prices include federal and state taxes. State gas taxes vary, so some states in a region are above or below the region’s average.
- City prices cover the counties EIA lists for each metro area, not just the city.
- One week is a snapshot. EIA updates every week, usually on Monday. We’ll refresh this page.
This page has no ads or affiliate links for fuel cards. All prices are public EIA data. EIA is a U.S. government agency, and its data is public domain.
FAQ
What is the average price of diesel right now?
$6.38 a gallon for the U.S., for the week of Sep 28, 2026, according to EIA. It ranges from $5.95 in the Lower Atlantic region to $8.18 in California.
Is diesel at a record high?
Not this week. The record is $6.53, set the week of Sep 21, 2026. That’s the highest weekly U.S. average since EIA’s diesel series began in 1994. This week’s $6.38 is $0.15 below it. It is still above the June 2022 high of $5.81.
Why doesn’t my state have its own diesel price?
EIA only publishes diesel for regions and California. We show your region’s price and label it. We don’t estimate state prices.
How much does fuel cost a landscaping or HVAC business?
It depends on miles and mpg. Our example gas service pickup (20,000 miles at 15 mpg) costs about $5,953 a year at this week’s U.S. price. A diesel crew truck (25,000 miles at 12 mpg) costs about $13,296.
How often is this updated?
EIA releases new prices every week. Check the “Data through” line at the top.