Original research · USPTO Open Data Portal (pulled September 30, 2026) · USPTO PatentsView (grants through Dec 31, 2025; file released April 10, 2026) · Last updated September 30, 2026
Small businesses and other small filers now file about 1 in 4 AI patent applications. Their share of AI applications the U.S. patent office published rose from 22.5% in 2022 to 25.4% in January to September 2026. At the same time, the 10 biggest filers’ share fell from 25.4% in 2018 to 16.0% in 2025. Big companies still file most AI patents, but the field is less crowded at the top than it was.
Key findings
- 25.4% of AI patent applications published from January to September 2026 came from small entities. That is up from 22.5% in 2022 and 21.4% in 2015. It was 23.8% in 2025.
- Granted AI patents show the same rise: 18.5% in 2019, 19.1% in 2022 and 22.2% in 2025.
- AI is catching up with patents overall. Small entities filed 26.2% of all published patent applications in January to September 2026. The gap with AI shrank from 3.0 points in 2015 to 0.8 points.
- Among applications with a U.S. inventor, the small-entity share of AI filings rose from 24.8% to 26.4% (January to September, 2022 vs 2026). That is still below the 32.7% share for all U.S.-inventor patent applications in 2025.
- The 10 biggest filers’ share of AI applications fell from 25.4% in 2018 to 16.0% in 2025. It ticked up to 17.3% in 2026 so far. For granted AI patents with a U.S. first inventor, the top 10 owners’ share fell from 31.2% (2019) to 22.1% (2025).
- 5,623 different owners got AI patents in 2025, about three times the 1,855 in 2015 and up from 3,414 in 2019. The number has been roughly flat since 2023.
- By state, small entities’ share is highest in Florida (52.5%), Missouri (35.6%), Ohio (34.1%) and Maryland (33.4%). It is lowest in North Carolina (14.1%), Michigan (16.8%), Washington (16.9%) and California (18.0%). States with at least 200 AI applications published in 2025.
What “small entity” means
When you apply for a patent, you pay fees to the U.S. Patent and Trademark Office (USPTO). You pay less if you qualify as a small entity. That covers businesses with fewer than 500 employees, counting any companies they own or are owned by, plus universities, nonprofits and individual inventors. Small entities get about 60% off most patent fees.
Micro entities are a smaller group inside that. They get about 80% off, but they must meet an income limit (currently $262,380 in gross income) and have been named on no more than four earlier patent applications, or work through a university.
So “small entity” is a fee label, not a head count. It includes big universities and some government research institutes. In this page, “small entities” means small plus micro.
The trend: rising since 2021
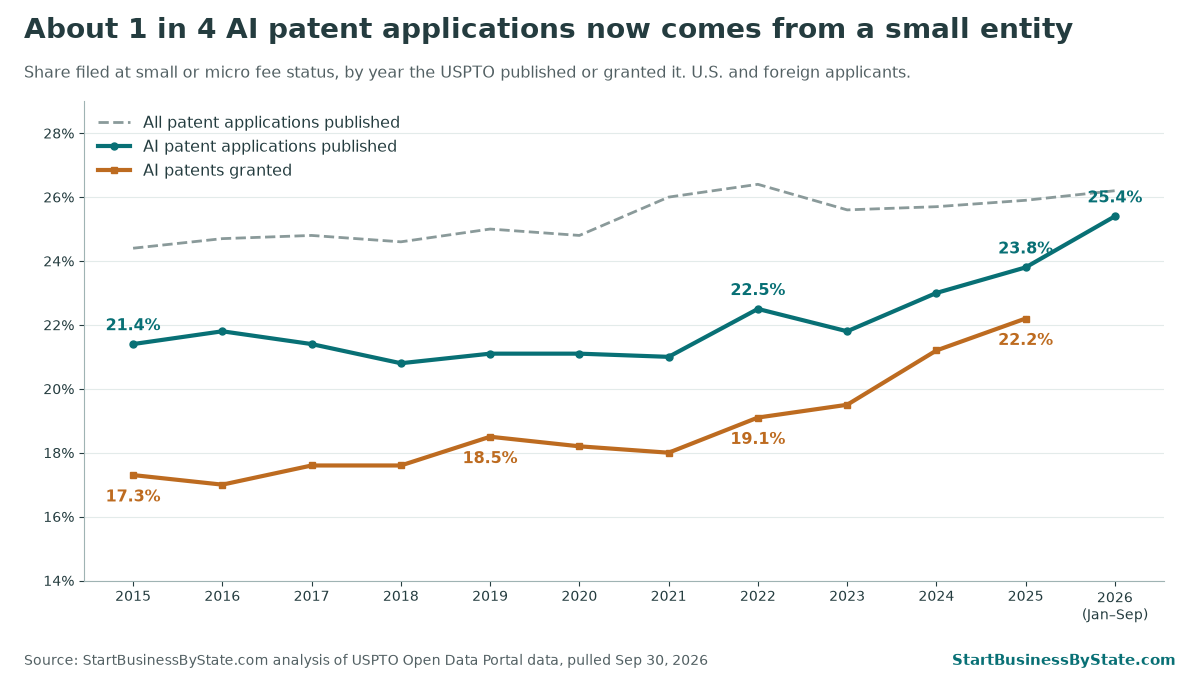
For years the small-entity share of AI applications barely moved. It sat near 21% from 2015 to 2021. Since then it has climbed in most years, to 25.4% so far in 2026. The share rose even though the count dipped a little, from 8,163 small-entity AI applications in 2022 to 7,787 in 2025. Big filers’ applications fell faster: total AI applications went from 36,342 to 32,656. For more on why AI patent numbers fell after 2022, see the AI patent paradox.
The rise is not just one kind of AI. For core machine-learning patents (class G06N), the small-entity share of published applications went from 23.0% in 2022 to 27.2% in 2026 so far.
| Year | AI applications published | Small-entity share, AI applications | Small-entity share, AI grants | Small-entity share, all applications |
|---|---|---|---|---|
| 2015 | 11,615 | 21.4% | 17.3% | 24.4% |
| 2018 | 18,764 | 20.8% | 17.6% | 24.6% |
| 2019 | 24,991 | 21.1% | 18.5% | 25.0% |
| 2020 | 31,255 | 21.1% | 18.2% | 24.8% |
| 2021 | 35,712 | 21.0% | 18.0% | 26.0% |
| 2022 | 36,342 | 22.5% | 19.1% | 26.4% |
| 2023 | 35,783 | 21.8% | 19.5% | 25.6% |
| 2024 | 33,857 | 23.0% | 21.2% | 25.7% |
| 2025 | 32,656 | 23.8% | 22.2% | 25.9% |
| 2026 (Jan–Sep) | 27,221 | 25.4% | — | 26.2% |
U.S. and foreign applicants. Source: USPTO Open Data Portal, pulled September 30, 2026.
U.S. inventors only. Looking only at applications that list at least one inventor in the United States, small entities filed 25.1% of AI applications published in 2025 (4,492 of 17,908). For January to September, the share went from 24.8% in 2022 to 26.4% in 2026. Across all kinds of patents, small entities filed 32.7% of U.S.-inventor applications in 2025. So AI is still less of a small-business field than patenting overall.
Big Tech’s share is shrinking
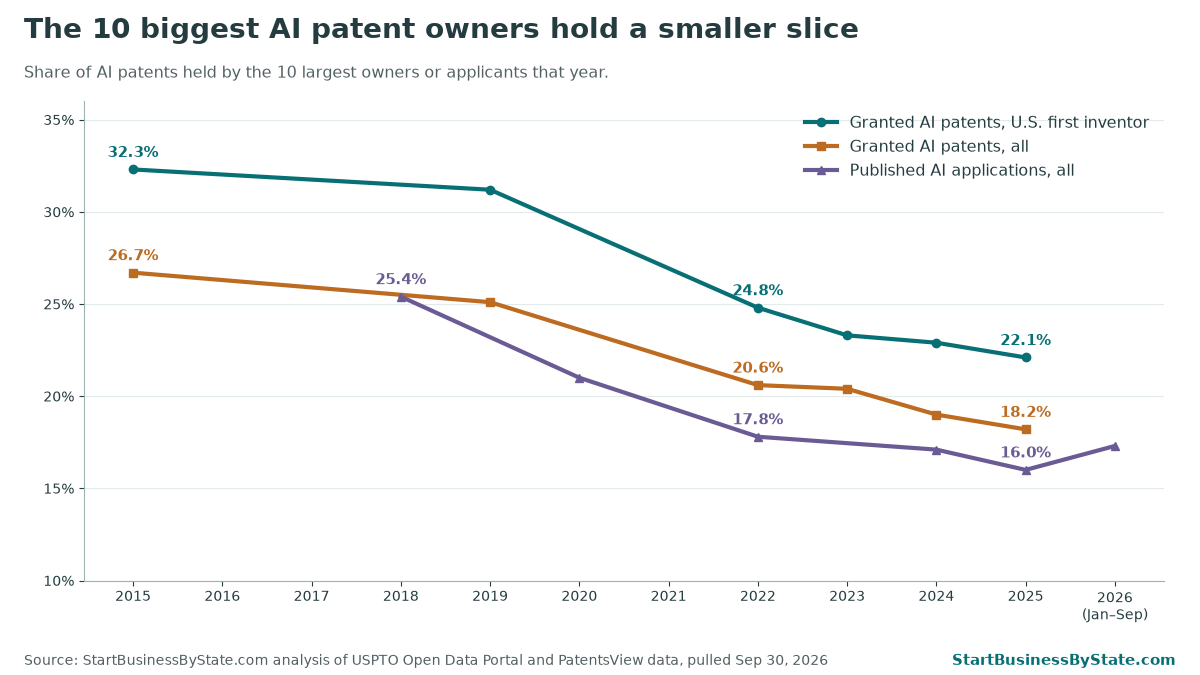
The biggest companies still get the most AI patents. In 2025 the leaders were Samsung Display (870), Google (820), IBM (761). But their slice is smaller. The top 10 owners had 26.7% of all AI grants in 2015, 20.6% in 2022 and 18.2% in 2025. IBM alone went from 1,656 AI grants in 2022 to 761 in 2025.
For published applications, the top 10 filers had 25.4% in 2018 and 16.0% in 2025. The 2025 top 10 were Google, Samsung Electronics, Microsoft, IBM, NEC, Nvidia, Qualcomm, Apple, Capital One and Bosch. Their share rose a little in 2026 so far (17.3%), so this is a long-term trend, not a straight line.
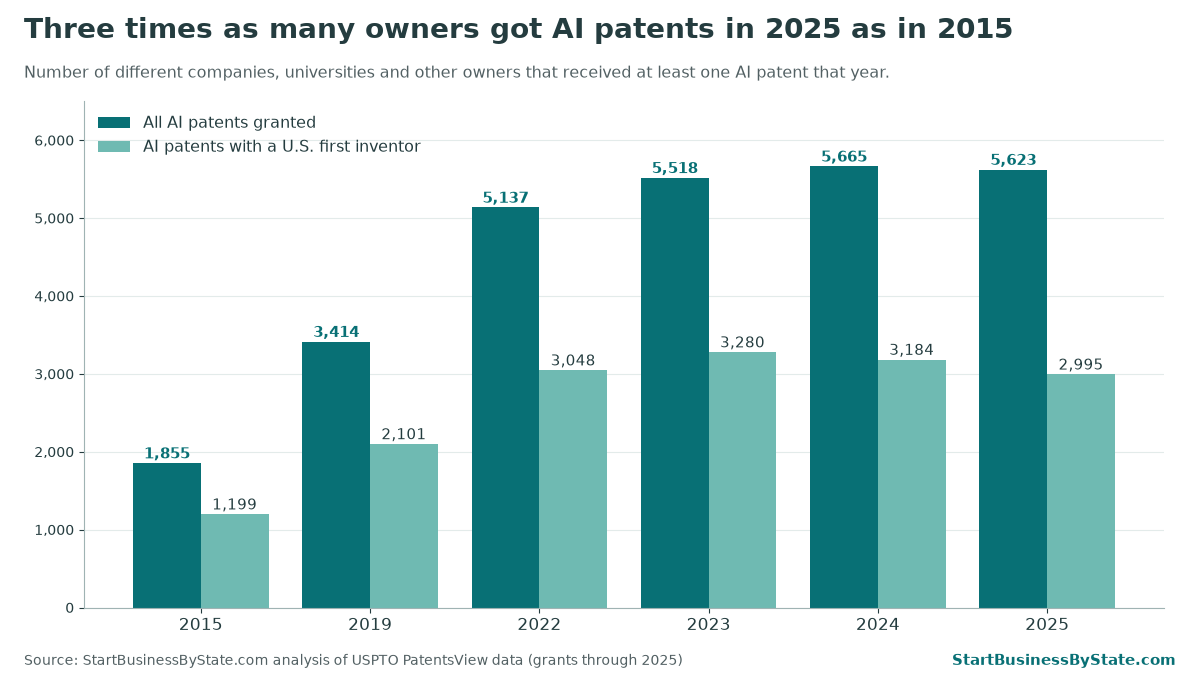
More owners are in the game. 5,623 different owners received AI patents in 2025, compared with 1,855 in 2015. For patents with a U.S. first inventor, the count went from 1,199 to 2,995. Both numbers have leveled off or dipped since 2023, when AI grants overall stopped growing.
Small-entity share by state
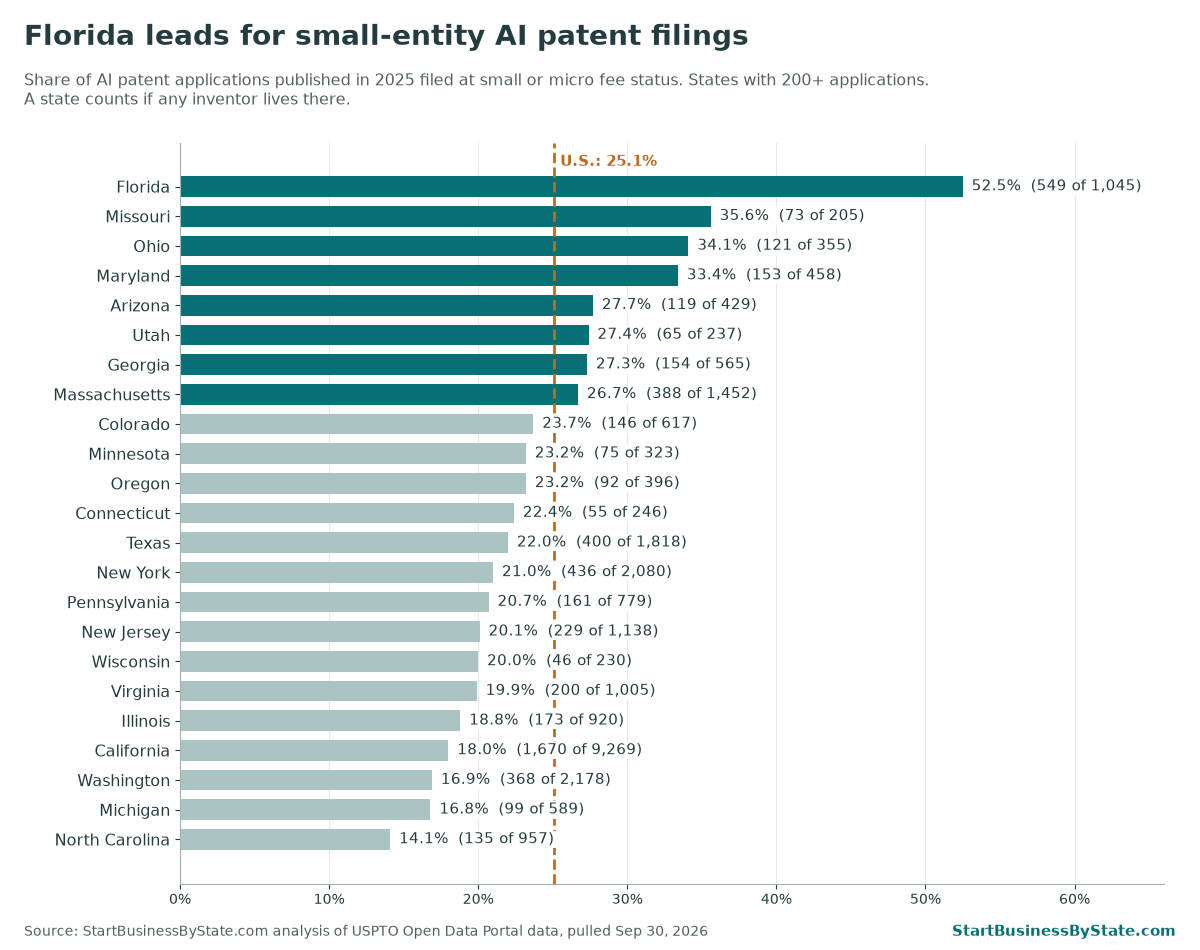
Florida stands out: small entities filed 52.5% of its AI applications in 2025. Florida is high for patents overall, too (53.1% of all its applications). One small-entity company with a lead inventor near Orlando files a lot of them (see the example below). The big tech states are at the bottom. In California, small entities filed 18.0% of AI applications, because so many come from large companies.
Comparing January to September 2026 with the same months of 2022, the small-entity share rose in 14 of these 23 states and fell in 8. Oregon rose the most, from 18.6% to 31.6%. Missouri (+9.7 points) and Connecticut (+7.6) came next. Colorado fell the most, from 41.5% to 26.5%.
| State | AI applications published, 2025 | Small-entity share, 2025 (count) | Share, Jan–Sep 2022 | Share, Jan–Sep 2026 | Change (points) | Small-entity share, all applications 2025 |
|---|---|---|---|---|---|---|
| United States | 17,908 | 25.1% 4,492 |
24.8% | 26.4% | +1.6 | 32.7% |
| Florida | 1,045 | 52.5% 549 |
43.0% | 45.9% | +2.9 | 53.1% |
| Missouri | 205 | 35.6% 73 |
26.8% | 36.5% | +9.7 | 37.1% |
| Ohio | 355 | 34.1% 121 |
31.5% | 34.7% | +3.2 | 31.9% |
| Maryland | 458 | 33.4% 153 |
30.6% | 36.9% | +6.3 | 42.7% |
| Arizona | 429 | 27.7% 119 |
37.3% | 32.8% | -4.5 | 33.3% |
| Utah | 237 | 27.4% 65 |
41.8% | 33.3% | -8.5 | 51.5% |
| Georgia | 565 | 27.3% 154 |
32.5% | 24.9% | -7.6 | 37.5% |
| Massachusetts | 1,452 | 26.7% 388 |
26.4% | 26.4% | +0.0 | 32.7% |
| Colorado | 617 | 23.7% 146 |
41.5% | 26.5% | -15.0 | 34.9% |
| Minnesota | 323 | 23.2% 75 |
16.1% | 20.0% | +3.9 | 27.1% |
| Oregon | 396 | 23.2% 92 |
18.6% | 31.6% | +13.0 | 21.7% |
| Connecticut | 246 | 22.4% 55 |
18.3% | 25.9% | +7.6 | 28.6% |
| Texas | 1,818 | 22.0% 400 |
22.7% | 24.9% | +2.2 | 27.9% |
| New York | 2,080 | 21.0% 436 |
19.9% | 22.1% | +2.2 | 32.4% |
| Pennsylvania | 779 | 20.7% 161 |
21.9% | 22.2% | +0.3 | 30.1% |
| New Jersey | 1,138 | 20.1% 229 |
21.5% | 22.3% | +0.8 | 25.7% |
| Wisconsin | 230 | 20.0% 46 |
26.6% | 12.8% | -13.8 | 23.7% |
| Virginia | 1,005 | 19.9% 200 |
22.5% | 23.9% | +1.4 | 24.7% |
| Illinois | 920 | 18.8% 173 |
16.6% | 21.6% | +5.0 | 27.2% |
| California | 9,269 | 18.0% 1,670 |
19.0% | 16.8% | -2.2 | 24.7% |
| Washington | 2,178 | 16.9% 368 |
15.6% | 18.6% | +3.0 | 22.2% |
| Michigan | 589 | 16.8% 99 |
18.8% | 17.8% | -1.0 | 20.9% |
| North Carolina | 957 | 14.1% 135 |
12.9% | 12.7% | -0.2 | 22.6% |
States with at least 200 AI applications published in 2025, sorted by 2025 share. A state counts an application if any inventor lives there. The January to September columns are smaller samples, so a few filings can move them. Source: USPTO Open Data Portal, pulled September 30, 2026. Download all states (CSV)
An example: Digital Global Systems
Digital Global Systems, Inc., based in Tysons, Virginia, makes software and hardware that monitors radio spectrum. All 683 of its applications in USPTO records carry small-entity fee status. That is a fee category the company claims; we did not measure its size.
In 2025 it received 177 AI patents in USPTO application records, more than any other small-entity filer. That is 2.8% of all small-entity AI grants that year. Without it, the small-entity share of 2025 AI grants would be 21.8% instead of 22.2%. So the rise is not about one company.
Many of its patents are continuations, meaning new applications built on an earlier one. Read how Digital Global Systems built its AI patent portfolio, with lessons for small businesses. For more on the company and why its patents show up in Florida, see the Florida case study on AI patents by state.
Who else files as a small entity? The top small-entity AI filers in 2025 (published applications) included AtomBeam Technologies (113), South Korea’s Electronics and Telecommunications Research Institute (146, a government research institute, counting both spellings of its name), DEEPX Co. (45), the University of California (25) and individual inventor Vijay Madisetti (24). That mix is why “small entity” is not the same as “small business.”
What this means for you
- Patents are not just for big companies. About 1 in 4 AI patent applications now comes from a small entity. The top 10 filers’ share has dropped over the years.
- You pay less. Small entities get about 60% off most USPTO fees. Micro entities get about 80% off. See the USPTO’s guide to saving on fees, its micro entity page and the current fee schedule.
- Fees are only part of the cost. Most small businesses also pay a patent attorney or agent, and that often costs more than the fees. The USPTO has a Patent Pro Bono Program, which offers free legal help to inventors and small businesses with limited income.
- Using AI is not the same as inventing it. Most small businesses that use AI will never need a patent. See how many businesses use AI in your state and your industry, and check the AI laws in your state. To see which states do more of each, see AI inventors vs. AI users by state.
- Set up your business first. Many small companies hold patents in the business’s name, not the owner’s. If that’s your plan, form the business before you file. Compare LLC costs by state and the best states to start a business.
More AI patent data: AI patents by state (where AI gets invented), AI patents in Main Street industries (which kinds of businesses the inventions are for, and how many come from small filers) and the monthly generative AI patent tracker. For how public companies talk about AI, see AI in annual reports.
Methods and caveats
- What counts as AI. A U.S. utility patent or application (the standard kind that covers how something works) with at least one current patent class in G06N (machine learning and neural networks), G06F40 (language processing), G06V (image and video recognition) or G10L15 (speech recognition). Patent classes can be updated after the fact, so older counts can shift a little.
- Small-entity share. From the USPTO Open Data Portal, pulled September 30, 2026. We count applications whose fee status on file is “small” or “micro,” divided by all applications with a fee status. It is the status on file today, which can differ from the status when the application was filed.
- By year. Applications are counted by the year the USPTO published them. Grants are counted by grant year. 2026 covers January to September for applications. We leave 2026 grants out of the chart because the year isn’t over.
- States. A state counts an application if any inventor lives there, so a team spread over two states counts in both. States with fewer than 200 AI applications published in 2025 are in the CSV but not the table. Oregon’s figures use a corrected search: the first version of our state search returned no Oregon results because of a query error, which we fixed on September 30, 2026.
- Top 10 share and owner counts. Grants come from USPTO PatentsView data (grants through December 31, 2025; file released April 10, 2026), using the first-listed owner as cleaned up by PatentsView. Application shares use the first applicant’s name, with common name variants merged for the biggest filers. Patents with no owner listed count toward the total but not as an owner.
- U.S. inventors. “With a U.S. inventor” means at least one inventor lives in the United States. “U.S. first inventor” means the first-listed inventor does.
- What this can’t tell you. It doesn’t show how many employees a filer has, whether a small entity is a startup or a university, or whether the patents are worth anything. It counts filings, not business results.
Cite or share this data
Free to use with credit: “Source: StartBusinessByState.com analysis of USPTO data.” Please link to this page. Download the state table (CSV)
FAQ
What is a small entity?
It is a fee category at the U.S. Patent and Trademark Office (USPTO), not a measured company size. Businesses with fewer than 500 employees (counting companies they own or are owned by), universities, nonprofits and individual inventors can claim it. They pay about 60% less on most patent fees. Micro entities are a smaller group inside it. They pay about 80% less and must meet an income limit or be a university.
Are all small entities small businesses?
No. The group also includes universities, nonprofits, government research institutes and people filing on their own. Some of the biggest small-entity AI filers are universities and a Korean government research institute. That is why we say "small entities" and give the definition.
What counts as an AI patent here?
A U.S. utility patent or application with at least one patent class for machine learning and neural networks (CPC G06N), language processing (G06F40), image and video recognition (G06V) or speech recognition (G10L15).
Why do applications and grants tell different stories?
Applications become public about 18 months after filing. A grant usually comes two to three years after filing. So published applications show newer activity, and grants show ideas filed a few years ago. Both point the same way here: the small-entity share is rising.
Why is the state list limited to 200 applications?
With fewer applications, a few filings can swing a state's share a lot. The CSV has every state, with a column that marks the ones under 200.
Can I get lower patent fees for my business?
If your business has fewer than 500 employees counting affiliates, and you haven't licensed or assigned the invention to a larger company, you can usually claim small-entity status. Check the USPTO's rules before you claim it. Claiming it by mistake can cause problems later.
Can I use these numbers and charts?
Yes. Please credit StartBusinessByState.com and link to this page. The state table is free to download as a CSV.