Original research · USPTO PatentsView (grants through Dec 31, 2025; file released April 10, 2026) · USPTO Open Data Portal (pulled September 30, 2026) · Last updated September 30, 2026
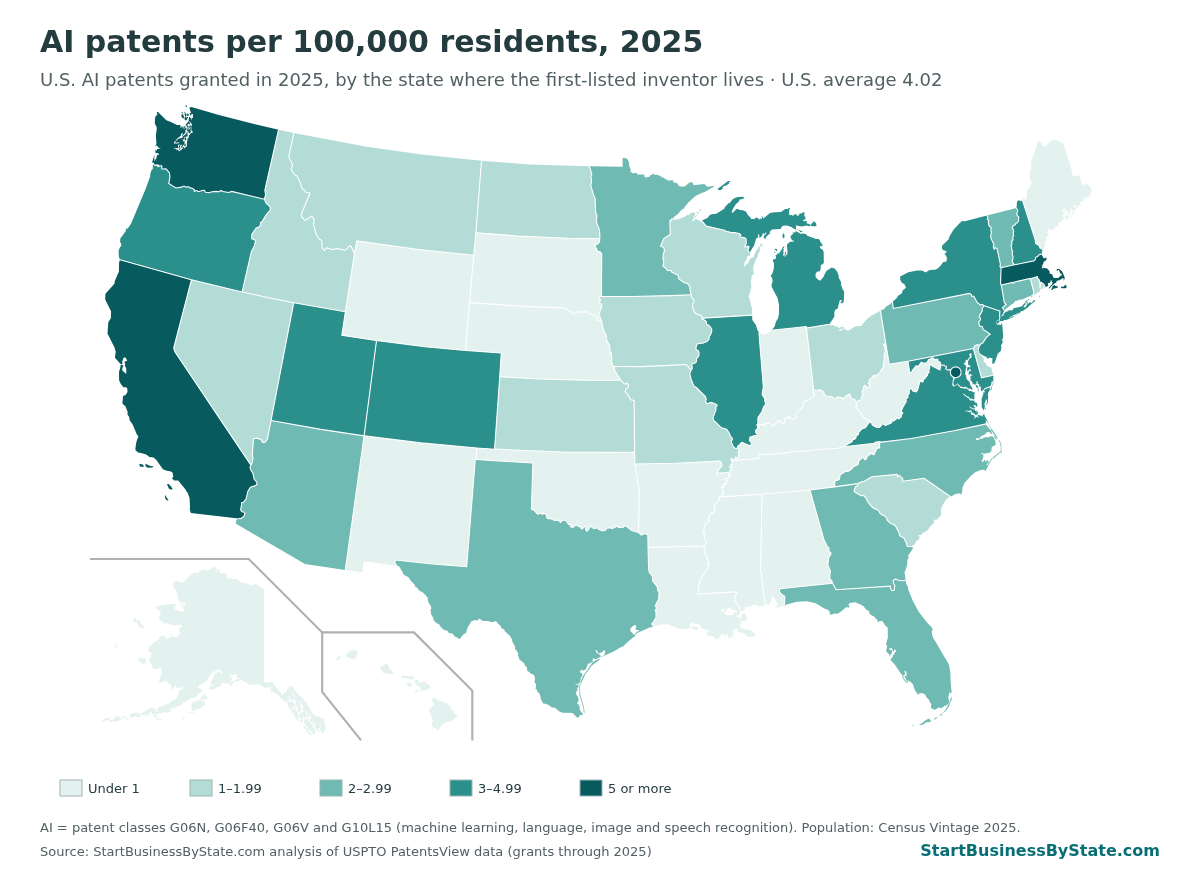
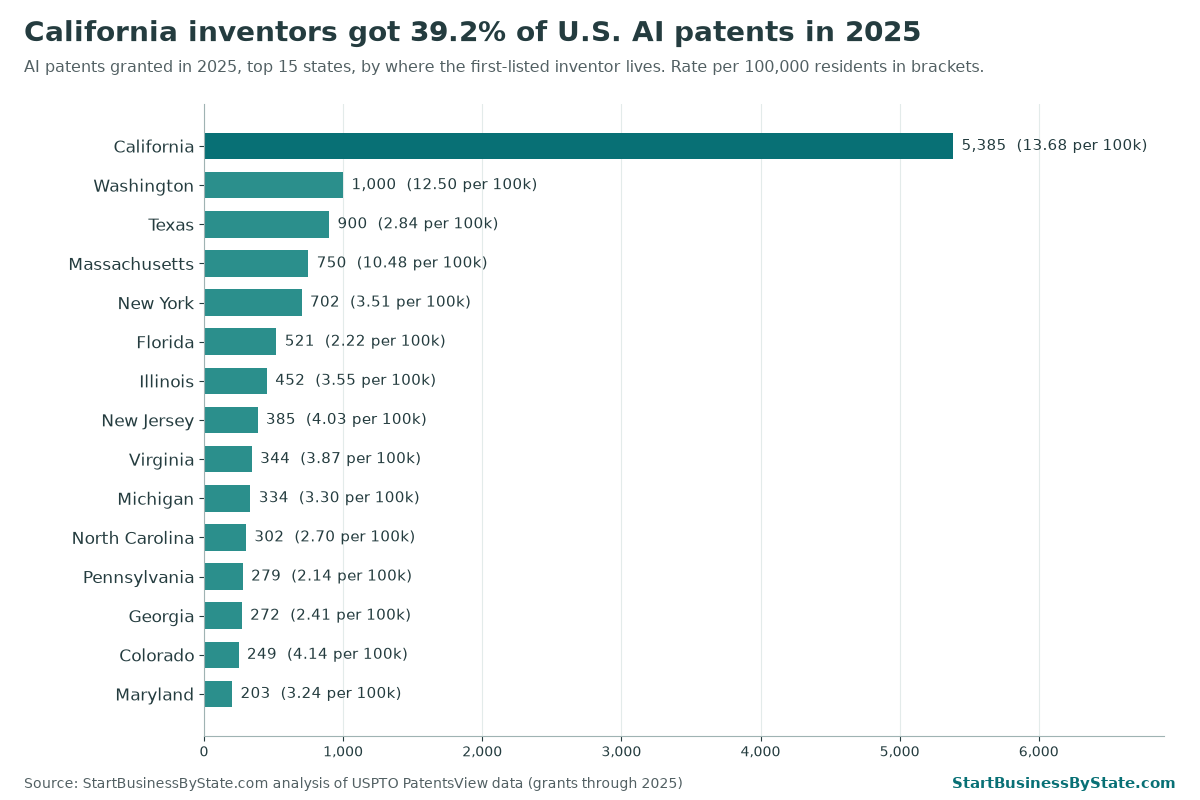
California is where most of America’s AI gets invented. In 2025 the U.S. patent office granted 13,754 AI patents whose first-listed inventor lives in the United States. Inventors in California got 5,385 of them, or 39.2%. Per person, Washington and Massachusetts come next. Alaska had none. Among states with at least 100 AI patents in 2022, Florida grew fastest, mostly because of one company.
Key findings
- 13,754 U.S.-invented AI patents were granted in 2025. That is 2.5% fewer than in 2022 (14,110). For why AI patent grants have slipped since 2023, see the AI patent paradox. A patent is a legal right to an invention, granted by the U.S. Patent and Trademark Office (USPTO). We count one state per patent: the state where the first-listed inventor lives.
- California alone has 5,385 (39.2%). That is 13.68 for every 100,000 residents, more than three times the U.S. rate of 4.02.
- Per person, the top five are California, Washington (12.50), Massachusetts (10.48), D.C. (7.78) and Oregon (4.28). Only six states and D.C. beat the U.S. rate.
- Alaska had zero. Mississippi (0.17), Maine (0.21) and West Virginia (0.23) were next lowest. 16 states had fewer than one AI patent per 100,000 people.
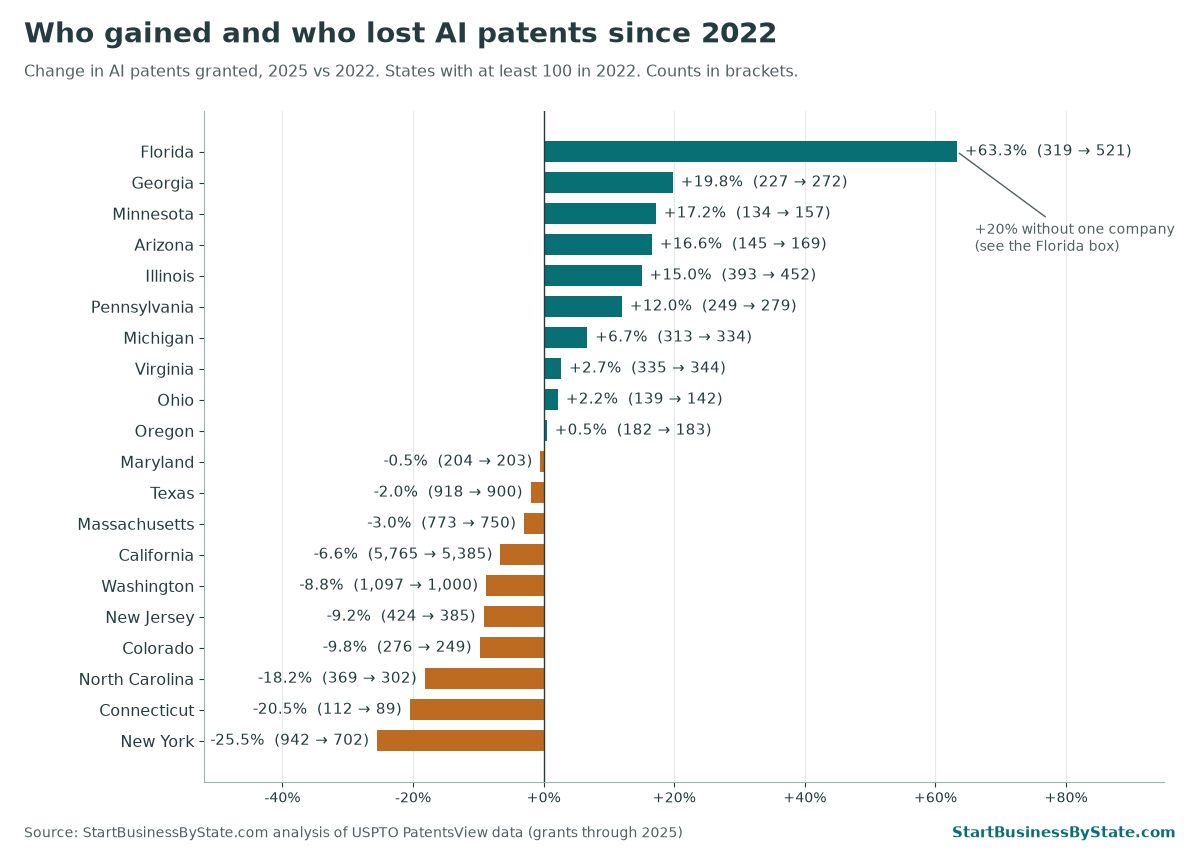
- Florida is up 63% since 2022 (319 to 521), the biggest jump among states with at least 100 AI patents in 2022. Most of it is one company whose lead inventor lives near Orlando. Without it, Florida is up about 20%. Georgia (+19.8%), Minnesota (+17.2%), Arizona (+16.6%) and Illinois (+15.0%) come next.
- New York fell the most among those states: down 25.5%, from 942 to 702. Connecticut (−20.5%) and North Carolina (−18.2%) also dropped.
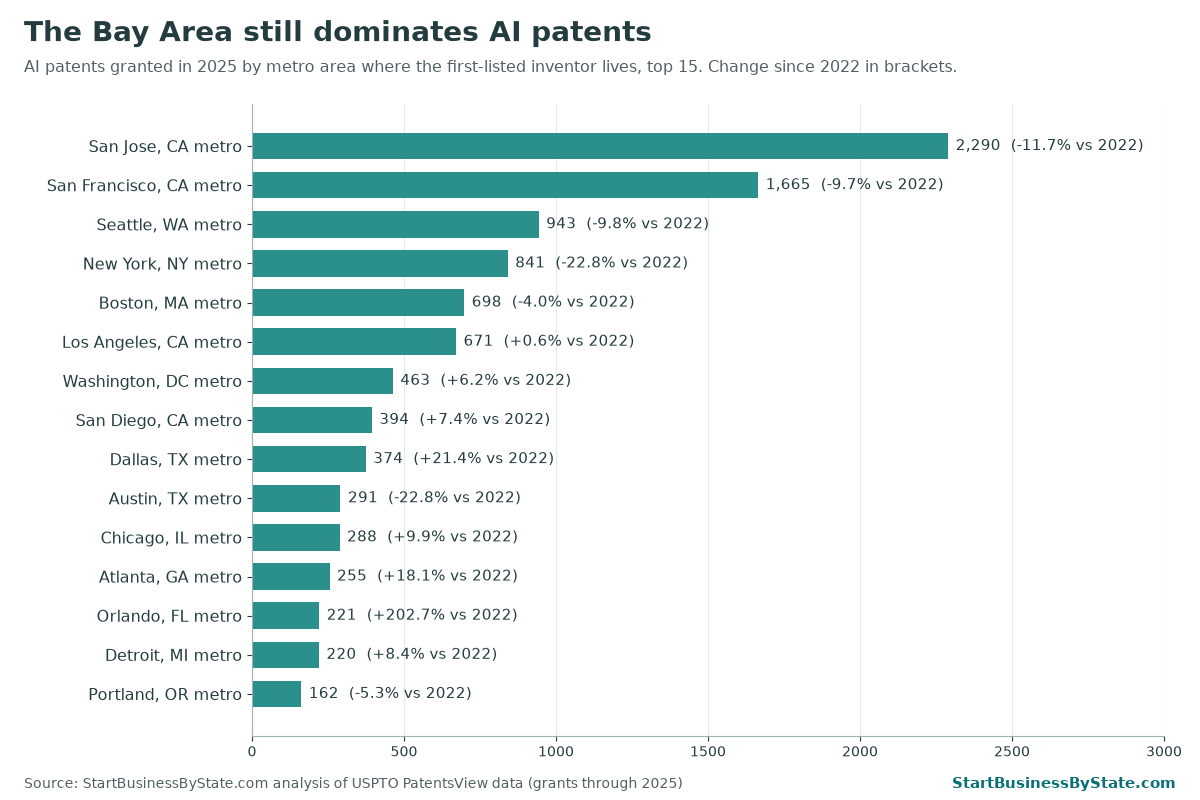
- Two Bay Area metros hold nearly 29% of the total. San Jose (2,290) and San Francisco (1,665) are far ahead of Seattle (943), New York (841) and Boston (698).
- Small filers are gaining. Small entities (see the plain definition below) filed 25.4% of AI patent applications published so far in 2026, up from 22.5% in 2022. The 10 biggest filers’ combined share fell from 25.4% in 2018 to 16.0% in 2025.
Map: AI patents per 100,000 residents
Who gained and who lost since 2022
2022 is the year ChatGPT came out, so it makes a handy starting line. But keep the timing in mind. A patent is usually granted two to three years after the inventor applies. So most 2025 grants are for ideas filed in 2021 to 2023. The post-ChatGPT rush mostly hasn’t reached the grant numbers yet.
A first look at newer filings (different data, don’t add it to the numbers above). Patent applications become public about 18 months after they’re filed, long before they’re granted. So published applications show newer activity. They come from a different USPTO system, and they count a state whenever any inventor lives there, so a team in two states counts in both. Comparing applications published January to September 2026 with the same months of 2022, among states with at least 100 in 2022: Wisconsin rose 43.0% (158 to 226), Tennessee 41.4% (111 to 157), Minnesota 35.3% (218 to 295), Florida 34.5% (623 to 838) and Indiana 30.9% (110 to 144). Michigan fell 21.7% (517 to 405). Nationally, applications with a U.S. inventor rose just 1.5% (14,192 to 14,407). For a monthly count of generative AI applications, see our generative AI patent tracker.
All 50 states and D.C.
Ranked by AI patents per 100,000 residents. Click a column header to sort. The last column comes from published applications, not grants (see the box above). Every state name links to our guide to starting a business there.
| Rank | State | AI patents granted, 2025 | Per 100,000 residents | AI patents, 2022 | Change since 2022 | Small-entity share of 2025 AI applications |
|---|---|---|---|---|---|---|
| United States | 13,754 | 4.02 | 14,110 | −2.5% | 25.1% 4,492 of 17,908 |
|
| 1 | California | 5,385 | 13.68 | 5,765 | −6.6% | 18.0% 1,670 of 9,269 |
| 2 | Washington | 1,000 | 12.50 | 1,097 | −8.8% | 16.9% 368 of 2,178 |
| 3 | Massachusetts | 750 | 10.48 | 773 | −3.0% | 26.7% 388 of 1,452 |
| 4 | District of Columbia | 54 | 7.78 | 43 | +25.6% * | 28.4% 44 of 155 |
| 5 | Oregon | 183 | 4.28 | 182 | +0.5% | 23.2% 92 of 396 |
| 6 | Colorado | 249 | 4.14 | 276 | −9.8% | 23.7% 146 of 617 |
| 7 | New Jersey | 385 | 4.03 | 424 | −9.2% | 20.1% 229 of 1,138 |
| 8 | Virginia | 344 | 3.87 | 335 | +2.7% | 19.9% 200 of 1,005 |
| 9 | Illinois | 452 | 3.55 | 393 | +15.0% | 18.8% 173 of 920 |
| 10 | New York | 702 | 3.51 | 942 | −25.5% | 21.0% 436 of 2,080 |
| 11 | Michigan | 334 | 3.30 | 313 | +6.7% | 16.8% 99 of 589 |
| 12 | New Hampshire | 46 | 3.25 | 51 | −9.8% * | 33.1% 45 of 136 |
| 13 | Maryland | 203 | 3.24 | 204 | −0.5% | 33.4% 153 of 458 |
| 14 | Utah | 112 | 3.16 | 77 | +45.5% * | 27.4% 65 of 237 |
| 15 | Texas | 900 | 2.84 | 918 | −2.0% | 22.0% 400 of 1,818 |
| 16 | North Carolina | 302 | 2.70 | 369 | −18.2% | 14.1% 135 of 957 |
| 17 | Minnesota | 157 | 2.69 | 134 | +17.2% | 23.2% 75 of 323 |
| 18 | Connecticut | 89 | 2.41 | 112 | −20.5% | 22.4% 55 of 246 |
| 19 | Georgia | 272 | 2.41 | 227 | +19.8% | 27.3% 154 of 565 |
| 20 | Vermont | 15 | 2.33 | 25 | −40.0% * | 69.2% 18 of 26 |
| 21 | Florida | 521 | 2.22 | 319 | +63.3% | 52.5% 549 of 1,045 |
| 22 | Arizona | 169 | 2.22 | 145 | +16.6% | 27.7% 119 of 429 |
| 23 | Pennsylvania | 279 | 2.14 | 249 | +12.0% | 20.7% 161 of 779 |
| 24 | Idaho | 38 | 1.87 | 30 | +26.7% * | 18.8% 13 of 69 |
| 25 | Delaware | 19 | 1.79 | 9 | +111.1% * | 35.0% 42 of 120 |
| 26 | Kansas | 47 | 1.58 | 33 | +42.4% * | 51.0% 49 of 96 |
| 27 | Nevada | 50 | 1.52 | 29 | +72.4% * | 48.9% 67 of 137 |
| 28 | Rhode Island | 16 | 1.44 | 12 | +33.3% * | 34.9% 15 of 43 |
| 29 | North Dakota | 10 | 1.25 | 3 | +233.3% * | 21.1% 4 of 19 |
| 30 | Montana | 14 | 1.22 | 11 | +27.3% * | 41.7% 15 of 36 |
| 31 | Missouri | 76 | 1.21 | 65 | +16.9% * | 35.6% 73 of 205 |
| 32 | Ohio | 142 | 1.19 | 139 | +2.2% | 34.1% 121 of 355 |
| 33 | Wisconsin | 71 | 1.19 | 74 | −4.1% * | 20.0% 46 of 230 |
| 34 | Iowa | 38 | 1.17 | 34 | +11.8% * | 29.9% 29 of 97 |
| 35 | South Carolina | 65 | 1.17 | 23 | +182.6% * | 60.5% 95 of 157 |
| 36 | New Mexico | 20 | 0.94 | 29 | −31.0% * | 38.1% 16 of 42 |
| 37 | Indiana | 63 | 0.90 | 58 | +8.6% * | 33.5% 60 of 179 |
| 38 | Tennessee | 52 | 0.71 | 33 | +57.6% * | 35.4% 52 of 147 |
| 39 | Wyoming | 4 | 0.68 | 3 | +33.3% * | 70.8% 17 of 24 |
| 40 | Kentucky | 29 | 0.63 | 29 | 0.0% * | 27.9% 17 of 61 |
| 41 | Hawaii | 8 | 0.56 | 10 | −20.0% * | 31.0% 9 of 29 |
| 42 | Nebraska | 11 | 0.55 | 21 | −47.6% * | 38.7% 12 of 31 |
| 43 | South Dakota | 4 | 0.43 | 3 | +33.3% * | 61.5% 8 of 13 |
| 44 | Arkansas | 13 | 0.42 | 23 | −43.5% * | 29.8% 14 of 47 |
| 45 | Louisiana | 19 | 0.41 | 7 | +171.4% * | 40.0% 18 of 45 |
| 46 | Oklahoma | 16 | 0.39 | 14 | +14.3% * | 40.9% 18 of 44 |
| 47 | Alabama | 14 | 0.27 | 31 | −54.8% * | 45.8% 22 of 48 |
| 48 | West Virginia | 4 | 0.23 | 3 | +33.3% * | 63.6% 7 of 11 |
| 49 | Maine | 3 | 0.21 | 10 | −70.0% * | 39.5% 17 of 43 |
| 50 | Mississippi | 5 | 0.17 | 1 | +400.0% * | 51.9% 14 of 27 |
| 51 | Alaska | 0 | 0.00 | 0 | — | 50.0% 1 of 2 |
Grants: USPTO PatentsView, U.S. utility patents, first-listed inventor’s state. Rate uses Census Vintage 2025 population. * Fewer than 100 in 2022, so the percent change is shaky. Small-entity share: USPTO Open Data Portal, AI patent applications published in 2025 that list at least one inventor in the state, filed at small or micro fee status; count shown under the percent.
Your state in one line
For reporters, universities and state economic development offices: one plain sentence per state, ready to quote. Please link back to this page.
- Alabama: Alabama ranks #47 of 51 for AI patents per resident. Inventors living there got 14 AI patents in 2025, or 0.27 per 100,000 people (U.S.: 4.02; #40 by total count). It had 31 in 2022. With numbers this small, the change from year to year jumps around. Small-entity filers were behind 45.8% of the AI patent applications published in 2025 that list an inventor in Alabama (22 of 48; U.S.: 25.1%).
- Alaska: Alaska ranks last (#51 of 51): no AI patent granted in 2025 listed an Alaska resident as the first inventor. Only 2 AI patent applications published in 2025 list an inventor in Alaska; small-entity filers were behind 1 of them.
- Arizona: Arizona ranks #22 of 51 for AI patents per resident. Inventors living there got 169 AI patents in 2025, or 2.22 per 100,000 people (U.S.: 4.02; #17 by total count). That is 16.6% more than in 2022 (145). Small-entity filers were behind 27.7% of the AI patent applications published in 2025 that list an inventor in Arizona (119 of 429; U.S.: 25.1%).
- Arkansas: Arkansas ranks #44 of 51 for AI patents per resident. Inventors living there got 13 AI patents in 2025, or 0.42 per 100,000 people (U.S.: 4.02; #42 by total count). It had 23 in 2022. With numbers this small, the change from year to year jumps around. Small-entity filers were behind 29.8% of the AI patent applications published in 2025 that list an inventor in Arkansas (14 of 47; U.S.: 25.1%).
- California: California ranks #1 of 51 for AI patents per resident. Inventors living there got 5,385 AI patents in 2025, or 13.68 per 100,000 people (U.S.: 4.02; #1 by total count). That is 6.6% fewer than in 2022 (5,765). Small-entity filers were behind 18.0% of the AI patent applications published in 2025 that list an inventor in California (1,670 of 9,269; U.S.: 25.1%).
- Colorado: Colorado ranks #6 of 51 for AI patents per resident. Inventors living there got 249 AI patents in 2025, or 4.14 per 100,000 people (U.S.: 4.02; #14 by total count). That is 9.8% fewer than in 2022 (276). Small-entity filers were behind 23.7% of the AI patent applications published in 2025 that list an inventor in Colorado (146 of 617; U.S.: 25.1%).
- Connecticut: Connecticut ranks #18 of 51 for AI patents per resident. Inventors living there got 89 AI patents in 2025, or 2.41 per 100,000 people (U.S.: 4.02; #21 by total count). That is 20.5% fewer than in 2022 (112). Small-entity filers were behind 22.4% of the AI patent applications published in 2025 that list an inventor in Connecticut (55 of 246; U.S.: 25.1%).
- Delaware: Delaware ranks #25 of 51 for AI patents per resident. Inventors living there got 19 AI patents in 2025, or 1.79 per 100,000 people (U.S.: 4.02; #35 by total count). It had 9 in 2022. With numbers this small, the change from year to year jumps around. Small-entity filers were behind 35.0% of the AI patent applications published in 2025 that list an inventor in Delaware (42 of 120; U.S.: 25.1%).
- District of Columbia: D.C. ranks #4 of 51 for AI patents per resident. Inventors living there got 54 AI patents in 2025, or 7.78 per 100,000 people (U.S.: 4.02; #26 by total count). It had 43 in 2022. With numbers this small, the change from year to year jumps around. Small-entity filers were behind 28.4% of the AI patent applications published in 2025 that list an inventor in D.C. (44 of 155; U.S.: 25.1%).
- Florida: Florida ranks #21 of 51 for AI patents per resident. Inventors living there got 521 AI patents in 2025, or 2.22 per 100,000 people (U.S.: 4.02; #6 by total count). That is 63.3% more than in 2022 (319). Most of the jump since 2022 comes from one company (see the box below); without it, Florida is up about 20%. Small-entity filers were behind 52.5% of the AI patent applications published in 2025 that list an inventor in Florida (549 of 1,045; U.S.: 25.1%).
- Georgia: Georgia ranks #19 of 51 for AI patents per resident. Inventors living there got 272 AI patents in 2025, or 2.41 per 100,000 people (U.S.: 4.02; #13 by total count). That is 19.8% more than in 2022 (227). Small-entity filers were behind 27.3% of the AI patent applications published in 2025 that list an inventor in Georgia (154 of 565; U.S.: 25.1%).
- Hawaii: Hawaii ranks #41 of 51 for AI patents per resident. Inventors living there got 8 AI patents in 2025, or 0.56 per 100,000 people (U.S.: 4.02; #45 by total count). It had 10 in 2022. With numbers this small, the change from year to year jumps around. Only 29 AI patent applications published in 2025 list an inventor in Hawaii; small-entity filers were behind 9 of them.
- Idaho: Idaho ranks #24 of 51 for AI patents per resident. Inventors living there got 38 AI patents in 2025, or 1.87 per 100,000 people (U.S.: 4.02; #31 by total count). It had 30 in 2022. With numbers this small, the change from year to year jumps around. Small-entity filers were behind 18.8% of the AI patent applications published in 2025 that list an inventor in Idaho (13 of 69; U.S.: 25.1%).
- Illinois: Illinois ranks #9 of 51 for AI patents per resident. Inventors living there got 452 AI patents in 2025, or 3.55 per 100,000 people (U.S.: 4.02; #7 by total count). That is 15.0% more than in 2022 (393). Small-entity filers were behind 18.8% of the AI patent applications published in 2025 that list an inventor in Illinois (173 of 920; U.S.: 25.1%).
- Indiana: Indiana ranks #37 of 51 for AI patents per resident. Inventors living there got 63 AI patents in 2025, or 0.90 per 100,000 people (U.S.: 4.02; #25 by total count). It had 58 in 2022. With numbers this small, the change from year to year jumps around. Small-entity filers were behind 33.5% of the AI patent applications published in 2025 that list an inventor in Indiana (60 of 179; U.S.: 25.1%).
- Iowa: Iowa ranks #34 of 51 for AI patents per resident. Inventors living there got 38 AI patents in 2025, or 1.17 per 100,000 people (U.S.: 4.02; #31 by total count). It had 34 in 2022. With numbers this small, the change from year to year jumps around. Small-entity filers were behind 29.9% of the AI patent applications published in 2025 that list an inventor in Iowa (29 of 97; U.S.: 25.1%).
- Kansas: Kansas ranks #26 of 51 for AI patents per resident. Inventors living there got 47 AI patents in 2025, or 1.58 per 100,000 people (U.S.: 4.02; #29 by total count). It had 33 in 2022. With numbers this small, the change from year to year jumps around. Small-entity filers were behind 51.0% of the AI patent applications published in 2025 that list an inventor in Kansas (49 of 96; U.S.: 25.1%).
- Kentucky: Kentucky ranks #40 of 51 for AI patents per resident. Inventors living there got 29 AI patents in 2025, or 0.63 per 100,000 people (U.S.: 4.02; #33 by total count). It had 29 in 2022. With numbers this small, the change from year to year jumps around. Small-entity filers were behind 27.9% of the AI patent applications published in 2025 that list an inventor in Kentucky (17 of 61; U.S.: 25.1%).
- Louisiana: Louisiana ranks #45 of 51 for AI patents per resident. Inventors living there got 19 AI patents in 2025, or 0.41 per 100,000 people (U.S.: 4.02; #35 by total count). It had 7 in 2022. With numbers this small, the change from year to year jumps around. Small-entity filers were behind 40.0% of the AI patent applications published in 2025 that list an inventor in Louisiana (18 of 45; U.S.: 25.1%).
- Maine: Maine ranks #49 of 51 for AI patents per resident. Inventors living there got 3 AI patents in 2025, or 0.21 per 100,000 people (U.S.: 4.02; #50 by total count). It had 10 in 2022. With numbers this small, the change from year to year jumps around. Small-entity filers were behind 39.5% of the AI patent applications published in 2025 that list an inventor in Maine (17 of 43; U.S.: 25.1%).
- Maryland: Maryland ranks #13 of 51 for AI patents per resident. Inventors living there got 203 AI patents in 2025, or 3.24 per 100,000 people (U.S.: 4.02; #15 by total count). That is about the same as in 2022 (204). Small-entity filers were behind 33.4% of the AI patent applications published in 2025 that list an inventor in Maryland (153 of 458; U.S.: 25.1%).
- Massachusetts: Massachusetts ranks #3 of 51 for AI patents per resident. Inventors living there got 750 AI patents in 2025, or 10.48 per 100,000 people (U.S.: 4.02; #4 by total count). That is 3.0% fewer than in 2022 (773). Small-entity filers were behind 26.7% of the AI patent applications published in 2025 that list an inventor in Massachusetts (388 of 1,452; U.S.: 25.1%).
- Michigan: Michigan ranks #11 of 51 for AI patents per resident. Inventors living there got 334 AI patents in 2025, or 3.30 per 100,000 people (U.S.: 4.02; #10 by total count). That is 6.7% more than in 2022 (313). Small-entity filers were behind 16.8% of the AI patent applications published in 2025 that list an inventor in Michigan (99 of 589; U.S.: 25.1%).
- Minnesota: Minnesota ranks #17 of 51 for AI patents per resident. Inventors living there got 157 AI patents in 2025, or 2.69 per 100,000 people (U.S.: 4.02; #18 by total count). That is 17.2% more than in 2022 (134). Small-entity filers were behind 23.2% of the AI patent applications published in 2025 that list an inventor in Minnesota (75 of 323; U.S.: 25.1%).
- Mississippi: Mississippi ranks #50 of 51 for AI patents per resident. Inventors living there got 5 AI patents in 2025, or 0.17 per 100,000 people (U.S.: 4.02; #46 by total count). It had 1 in 2022. With numbers this small, the change from year to year jumps around. Only 27 AI patent applications published in 2025 list an inventor in Mississippi; small-entity filers were behind 14 of them.
- Missouri: Missouri ranks #31 of 51 for AI patents per resident. Inventors living there got 76 AI patents in 2025, or 1.21 per 100,000 people (U.S.: 4.02; #22 by total count). It had 65 in 2022. With numbers this small, the change from year to year jumps around. Small-entity filers were behind 35.6% of the AI patent applications published in 2025 that list an inventor in Missouri (73 of 205; U.S.: 25.1%).
- Montana: Montana ranks #30 of 51 for AI patents per resident. Inventors living there got 14 AI patents in 2025, or 1.22 per 100,000 people (U.S.: 4.02; #40 by total count). It had 11 in 2022. With numbers this small, the change from year to year jumps around. Small-entity filers were behind 41.7% of the AI patent applications published in 2025 that list an inventor in Montana (15 of 36; U.S.: 25.1%).
- Nebraska: Nebraska ranks #42 of 51 for AI patents per resident. Inventors living there got 11 AI patents in 2025, or 0.55 per 100,000 people (U.S.: 4.02; #43 by total count). It had 21 in 2022. With numbers this small, the change from year to year jumps around. Small-entity filers were behind 38.7% of the AI patent applications published in 2025 that list an inventor in Nebraska (12 of 31; U.S.: 25.1%).
- Nevada: Nevada ranks #27 of 51 for AI patents per resident. Inventors living there got 50 AI patents in 2025, or 1.52 per 100,000 people (U.S.: 4.02; #28 by total count). It had 29 in 2022. With numbers this small, the change from year to year jumps around. Small-entity filers were behind 48.9% of the AI patent applications published in 2025 that list an inventor in Nevada (67 of 137; U.S.: 25.1%).
- New Hampshire: New Hampshire ranks #12 of 51 for AI patents per resident. Inventors living there got 46 AI patents in 2025, or 3.25 per 100,000 people (U.S.: 4.02; #30 by total count). It had 51 in 2022. With numbers this small, the change from year to year jumps around. Small-entity filers were behind 33.1% of the AI patent applications published in 2025 that list an inventor in New Hampshire (45 of 136; U.S.: 25.1%).
- New Jersey: New Jersey ranks #7 of 51 for AI patents per resident. Inventors living there got 385 AI patents in 2025, or 4.03 per 100,000 people (U.S.: 4.02; #8 by total count). That is 9.2% fewer than in 2022 (424). Small-entity filers were behind 20.1% of the AI patent applications published in 2025 that list an inventor in New Jersey (229 of 1,138; U.S.: 25.1%).
- New Mexico: New Mexico ranks #36 of 51 for AI patents per resident. Inventors living there got 20 AI patents in 2025, or 0.94 per 100,000 people (U.S.: 4.02; #34 by total count). It had 29 in 2022. With numbers this small, the change from year to year jumps around. Small-entity filers were behind 38.1% of the AI patent applications published in 2025 that list an inventor in New Mexico (16 of 42; U.S.: 25.1%).
- New York: New York ranks #10 of 51 for AI patents per resident. Inventors living there got 702 AI patents in 2025, or 3.51 per 100,000 people (U.S.: 4.02; #5 by total count). That is 25.5% fewer than in 2022 (942). Small-entity filers were behind 21.0% of the AI patent applications published in 2025 that list an inventor in New York (436 of 2,080; U.S.: 25.1%).
- North Carolina: North Carolina ranks #16 of 51 for AI patents per resident. Inventors living there got 302 AI patents in 2025, or 2.70 per 100,000 people (U.S.: 4.02; #11 by total count). That is 18.2% fewer than in 2022 (369). Small-entity filers were behind 14.1% of the AI patent applications published in 2025 that list an inventor in North Carolina (135 of 957; U.S.: 25.1%).
- North Dakota: North Dakota ranks #29 of 51 for AI patents per resident. Inventors living there got 10 AI patents in 2025, or 1.25 per 100,000 people (U.S.: 4.02; #44 by total count). It had 3 in 2022. With numbers this small, the change from year to year jumps around. Only 19 AI patent applications published in 2025 list an inventor in North Dakota; small-entity filers were behind 4 of them.
- Ohio: Ohio ranks #32 of 51 for AI patents per resident. Inventors living there got 142 AI patents in 2025, or 1.19 per 100,000 people (U.S.: 4.02; #19 by total count). That is 2.2% more than in 2022 (139). Small-entity filers were behind 34.1% of the AI patent applications published in 2025 that list an inventor in Ohio (121 of 355; U.S.: 25.1%).
- Oklahoma: Oklahoma ranks #46 of 51 for AI patents per resident. Inventors living there got 16 AI patents in 2025, or 0.39 per 100,000 people (U.S.: 4.02; #37 by total count). It had 14 in 2022. With numbers this small, the change from year to year jumps around. Small-entity filers were behind 40.9% of the AI patent applications published in 2025 that list an inventor in Oklahoma (18 of 44; U.S.: 25.1%).
- Oregon: Oregon ranks #5 of 51 for AI patents per resident. Inventors living there got 183 AI patents in 2025, or 4.28 per 100,000 people (U.S.: 4.02; #16 by total count). That is about the same as in 2022 (182). Small-entity filers were behind 23.2% of the AI patent applications published in 2025 that list an inventor in Oregon (92 of 396; U.S.: 25.1%).
- Pennsylvania: Pennsylvania ranks #23 of 51 for AI patents per resident. Inventors living there got 279 AI patents in 2025, or 2.14 per 100,000 people (U.S.: 4.02; #12 by total count). That is 12.0% more than in 2022 (249). Small-entity filers were behind 20.7% of the AI patent applications published in 2025 that list an inventor in Pennsylvania (161 of 779; U.S.: 25.1%).
- Rhode Island: Rhode Island ranks #28 of 51 for AI patents per resident. Inventors living there got 16 AI patents in 2025, or 1.44 per 100,000 people (U.S.: 4.02; #37 by total count). It had 12 in 2022. With numbers this small, the change from year to year jumps around. Small-entity filers were behind 34.9% of the AI patent applications published in 2025 that list an inventor in Rhode Island (15 of 43; U.S.: 25.1%).
- South Carolina: South Carolina ranks #35 of 51 for AI patents per resident. Inventors living there got 65 AI patents in 2025, or 1.17 per 100,000 people (U.S.: 4.02; #24 by total count). It had 23 in 2022. With numbers this small, the change from year to year jumps around. Small-entity filers were behind 60.5% of the AI patent applications published in 2025 that list an inventor in South Carolina (95 of 157; U.S.: 25.1%).
- South Dakota: South Dakota ranks #43 of 51 for AI patents per resident. Inventors living there got 4 AI patents in 2025, or 0.43 per 100,000 people (U.S.: 4.02; #47 by total count). It had 3 in 2022. With numbers this small, the change from year to year jumps around. Only 13 AI patent applications published in 2025 list an inventor in South Dakota; small-entity filers were behind 8 of them.
- Tennessee: Tennessee ranks #38 of 51 for AI patents per resident. Inventors living there got 52 AI patents in 2025, or 0.71 per 100,000 people (U.S.: 4.02; #27 by total count). It had 33 in 2022. With numbers this small, the change from year to year jumps around. Small-entity filers were behind 35.4% of the AI patent applications published in 2025 that list an inventor in Tennessee (52 of 147; U.S.: 25.1%).
- Texas: Texas ranks #15 of 51 for AI patents per resident. Inventors living there got 900 AI patents in 2025, or 2.84 per 100,000 people (U.S.: 4.02; #3 by total count). That is 2.0% fewer than in 2022 (918). Small-entity filers were behind 22.0% of the AI patent applications published in 2025 that list an inventor in Texas (400 of 1,818; U.S.: 25.1%).
- Utah: Utah ranks #14 of 51 for AI patents per resident. Inventors living there got 112 AI patents in 2025, or 3.16 per 100,000 people (U.S.: 4.02; #20 by total count). It had 77 in 2022. With numbers this small, the change from year to year jumps around. Small-entity filers were behind 27.4% of the AI patent applications published in 2025 that list an inventor in Utah (65 of 237; U.S.: 25.1%).
- Vermont: Vermont ranks #20 of 51 for AI patents per resident. Inventors living there got 15 AI patents in 2025, or 2.33 per 100,000 people (U.S.: 4.02; #39 by total count). It had 25 in 2022. With numbers this small, the change from year to year jumps around. Only 26 AI patent applications published in 2025 list an inventor in Vermont; small-entity filers were behind 18 of them.
- Virginia: Virginia ranks #8 of 51 for AI patents per resident. Inventors living there got 344 AI patents in 2025, or 3.87 per 100,000 people (U.S.: 4.02; #9 by total count). That is 2.7% more than in 2022 (335). Small-entity filers were behind 19.9% of the AI patent applications published in 2025 that list an inventor in Virginia (200 of 1,005; U.S.: 25.1%).
- Washington: Washington ranks #2 of 51 for AI patents per resident. Inventors living there got 1,000 AI patents in 2025, or 12.50 per 100,000 people (U.S.: 4.02; #2 by total count). That is 8.8% fewer than in 2022 (1,097). Small-entity filers were behind 16.9% of the AI patent applications published in 2025 that list an inventor in Washington (368 of 2,178; U.S.: 25.1%).
- West Virginia: West Virginia ranks #48 of 51 for AI patents per resident. Inventors living there got 4 AI patents in 2025, or 0.23 per 100,000 people (U.S.: 4.02; #47 by total count). It had 3 in 2022. With numbers this small, the change from year to year jumps around. Only 11 AI patent applications published in 2025 list an inventor in West Virginia; small-entity filers were behind 7 of them.
- Wisconsin: Wisconsin ranks #33 of 51 for AI patents per resident. Inventors living there got 71 AI patents in 2025, or 1.19 per 100,000 people (U.S.: 4.02; #23 by total count). It had 74 in 2022. With numbers this small, the change from year to year jumps around. Small-entity filers were behind 20.0% of the AI patent applications published in 2025 that list an inventor in Wisconsin (46 of 230; U.S.: 25.1%).
- Wyoming: Wyoming ranks #39 of 51 for AI patents per resident. Inventors living there got 4 AI patents in 2025, or 0.68 per 100,000 people (U.S.: 4.02; #47 by total count). It had 3 in 2022. With numbers this small, the change from year to year jumps around. Only 24 AI patent applications published in 2025 list an inventor in Wyoming; small-entity filers were behind 17 of them.
Top metro areas
AI patents cluster in a handful of places. San Jose and San Francisco together had 3,955 of the 13,754 U.S. AI patents granted in 2025, nearly 29%. Among the 20 biggest metros, the fastest growth since 2022 was in Orlando (+202.7%, again mostly one company), Dallas–Fort Worth (+21.4%), Phoenix (+21.4%), Pittsburgh (+18.8%) and Atlanta (+18.1%). The biggest drops were New York and Austin (both −22.8%).
| # | Metro area | AI patents, 2025 | 2022 | Change |
|---|---|---|---|---|
| 1 | San Jose-Sunnyvale-Santa Clara, CA | 2,290 | 2,594 | −11.7% |
| 2 | San Francisco-Oakland-Fremont, CA | 1,665 | 1,843 | −9.7% |
| 3 | Seattle-Tacoma-Bellevue, WA | 943 | 1,046 | −9.8% |
| 4 | New York-Newark-Jersey City, NY-NJ | 841 | 1,089 | −22.8% |
| 5 | Boston-Cambridge-Newton, MA-NH | 698 | 727 | −4.0% |
| 6 | Los Angeles-Long Beach-Anaheim, CA | 671 | 667 | +0.6% |
| 7 | Washington-Arlington-Alexandria, DC-VA-MD-WV | 463 | 436 | +6.2% |
| 8 | San Diego-Chula Vista-Carlsbad, CA | 394 | 367 | +7.4% |
| 9 | Dallas-Fort Worth-Arlington, TX | 374 | 308 | +21.4% |
| 10 | Austin-Round Rock-San Marcos, TX | 291 | 377 | −22.8% |
| 11 | Chicago-Naperville-Elgin, IL-IN | 288 | 262 | +9.9% |
| 12 | Atlanta-Sandy Springs-Roswell, GA | 255 | 216 | +18.1% |
| 13 | Orlando-Kissimmee-Sanford, FL | 221 | 73 | +202.7% |
| 14 | Detroit-Warren-Dearborn, MI | 220 | 203 | +8.4% |
| 15 | Portland-Vancouver-Hillsboro, OR-WA | 162 | 171 | −5.3% |
| 16 | Pittsburgh, PA | 158 | 133 | +18.8% |
| 17 | Denver-Aurora-Centennial, CO | 153 | 164 | −6.7% |
| 18 | Miami-Fort Lauderdale-West Palm Beach, FL | 143 | 149 | −4.0% |
| 19 | Houston-Pasadena-The Woodlands, TX | 139 | 137 | +1.5% |
| 20 | Phoenix-Mesa-Chandler, AZ | 136 | 112 | +21.4% |
Small businesses are getting a bigger slice
First, what “small entity” means. When you apply for a patent, you pay fees. You can pay less if you qualify as a “small entity.” That covers businesses with fewer than 500 employees (counting any companies they own or are owned by), plus universities, nonprofits and individual inventors. “Micro entities” are a smaller group inside that, with an income limit. So “small entity” is a fee label, not a measured head count. It also includes big universities. We use the status on file today, which can differ from the status when the application was filed.
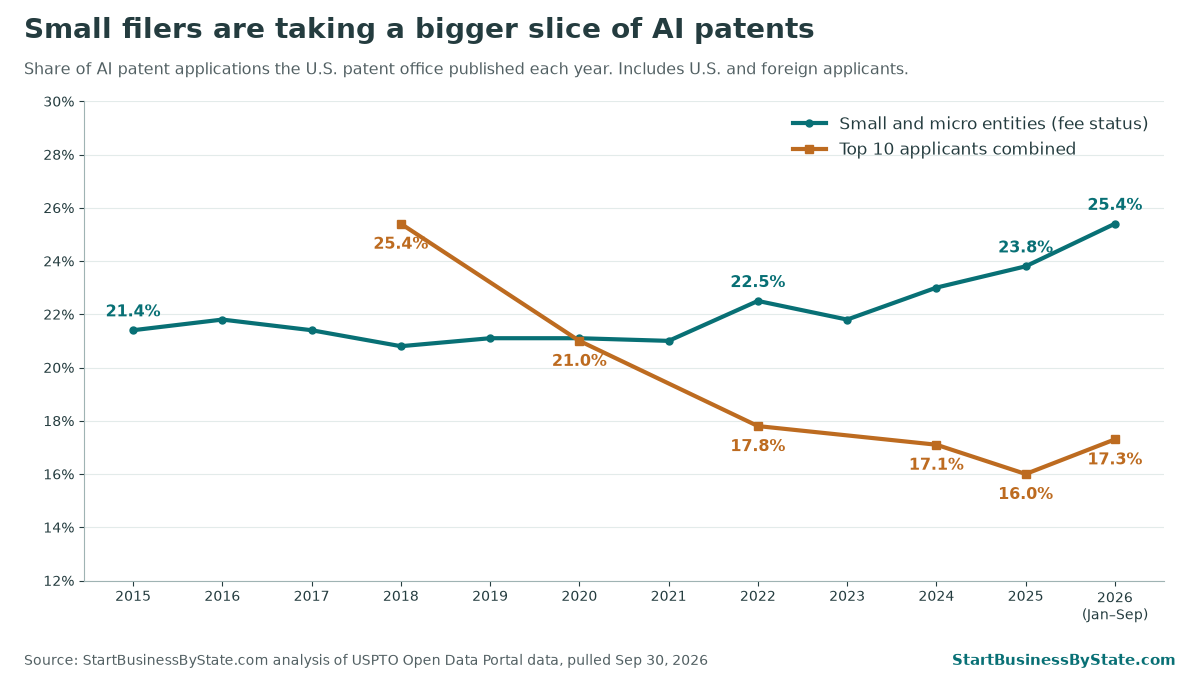
- The small-entity share is rising. It was 22.5% of published AI applications in 2022, 23.8% in 2025 and 25.4% from January to September 2026. For AI patents actually granted, it went from 19.1% (2022) to 22.2% (2025).
- Big Tech’s share is shrinking. The 10 biggest filers had 25.4% of published AI applications in 2018, 17.8% in 2022 and 16.0% in 2025 (17.3% so far in 2026). On granted AI patents, the top 10 owners’ share fell from 26.7% in 2015 to 20.6% in 2022 and 18.2% in 2025.
- More owners are in the game. 5,623 different companies and organizations received AI patents in 2025, up from 3,414 in 2019. The biggest in 2025 were Samsung Display (870), Google (820) and IBM (761). IBM got 1,656 in 2022.
- AI is still less small-business-heavy than patents overall. Among applications published in 2025 with a U.S. inventor, small entities filed 25.1% of the AI ones, compared with 32.7% of all patent applications.
- By state, the small-entity share is highest in Florida (52.5%), Missouri (35.6%), Ohio (34.1%) and Maryland (33.4%) among states with 200 or more AI applications published in 2025. It’s lowest in California (18.0%), Washington (16.9%), Michigan (16.8%) and North Carolina (14.1%), where big employers file most of them.
For the full breakdown, including how each state changed since 2022 and what the lower patent fees mean for your business, see small businesses’ share of AI patents. For which kinds of businesses the inventions are aimed at, like restaurants, construction and farms, see AI patents in Main Street industries.
Patenting and using AI are two different things. For how many businesses in each state actually use AI tools, see small-business AI use by state and AI use by industry. For the rules that apply when you use it, see AI laws by state. To see which states invent AI and which ones mostly use it, see AI inventors vs. AI users by state.
Case study: one company, 162 AI patents, and Florida’s big jump
Digital Global Systems, Inc. makes software and hardware that monitors radio spectrum (the airwaves that phones, radios and Wi-Fi use). In 2025 it received 162 AI patents with a U.S. first inventor. That puts it #9 among all owners of those patents, ahead of Snap (148) and close to Nvidia (163) and Adobe (163). The USPTO’s application records, which count a little differently, show 177 AI grants for the company in 2025.
Why it shows up in Florida. 149 of those 162 patents list a first inventor who lives in Winter Garden, near Orlando. That alone made Winter Garden the #14 city in the country for AI patents. It explains most of Florida’s +63% since 2022 and Orlando’s +202.7%.
But the company is not based in Florida. Its website and the addresses on its patents put its headquarters in Tysons, Virginia. The patents we checked name Armando Montalvo of Winter Garden as the first inventor; the company’s website lists him as its chief technology officer. This is a good example of the rule behind this whole page: we count where inventors live, not where companies are based.
Small-entity status. All 683 of the company’s applications in USPTO records carry small-entity fee status. That is a fee category the company claims; we did not measure its size.
Many patents, related ideas. Many of its patents are “continuations.” A continuation is a new application built on an earlier one: it shares the same description but claims a different piece of the invention. Many of the company’s 2025 patents share one title about “dynamic, prioritized spectrum management.” So 162 patents is a filing strategy around a family of ideas, not 162 unrelated inventions. Read the full story: how Digital Global Systems built its AI patent portfolio.
Other top small-entity AI patent owners in 2025 include AtomBeam Technologies (61 AI grants) and individual inventor Vijay Madisetti (23). Sources: USPTO PatentsView and Open Data Portal; USPTO Official Gazette entry for patent US 12,538,134; digitalglobalsystems.com (checked September 30, 2026).
What this means if you run a small business
- You don’t need to be Google to get an AI patent. About one in four AI patent applications now comes from a small entity, and small entities pay lower patent office fees.
- Where you live matters less than it looks. A company can be based in one state and have its inventions counted in another. Remote teams make this more common.
- Thinking about where to set up? Compare the best states to start a business, LLC costs by state and new business numbers by state. For how big companies talk about AI, see AI in annual reports. For where AI’s power-hungry data centers are going, see the data center boom by state.
Cite or share this data
Reporters, researchers and state agencies are welcome to use the numbers and charts. Please credit and link to this page.
Source: StartBusinessByState.com analysis of USPTO PatentsView and Open Data Portal data. https://startbusinessbystate.com/ai-patents-by-state/
Embed the map:
<a href=”https://startbusinessbystate.com/ai-patents-by-state/”><img src=”https://startbusinessbystate.com/wp-content/uploads/2026/09/ai-patents-per-capita-map.png” alt=”AI patents per 100,000 residents by state, 2025″ width=”1200″></a><br>Source: StartBusinessByState.com analysis of USPTO PatentsView data
Methods and caveats
- What counts as AI. A U.S. utility patent (the standard kind that covers how something works) with at least one current patent class in G06N (machine learning and neural networks), G06F40 (language processing), G06V (image and video recognition) or G10L15 (speech recognition). A stricter “core AI” count using G06N alone is smaller: 13,786 grants in 2025 (all inventors, U.S. and foreign), down from 16,764 in 2023. The image class also catches some display and sensor hardware, which is why Samsung Display ranks high. We checked our definition against the USPTO’s own AI Patent Dataset for 2023: 93.1% of the patents we count as AI are AI there too.
- Grants. USPTO PatentsView bulk files (product PVGPATDIS), grants through December 31, 2025, file released April 10, 2026. Location is the first-listed inventor’s home state. U.S. total: 13,754.
- Applications. USPTO Open Data Portal patent file search, pulled September 30, 2026. A state is counted whenever any inventor on the application lives there, so these numbers overlap between states. They are never added to the grant numbers.
- Timing. Grants usually come two to three years after filing. Applications are usually published about 18 months after filing, and some are never published. So even the newest numbers look back in time.
- Where, exactly. Inventor home address is not the same as company headquarters or the lab where the work was done.
- Small entity. USPTO fee status (fewer than 500 employees including affiliates, plus universities, nonprofits and individual inventors). It is the current status on the file.
- Classes change. The patent office sometimes reclassifies older patents, which can move past counts. Our numbers are as of the dates above.
- Gaps. Alaska had 0 AI grants in 2022 and 2025, so it has no percent change.
- Population and metros. Census Vintage 2025 state population estimates. Metro areas use Census 2023 definitions; Connecticut uses 2020 definitions because patent data uses its old counties.
FAQ
What counts as an AI patent here?
A U.S. utility patent with at least one patent class for machine learning and neural networks (CPC G06N), language processing (G06F40), image and video recognition (G06V) or speech recognition (G10L15). The patent office sorts every patent into these classes. It is a narrower net than some other counts, but it is clear and easy to repeat.
Why do you count the first inventor?
Most patents list several inventors, sometimes in different states. Counting only the first-listed inventor gives each patent to one state, so the state numbers add up to the national total and nothing is counted twice.
Does a state's number mean companies there own the patents?
No. We count where the inventor lives, not where the company is based. A Virginia company can have its patents counted in Florida if its lead inventor lives in Florida. That is exactly what happened with Digital Global Systems.
Why are the newest grant numbers from 2025?
The patent office's cleaned-up inventor location files (PatentsView) run through December 31, 2025. They were released April 10, 2026. 2026 grants will be added when the next file comes out.
Why are grants down if AI is booming?
A patent is usually granted two to three years after someone applies. So 2025 grants mostly reflect ideas filed in 2021 to 2023. Grant counts also depend on how fast the patent office works. This data can't tell you why grants dipped.
What is a small entity?
It is a fee category at the patent office, not a survey of company size. Businesses with fewer than 500 employees (counting affiliates), universities, nonprofits and individual inventors can claim it and pay lower fees. Micro entities are a smaller group within it.
Can I use these numbers and charts?
Yes. Please credit StartBusinessByState.com and link to this page. The full state table is free to download as a CSV.