Census 2023 business counts, BLS jobs through Q1 2026, HMDA loans through 2025 · Updated by StartBusinessByState
Short answer: Most people who sell homes for a living run their own small business. They are paid as independent contractors, file their own taxes and often never hire anyone. This page counts those businesses state by state, compares them with payroll offices and home purchase loans, and shows where payroll jobs at brokerages rose or fell over the past year.
Key facts for reporters
- 824,003 nonemployer real estate agent and broker businesses had $52.4 billion in receipts in 2023, an average of $63,606 each (Census).
- 163,894 agent and broker offices had a payroll, with 395,264 employees (March 2023).
- Most agent businesses per resident: Florida (53.5), Colorado (43.2), Arizona (41.8), Nevada (40.4) per 10,000 people. Fewest: West Virginia (14.2), Mississippi (16.4), Iowa (17.8).
- Highest no-employee share: Connecticut (93.3%), Tennessee (92.7%), New Jersey (92.3%). Lowest: Colorado (70.6%), Montana (71.6%), Nebraska (72.4%).
- Payroll jobs at agent and broker offices averaged 325,707 in Q1 2026, -1.7% from 331,285 a year earlier. Jobs fell in 36 of 51 states (BLS QCEW).
- Lenders made 3,576,617 home purchase loans in 2025, +4.0% from 2023 (HMDA). That works out to 348 loans per 100 agent businesses in 2023, from a low of 167 in Hawaii to 685 in Iowa.
- BLS counts 193,370 salaried real estate sales agents (median pay $52,830) and 46,100 salaried brokers ($73,220), May 2025. Independent contractors are not in these counts.
Where agent businesses are most common
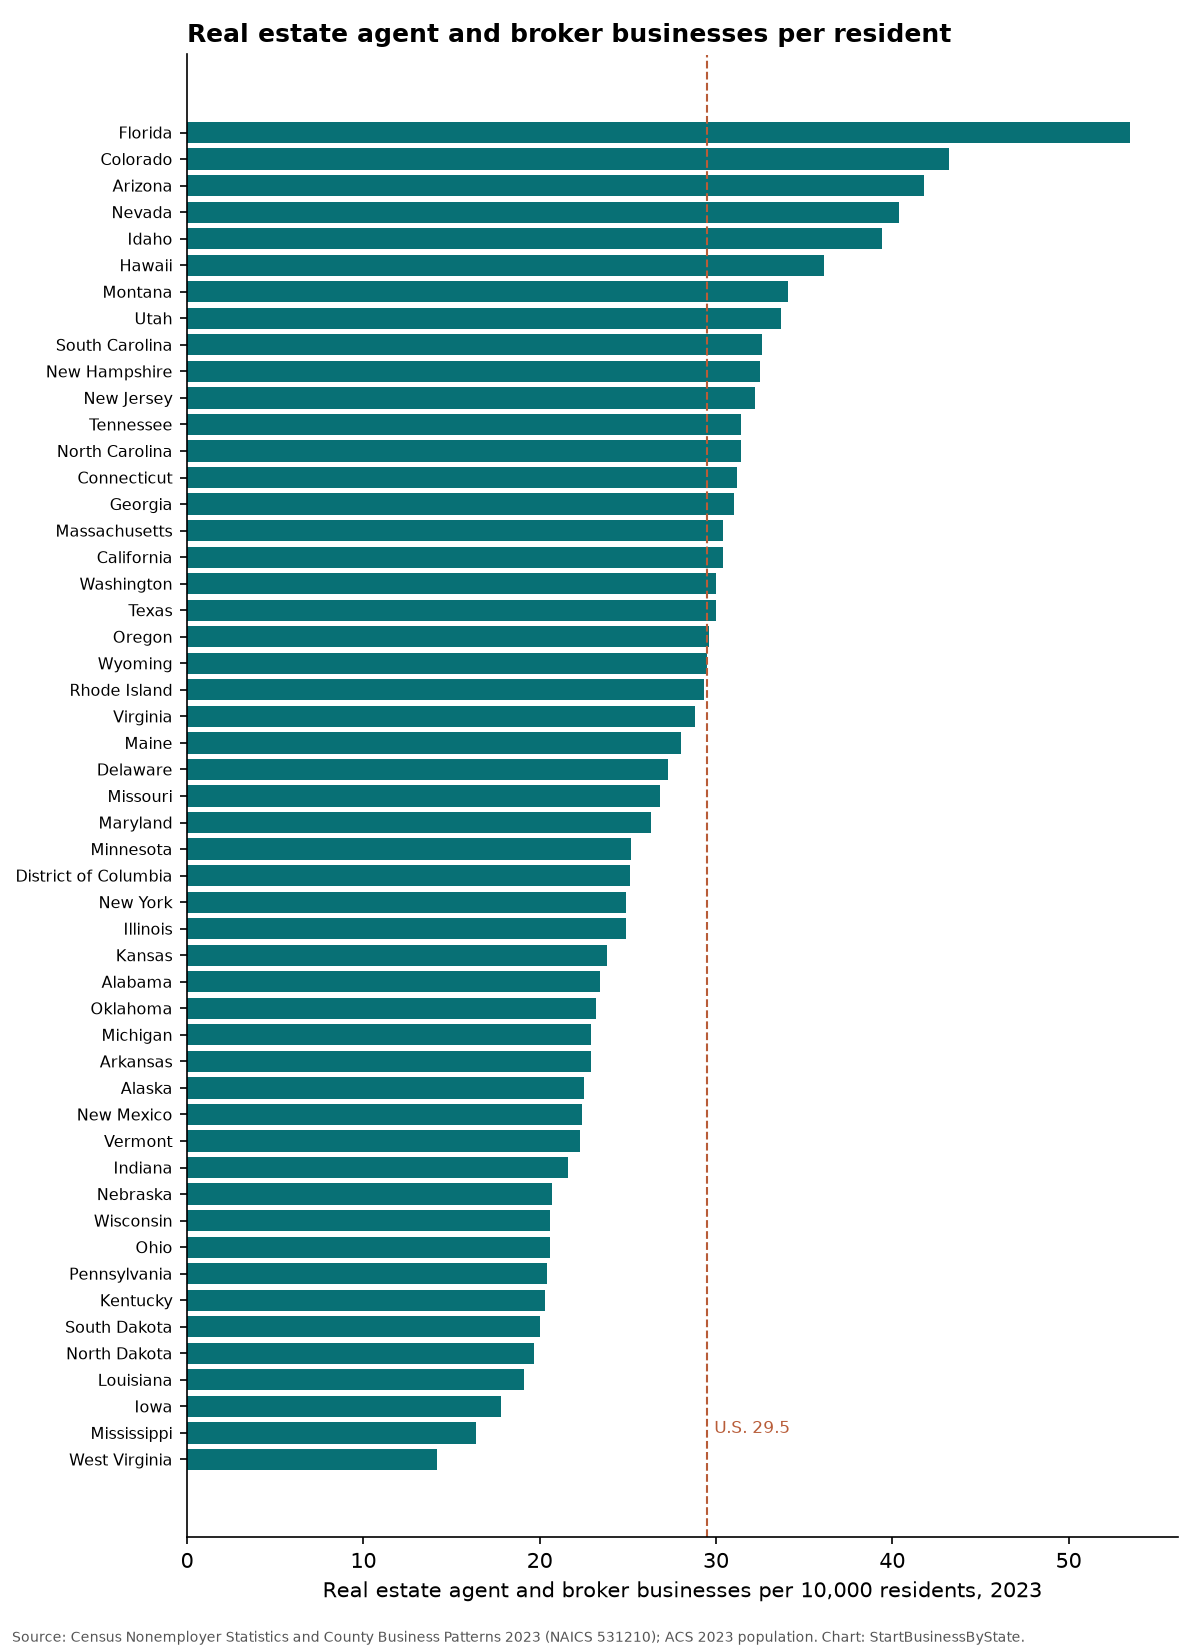
- Florida: 53.5 per 10,000 residents (120,948 businesses)
- Colorado: 43.2 per 10,000 residents (25,398 businesses)
- Arizona: 41.8 per 10,000 residents (31,074 businesses)
- Nevada: 40.4 per 10,000 residents (12,908 businesses)
- Idaho: 39.4 per 10,000 residents (7,743 businesses)
- Hawaii: 36.1 per 10,000 residents (5,183 businesses)
- Montana: 34.1 per 10,000 residents (3,868 businesses)
- Utah: 33.7 per 10,000 residents (11,514 businesses)
- South Carolina: 32.6 per 10,000 residents (17,514 businesses)
- New Hampshire: 32.5 per 10,000 residents (4,558 businesses)
Florida, Colorado, Arizona and Nevada all have more than 40 agent businesses per 10,000 people. A high count means more people hold a license and report income from it. It doesn’t mean each of them sells many homes.
Loans per agent business: a rough read on competition
HMDA counts home purchase loans reported by lenders. Dividing those by the number of agent businesses gives a rough idea of how many financed sales there are to go around. In 2023, Iowa had 685 purchase loans per 100 agent businesses and Hawaii had 167. Cash purchases aren’t in HMDA, so states with many cash buyers look more crowded than they are. A single sale can also involve two agents, one on each side.
Payroll jobs at brokerages
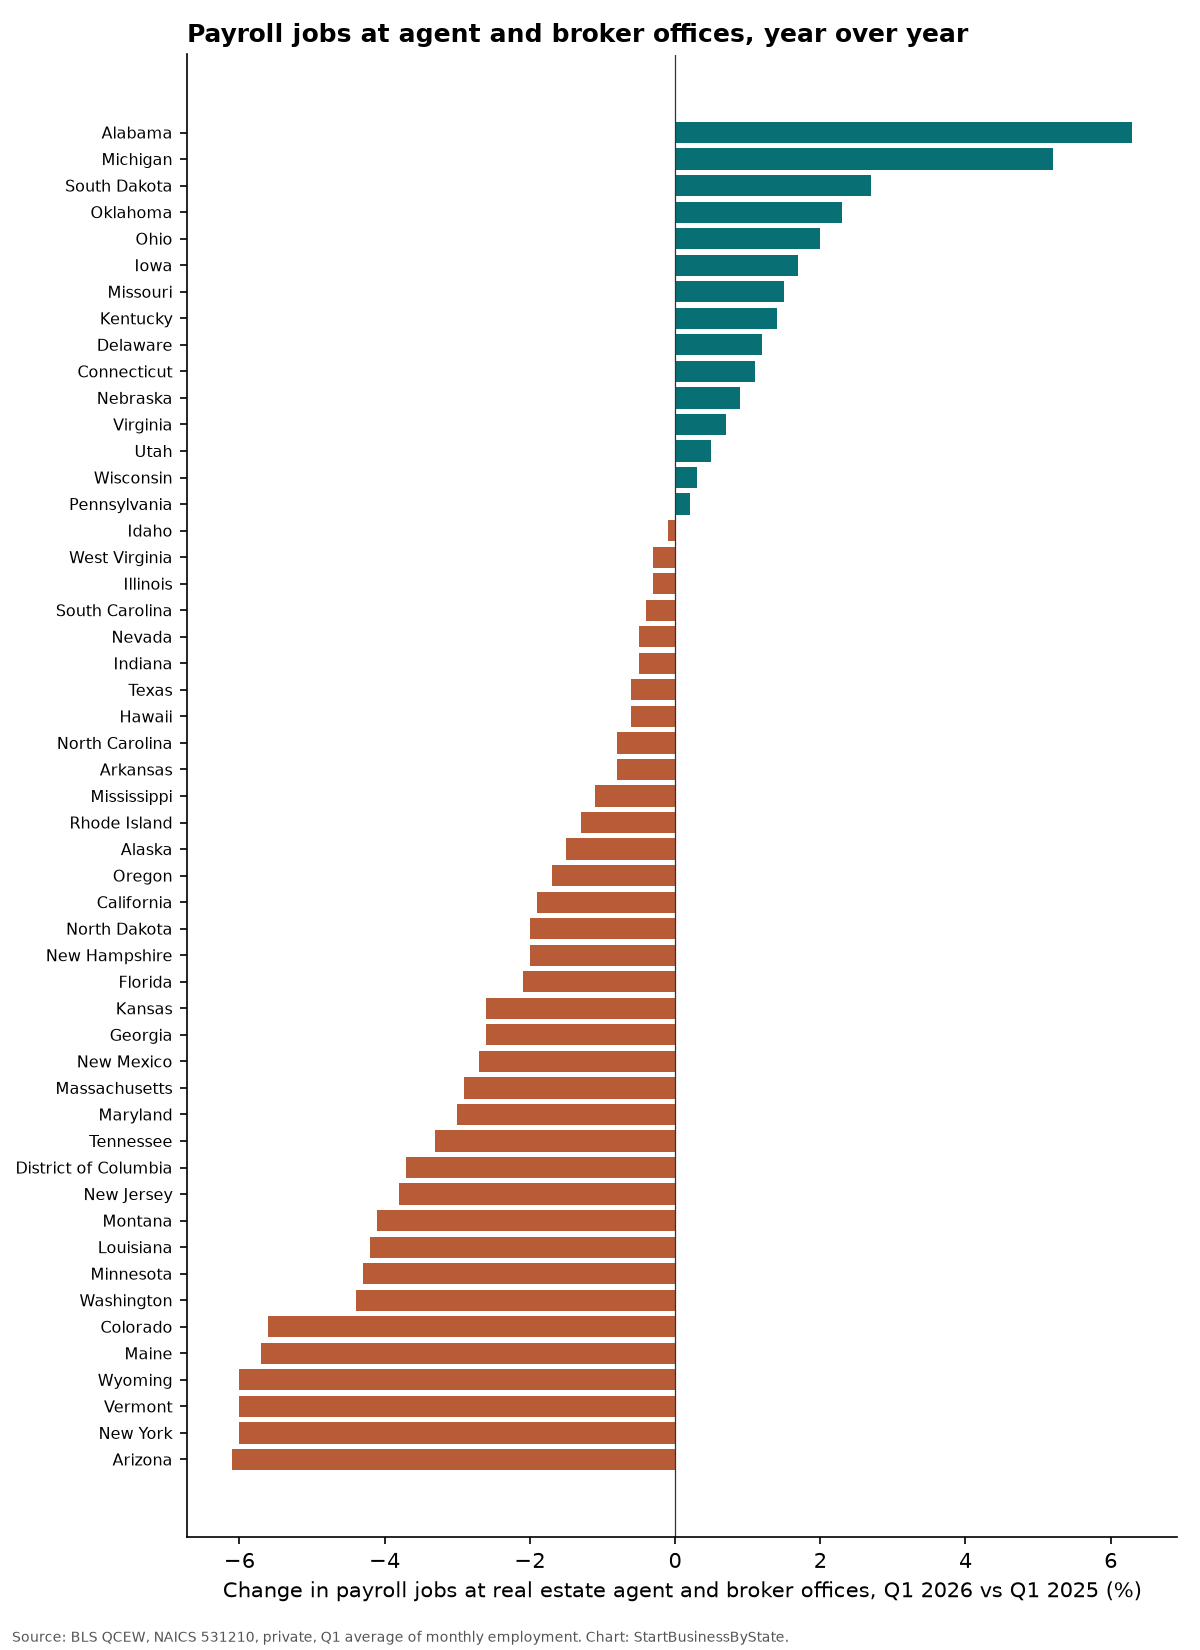
These are W-2 jobs at brokerages and agent offices: office staff, managers, transaction coordinators and agents on payroll. Payroll jobs fell 1.7% nationally while the number of offices with a payroll rose from 157,518 to 159,989. Average weekly pay rose from $1,826 to $1,910. The largest drops were in Arizona (-6.1%), New York (-6.0%), Vermont (-6.0%). The largest gains were in Alabama (+6.3%), Michigan (+5.2%), South Dakota (+2.7%).
Several things move these numbers, and the data can’t separate them: home sales volume, mortgage rates, brokerage mergers, and offices moving staff to contractor status.
Real estate agent and broker businesses by state
| State | Agent & broker businesses, 2023 | No employees | No-employee share | Per 10k residents | Avg receipts (no employees) | Purchase loans per 100 businesses, 2023 | Purchase loans 2025 vs 2023 | Payroll jobs, Q1 2026 | Jobs vs Q1 2025 | Median pay, salaried agents |
|---|---|---|---|---|---|---|---|---|---|---|
| U.S. total | 987,897 | 824,003 | 83.4% | 29.5 | $63,606 | 348 | +4.0% | 325,707 | -1.7% | $52,830 |
| Alabama | 11,944 | 10,362 | 86.8% | 23.4 | $59,620 | 497 | +7.0% | 3,771 | +6.3% | $60,890 |
| Alaska | 1,653 | 1,282 | 77.6% | 22.5 | $67,810 | 430 | +6.4% | 386 | -1.5% | $89,170 |
| Arizona | 31,074 | 24,805 | 79.8% | 41.8 | $61,385 | 294 | +3.9% | 9,638 | -6.1% | $58,780 |
| Arkansas | 7,014 | 5,869 | 83.7% | 22.9 | $58,771 | 509 | +8.1% | 2,192 | -0.8% | $38,180 |
| California | 118,480 | 95,922 | 81.0% | 30.4 | $69,284 | 207 | +5.2% | 50,301 | -1.9% | $57,560 |
| Colorado | 25,398 | 17,942 | 70.6% | 43.2 | $69,899 | 316 | +1.6% | 8,736 | -5.6% | $63,670 |
| Connecticut | 11,275 | 10,520 | 93.3% | 31.2 | $63,328 | 315 | +0.4% | 1,987 | +1.1% | $46,770 |
| Delaware | 2,817 | 2,400 | 85.2% | 27.3 | $61,481 | 474 | +5.5% | 1,386 | +1.2% | $47,180 |
| District of Columbia | 1,705 | 1,353 | 79.4% | 25.1 | $100,203 | 350 | -8.1% | 2,030 | -3.7% | $123,770 |
| Florida | 120,948 | 99,804 | 82.5% | 53.5 | $56,804 | 255 | -5.0% | 33,705 | -2.1% | $49,310 |
| Georgia | 34,147 | 27,920 | 81.8% | 31.0 | $55,762 | 373 | +1.6% | 11,888 | -2.6% | $46,730 |
| Hawaii | 5,183 | 4,589 | 88.5% | 36.1 | $85,538 | 167 | +14.6% | 1,527 | -0.6% | $46,220 |
| Idaho | 7,743 | 5,902 | 76.2% | 39.4 | $60,327 | 314 | +20.0% | 1,885 | -0.1% | $39,820 |
| Illinois | 31,254 | 26,321 | 84.2% | 24.9 | $53,997 | 410 | -1.2% | 10,755 | -0.3% | $59,220 |
| Indiana | 14,804 | 12,122 | 81.9% | 21.6 | $58,065 | 554 | +7.1% | 5,091 | -0.5% | $46,880 |
| Iowa | 5,705 | 4,510 | 79.1% | 17.8 | $64,749 | 685 | +7.1% | 1,836 | +1.7% | suppressed |
| Kansas | 6,996 | 5,678 | 81.2% | 23.8 | $64,665 | 442 | +7.7% | 1,902 | -2.6% | $39,770 |
| Kentucky | 9,174 | 7,724 | 84.2% | 20.3 | $61,066 | 512 | +10.1% | 2,878 | +1.4% | $58,610 |
| Louisiana | 8,724 | 7,568 | 86.7% | 19.1 | $47,219 | 466 | +1.6% | 2,027 | -4.2% | $45,850 |
| Maine | 3,902 | 3,088 | 79.1% | 28.0 | $63,311 | 378 | +11.2% | 1,085 | -5.7% | $56,930 |
| Maryland | 16,233 | 13,969 | 86.1% | 26.3 | $58,273 | 389 | +0.9% | 5,090 | -3.0% | $52,630 |
| Massachusetts | 21,272 | 18,913 | 88.9% | 30.4 | $76,954 | 275 | +7.5% | 6,434 | -2.9% | suppressed |
| Michigan | 23,000 | 20,452 | 88.9% | 22.9 | $62,578 | 446 | +4.6% | 6,613 | +5.2% | $57,880 |
| Minnesota | 14,476 | 11,229 | 77.6% | 25.2 | $62,007 | 452 | +5.5% | 3,808 | -4.3% | $46,410 |
| Mississippi | 4,820 | 4,243 | 88.0% | 16.4 | $61,914 | 570 | +9.2% | 1,059 | -1.1% | $39,550 |
| Missouri | 16,620 | 14,070 | 84.7% | 26.8 | $59,059 | 451 | +6.3% | 5,541 | +1.5% | $43,960 |
| Montana | 3,868 | 2,768 | 71.6% | 34.1 | $70,390 | 276 | +10.4% | 975 | -4.1% | $79,100 |
| Nebraska | 4,095 | 2,964 | 72.4% | 20.7 | $60,869 | 547 | +9.3% | 2,239 | +0.9% | $47,240 |
| Nevada | 12,908 | 10,613 | 82.2% | 40.4 | $63,797 | 293 | +2.0% | 5,183 | -0.5% | $79,990 |
| New Hampshire | 4,558 | 4,195 | 92.0% | 32.5 | $75,153 | 301 | +11.5% | 813 | -2.0% | $57,620 |
| New Jersey | 29,955 | 27,640 | 92.3% | 32.2 | $62,315 | 260 | +3.9% | 8,642 | -3.8% | $99,990 |
| New Mexico | 4,737 | 3,991 | 84.3% | 22.4 | $65,603 | 442 | +8.7% | 1,185 | -2.7% | $76,170 |
| New York | 48,674 | 42,090 | 86.5% | 24.9 | $68,992 | 236 | +4.3% | 19,177 | -6.0% | $102,990 |
| North Carolina | 34,018 | 27,138 | 79.8% | 31.4 | $58,998 | 423 | +4.0% | 15,428 | -0.8% | $51,240 |
| North Dakota | 1,548 | 1,175 | 75.9% | 19.7 | $67,598 | 502 | +7.8% | 435 | -2.0% | $73,920 |
| Ohio | 24,307 | 20,995 | 86.4% | 20.6 | $56,597 | 505 | +8.3% | 6,820 | +2.0% | $46,240 |
| Oklahoma | 9,416 | 7,802 | 82.9% | 23.2 | $54,824 | 479 | +4.9% | 2,531 | +2.3% | $47,980 |
| Oregon | 12,526 | 9,626 | 76.8% | 29.6 | $67,229 | 318 | +10.1% | 4,472 | -1.7% | $61,610 |
| Pennsylvania | 26,445 | 23,353 | 88.3% | 20.4 | $59,460 | 442 | +5.8% | 7,188 | +0.2% | $56,040 |
| Rhode Island | 3,214 | 2,796 | 87.0% | 29.3 | $63,762 | 288 | +14.7% | 898 | -1.3% | $60,310 |
| South Carolina | 17,514 | 14,177 | 80.9% | 32.6 | $59,871 | 450 | +8.4% | 5,892 | -0.4% | $56,580 |
| South Dakota | 1,840 | 1,384 | 75.2% | 20.0 | $67,960 | 505 | +6.4% | 697 | +2.7% | $65,170 |
| Tennessee | 22,368 | 20,731 | 92.7% | 31.4 | $79,680 | 393 | +3.9% | 5,783 | -3.3% | $46,250 |
| Texas | 91,576 | 80,171 | 87.5% | 30.0 | $68,119 | 388 | +0.2% | 28,471 | -0.6% | $45,740 |
| Utah | 11,514 | 8,343 | 72.5% | 33.7 | $62,198 | 346 | +11.0% | 3,817 | +0.5% | $50,720 |
| Vermont | 1,446 | 1,203 | 83.2% | 22.3 | $77,658 | 379 | +17.5% | 395 | -6.0% | suppressed |
| Virginia | 25,113 | 20,859 | 83.1% | 28.8 | $63,801 | 390 | +5.5% | 9,901 | +0.7% | $63,980 |
| Washington | 23,472 | 17,802 | 75.8% | 30.0 | $69,153 | 336 | +9.1% | 6,033 | -4.4% | $79,130 |
| West Virginia | 2,515 | 2,239 | 89.0% | 14.2 | $53,268 | 647 | +5.4% | 665 | -0.3% | $59,050 |
| Wisconsin | 12,188 | 10,117 | 83.0% | 20.6 | $63,881 | 493 | +11.0% | 4,141 | +0.3% | $58,120 |
| Wyoming | 1,721 | 1,274 | 74.0% | 29.5 | $82,383 | 369 | +15.3% | 377 | -6.0% | $49,990 |
“Suppressed” means BLS did not publish the figure for confidentiality or quality reasons. We leave these blank rather than estimate them. Salaried agent pay is missing for IA, MA, VT.
State-by-state takeaways
Alabama
Alabama had 11,944 agent and broker businesses in 2023, or 23.4 per 10,000 residents (rank 33 of 51). 86.8% had no employees, above the U.S. share of 83.4%. Lenders reported 497 home purchase loans per 100 of these businesses in 2023 (U.S. 348). Payroll jobs at agent and broker offices rose 6.3% from Q1 2025 to Q1 2026. Median pay for salaried sales agents: $60,890.
Alaska
Alaska had 1,653 agent and broker businesses in 2023, or 22.5 per 10,000 residents (rank 37 of 51). 77.6% had no employees, below the U.S. share of 83.4%. Lenders reported 430 home purchase loans per 100 of these businesses in 2023 (U.S. 348). Payroll jobs at agent and broker offices fell 1.5% from Q1 2025 to Q1 2026. Median pay for salaried sales agents: $89,170.
Arizona
Arizona had 31,074 agent and broker businesses in 2023, or 41.8 per 10,000 residents (rank 3 of 51). 79.8% had no employees, below the U.S. share of 83.4%. Lenders reported 294 home purchase loans per 100 of these businesses in 2023 (U.S. 348). Payroll jobs at agent and broker offices fell 6.1% from Q1 2025 to Q1 2026. Median pay for salaried sales agents: $58,780.
Arkansas
Arkansas had 7,014 agent and broker businesses in 2023, or 22.9 per 10,000 residents (rank 35 of 51). 83.7% had no employees, above the U.S. share of 83.4%. Lenders reported 509 home purchase loans per 100 of these businesses in 2023 (U.S. 348). Payroll jobs at agent and broker offices fell 0.8% from Q1 2025 to Q1 2026. Median pay for salaried sales agents: $38,180.
California
California had 118,480 agent and broker businesses in 2023, or 30.4 per 10,000 residents (rank 16 of 51). 81.0% had no employees, below the U.S. share of 83.4%. Lenders reported 207 home purchase loans per 100 of these businesses in 2023 (U.S. 348). Payroll jobs at agent and broker offices fell 1.9% from Q1 2025 to Q1 2026. Median pay for salaried sales agents: $57,560.
Colorado
Colorado had 25,398 agent and broker businesses in 2023, or 43.2 per 10,000 residents (rank 2 of 51). 70.6% had no employees, below the U.S. share of 83.4%. Lenders reported 316 home purchase loans per 100 of these businesses in 2023 (U.S. 348). Payroll jobs at agent and broker offices fell 5.6% from Q1 2025 to Q1 2026. Median pay for salaried sales agents: $63,670.
Connecticut
Connecticut had 11,275 agent and broker businesses in 2023, or 31.2 per 10,000 residents (rank 14 of 51). 93.3% had no employees, above the U.S. share of 83.4%. Lenders reported 315 home purchase loans per 100 of these businesses in 2023 (U.S. 348). Payroll jobs at agent and broker offices rose 1.1% from Q1 2025 to Q1 2026. Median pay for salaried sales agents: $46,770.
Delaware
Delaware had 2,817 agent and broker businesses in 2023, or 27.3 per 10,000 residents (rank 25 of 51). 85.2% had no employees, above the U.S. share of 83.4%. Lenders reported 474 home purchase loans per 100 of these businesses in 2023 (U.S. 348). Payroll jobs at agent and broker offices rose 1.2% from Q1 2025 to Q1 2026. Median pay for salaried sales agents: $47,180.
District of Columbia
District of Columbia had 1,705 agent and broker businesses in 2023, or 25.1 per 10,000 residents (rank 29 of 51). 79.4% had no employees, below the U.S. share of 83.4%. Lenders reported 350 home purchase loans per 100 of these businesses in 2023 (U.S. 348). Payroll jobs at agent and broker offices fell 3.7% from Q1 2025 to Q1 2026. Median pay for salaried sales agents: $123,770.
Florida
Florida had 120,948 agent and broker businesses in 2023, or 53.5 per 10,000 residents (rank 1 of 51). 82.5% had no employees, below the U.S. share of 83.4%. Lenders reported 255 home purchase loans per 100 of these businesses in 2023 (U.S. 348). Payroll jobs at agent and broker offices fell 2.1% from Q1 2025 to Q1 2026. Median pay for salaried sales agents: $49,310.
Georgia
Georgia had 34,147 agent and broker businesses in 2023, or 31.0 per 10,000 residents (rank 15 of 51). 81.8% had no employees, below the U.S. share of 83.4%. Lenders reported 373 home purchase loans per 100 of these businesses in 2023 (U.S. 348). Payroll jobs at agent and broker offices fell 2.6% from Q1 2025 to Q1 2026. Median pay for salaried sales agents: $46,730.
Hawaii
Hawaii had 5,183 agent and broker businesses in 2023, or 36.1 per 10,000 residents (rank 6 of 51). 88.5% had no employees, above the U.S. share of 83.4%. Lenders reported 167 home purchase loans per 100 of these businesses in 2023 (U.S. 348). Payroll jobs at agent and broker offices fell 0.6% from Q1 2025 to Q1 2026. Median pay for salaried sales agents: $46,220.
Idaho
Idaho had 7,743 agent and broker businesses in 2023, or 39.4 per 10,000 residents (rank 5 of 51). 76.2% had no employees, below the U.S. share of 83.4%. Lenders reported 314 home purchase loans per 100 of these businesses in 2023 (U.S. 348). Payroll jobs at agent and broker offices fell 0.1% from Q1 2025 to Q1 2026. Median pay for salaried sales agents: $39,820.
Illinois
Illinois had 31,254 agent and broker businesses in 2023, or 24.9 per 10,000 residents (rank 30 of 51). 84.2% had no employees, above the U.S. share of 83.4%. Lenders reported 410 home purchase loans per 100 of these businesses in 2023 (U.S. 348). Payroll jobs at agent and broker offices fell 0.3% from Q1 2025 to Q1 2026. Median pay for salaried sales agents: $59,220.
Indiana
Indiana had 14,804 agent and broker businesses in 2023, or 21.6 per 10,000 residents (rank 40 of 51). 81.9% had no employees, below the U.S. share of 83.4%. Lenders reported 554 home purchase loans per 100 of these businesses in 2023 (U.S. 348). Payroll jobs at agent and broker offices fell 0.5% from Q1 2025 to Q1 2026. Median pay for salaried sales agents: $46,880.
Iowa
Iowa had 5,705 agent and broker businesses in 2023, or 17.8 per 10,000 residents (rank 49 of 51). 79.1% had no employees, below the U.S. share of 83.4%. Lenders reported 685 home purchase loans per 100 of these businesses in 2023 (U.S. 348). Payroll jobs at agent and broker offices rose 1.7% from Q1 2025 to Q1 2026.
Kansas
Kansas had 6,996 agent and broker businesses in 2023, or 23.8 per 10,000 residents (rank 32 of 51). 81.2% had no employees, below the U.S. share of 83.4%. Lenders reported 442 home purchase loans per 100 of these businesses in 2023 (U.S. 348). Payroll jobs at agent and broker offices fell 2.6% from Q1 2025 to Q1 2026. Median pay for salaried sales agents: $39,770.
Kentucky
Kentucky had 9,174 agent and broker businesses in 2023, or 20.3 per 10,000 residents (rank 45 of 51). 84.2% had no employees, above the U.S. share of 83.4%. Lenders reported 512 home purchase loans per 100 of these businesses in 2023 (U.S. 348). Payroll jobs at agent and broker offices rose 1.4% from Q1 2025 to Q1 2026. Median pay for salaried sales agents: $58,610.
Louisiana
Louisiana had 8,724 agent and broker businesses in 2023, or 19.1 per 10,000 residents (rank 48 of 51). 86.7% had no employees, above the U.S. share of 83.4%. Lenders reported 466 home purchase loans per 100 of these businesses in 2023 (U.S. 348). Payroll jobs at agent and broker offices fell 4.2% from Q1 2025 to Q1 2026. Median pay for salaried sales agents: $45,850.
Maine
Maine had 3,902 agent and broker businesses in 2023, or 28.0 per 10,000 residents (rank 24 of 51). 79.1% had no employees, below the U.S. share of 83.4%. Lenders reported 378 home purchase loans per 100 of these businesses in 2023 (U.S. 348). Payroll jobs at agent and broker offices fell 5.7% from Q1 2025 to Q1 2026. Median pay for salaried sales agents: $56,930.
Maryland
Maryland had 16,233 agent and broker businesses in 2023, or 26.3 per 10,000 residents (rank 27 of 51). 86.1% had no employees, above the U.S. share of 83.4%. Lenders reported 389 home purchase loans per 100 of these businesses in 2023 (U.S. 348). Payroll jobs at agent and broker offices fell 3.0% from Q1 2025 to Q1 2026. Median pay for salaried sales agents: $52,630.
Massachusetts
Massachusetts had 21,272 agent and broker businesses in 2023, or 30.4 per 10,000 residents (rank 17 of 51). 88.9% had no employees, above the U.S. share of 83.4%. Lenders reported 275 home purchase loans per 100 of these businesses in 2023 (U.S. 348). Payroll jobs at agent and broker offices fell 2.9% from Q1 2025 to Q1 2026.
Michigan
Michigan had 23,000 agent and broker businesses in 2023, or 22.9 per 10,000 residents (rank 36 of 51). 88.9% had no employees, above the U.S. share of 83.4%. Lenders reported 446 home purchase loans per 100 of these businesses in 2023 (U.S. 348). Payroll jobs at agent and broker offices rose 5.2% from Q1 2025 to Q1 2026. Median pay for salaried sales agents: $57,880.
Minnesota
Minnesota had 14,476 agent and broker businesses in 2023, or 25.2 per 10,000 residents (rank 28 of 51). 77.6% had no employees, below the U.S. share of 83.4%. Lenders reported 452 home purchase loans per 100 of these businesses in 2023 (U.S. 348). Payroll jobs at agent and broker offices fell 4.3% from Q1 2025 to Q1 2026. Median pay for salaried sales agents: $46,410.
Mississippi
Mississippi had 4,820 agent and broker businesses in 2023, or 16.4 per 10,000 residents (rank 50 of 51). 88.0% had no employees, above the U.S. share of 83.4%. Lenders reported 570 home purchase loans per 100 of these businesses in 2023 (U.S. 348). Payroll jobs at agent and broker offices fell 1.1% from Q1 2025 to Q1 2026. Median pay for salaried sales agents: $39,550.
Missouri
Missouri had 16,620 agent and broker businesses in 2023, or 26.8 per 10,000 residents (rank 26 of 51). 84.7% had no employees, above the U.S. share of 83.4%. Lenders reported 451 home purchase loans per 100 of these businesses in 2023 (U.S. 348). Payroll jobs at agent and broker offices rose 1.5% from Q1 2025 to Q1 2026. Median pay for salaried sales agents: $43,960.
Montana
Montana had 3,868 agent and broker businesses in 2023, or 34.1 per 10,000 residents (rank 7 of 51). 71.6% had no employees, below the U.S. share of 83.4%. Lenders reported 276 home purchase loans per 100 of these businesses in 2023 (U.S. 348). Payroll jobs at agent and broker offices fell 4.1% from Q1 2025 to Q1 2026. Median pay for salaried sales agents: $79,100.
Nebraska
Nebraska had 4,095 agent and broker businesses in 2023, or 20.7 per 10,000 residents (rank 41 of 51). 72.4% had no employees, below the U.S. share of 83.4%. Lenders reported 547 home purchase loans per 100 of these businesses in 2023 (U.S. 348). Payroll jobs at agent and broker offices rose 0.9% from Q1 2025 to Q1 2026. Median pay for salaried sales agents: $47,240.
Nevada
Nevada had 12,908 agent and broker businesses in 2023, or 40.4 per 10,000 residents (rank 4 of 51). 82.2% had no employees, below the U.S. share of 83.4%. Lenders reported 293 home purchase loans per 100 of these businesses in 2023 (U.S. 348). Payroll jobs at agent and broker offices fell 0.5% from Q1 2025 to Q1 2026. Median pay for salaried sales agents: $79,990.
New Hampshire
New Hampshire had 4,558 agent and broker businesses in 2023, or 32.5 per 10,000 residents (rank 10 of 51). 92.0% had no employees, above the U.S. share of 83.4%. Lenders reported 301 home purchase loans per 100 of these businesses in 2023 (U.S. 348). Payroll jobs at agent and broker offices fell 2.0% from Q1 2025 to Q1 2026. Median pay for salaried sales agents: $57,620.
New Jersey
New Jersey had 29,955 agent and broker businesses in 2023, or 32.2 per 10,000 residents (rank 11 of 51). 92.3% had no employees, above the U.S. share of 83.4%. Lenders reported 260 home purchase loans per 100 of these businesses in 2023 (U.S. 348). Payroll jobs at agent and broker offices fell 3.8% from Q1 2025 to Q1 2026. Median pay for salaried sales agents: $99,990.
New Mexico
New Mexico had 4,737 agent and broker businesses in 2023, or 22.4 per 10,000 residents (rank 38 of 51). 84.3% had no employees, above the U.S. share of 83.4%. Lenders reported 442 home purchase loans per 100 of these businesses in 2023 (U.S. 348). Payroll jobs at agent and broker offices fell 2.7% from Q1 2025 to Q1 2026. Median pay for salaried sales agents: $76,170.
New York
New York had 48,674 agent and broker businesses in 2023, or 24.9 per 10,000 residents (rank 31 of 51). 86.5% had no employees, above the U.S. share of 83.4%. Lenders reported 236 home purchase loans per 100 of these businesses in 2023 (U.S. 348). Payroll jobs at agent and broker offices fell 6.0% from Q1 2025 to Q1 2026. Median pay for salaried sales agents: $102,990.
North Carolina
North Carolina had 34,018 agent and broker businesses in 2023, or 31.4 per 10,000 residents (rank 12 of 51). 79.8% had no employees, below the U.S. share of 83.4%. Lenders reported 423 home purchase loans per 100 of these businesses in 2023 (U.S. 348). Payroll jobs at agent and broker offices fell 0.8% from Q1 2025 to Q1 2026. Median pay for salaried sales agents: $51,240.
North Dakota
North Dakota had 1,548 agent and broker businesses in 2023, or 19.7 per 10,000 residents (rank 47 of 51). 75.9% had no employees, below the U.S. share of 83.4%. Lenders reported 502 home purchase loans per 100 of these businesses in 2023 (U.S. 348). Payroll jobs at agent and broker offices fell 2.0% from Q1 2025 to Q1 2026. Median pay for salaried sales agents: $73,920.
Ohio
Ohio had 24,307 agent and broker businesses in 2023, or 20.6 per 10,000 residents (rank 42 of 51). 86.4% had no employees, above the U.S. share of 83.4%. Lenders reported 505 home purchase loans per 100 of these businesses in 2023 (U.S. 348). Payroll jobs at agent and broker offices rose 2.0% from Q1 2025 to Q1 2026. Median pay for salaried sales agents: $46,240.
Oklahoma
Oklahoma had 9,416 agent and broker businesses in 2023, or 23.2 per 10,000 residents (rank 34 of 51). 82.9% had no employees, below the U.S. share of 83.4%. Lenders reported 479 home purchase loans per 100 of these businesses in 2023 (U.S. 348). Payroll jobs at agent and broker offices rose 2.3% from Q1 2025 to Q1 2026. Median pay for salaried sales agents: $47,980.
Oregon
Oregon had 12,526 agent and broker businesses in 2023, or 29.6 per 10,000 residents (rank 20 of 51). 76.8% had no employees, below the U.S. share of 83.4%. Lenders reported 318 home purchase loans per 100 of these businesses in 2023 (U.S. 348). Payroll jobs at agent and broker offices fell 1.7% from Q1 2025 to Q1 2026. Median pay for salaried sales agents: $61,610.
Pennsylvania
Pennsylvania had 26,445 agent and broker businesses in 2023, or 20.4 per 10,000 residents (rank 44 of 51). 88.3% had no employees, above the U.S. share of 83.4%. Lenders reported 442 home purchase loans per 100 of these businesses in 2023 (U.S. 348). Payroll jobs at agent and broker offices rose 0.2% from Q1 2025 to Q1 2026. Median pay for salaried sales agents: $56,040.
Rhode Island
Rhode Island had 3,214 agent and broker businesses in 2023, or 29.3 per 10,000 residents (rank 22 of 51). 87.0% had no employees, above the U.S. share of 83.4%. Lenders reported 288 home purchase loans per 100 of these businesses in 2023 (U.S. 348). Payroll jobs at agent and broker offices fell 1.3% from Q1 2025 to Q1 2026. Median pay for salaried sales agents: $60,310.
South Carolina
South Carolina had 17,514 agent and broker businesses in 2023, or 32.6 per 10,000 residents (rank 9 of 51). 80.9% had no employees, below the U.S. share of 83.4%. Lenders reported 450 home purchase loans per 100 of these businesses in 2023 (U.S. 348). Payroll jobs at agent and broker offices fell 0.4% from Q1 2025 to Q1 2026. Median pay for salaried sales agents: $56,580.
South Dakota
South Dakota had 1,840 agent and broker businesses in 2023, or 20.0 per 10,000 residents (rank 46 of 51). 75.2% had no employees, below the U.S. share of 83.4%. Lenders reported 505 home purchase loans per 100 of these businesses in 2023 (U.S. 348). Payroll jobs at agent and broker offices rose 2.7% from Q1 2025 to Q1 2026. Median pay for salaried sales agents: $65,170.
Tennessee
Tennessee had 22,368 agent and broker businesses in 2023, or 31.4 per 10,000 residents (rank 13 of 51). 92.7% had no employees, above the U.S. share of 83.4%. Lenders reported 393 home purchase loans per 100 of these businesses in 2023 (U.S. 348). Payroll jobs at agent and broker offices fell 3.3% from Q1 2025 to Q1 2026. Median pay for salaried sales agents: $46,250.
Texas
Texas had 91,576 agent and broker businesses in 2023, or 30.0 per 10,000 residents (rank 18 of 51). 87.5% had no employees, above the U.S. share of 83.4%. Lenders reported 388 home purchase loans per 100 of these businesses in 2023 (U.S. 348). Payroll jobs at agent and broker offices fell 0.6% from Q1 2025 to Q1 2026. Median pay for salaried sales agents: $45,740.
Utah
Utah had 11,514 agent and broker businesses in 2023, or 33.7 per 10,000 residents (rank 8 of 51). 72.5% had no employees, below the U.S. share of 83.4%. Lenders reported 346 home purchase loans per 100 of these businesses in 2023 (U.S. 348). Payroll jobs at agent and broker offices rose 0.5% from Q1 2025 to Q1 2026. Median pay for salaried sales agents: $50,720.
Vermont
Vermont had 1,446 agent and broker businesses in 2023, or 22.3 per 10,000 residents (rank 39 of 51). 83.2% had no employees, below the U.S. share of 83.4%. Lenders reported 379 home purchase loans per 100 of these businesses in 2023 (U.S. 348). Payroll jobs at agent and broker offices fell 6.0% from Q1 2025 to Q1 2026.
Virginia
Virginia had 25,113 agent and broker businesses in 2023, or 28.8 per 10,000 residents (rank 23 of 51). 83.1% had no employees, below the U.S. share of 83.4%. Lenders reported 390 home purchase loans per 100 of these businesses in 2023 (U.S. 348). Payroll jobs at agent and broker offices rose 0.7% from Q1 2025 to Q1 2026. Median pay for salaried sales agents: $63,980.
Washington
Washington had 23,472 agent and broker businesses in 2023, or 30.0 per 10,000 residents (rank 19 of 51). 75.8% had no employees, below the U.S. share of 83.4%. Lenders reported 336 home purchase loans per 100 of these businesses in 2023 (U.S. 348). Payroll jobs at agent and broker offices fell 4.4% from Q1 2025 to Q1 2026. Median pay for salaried sales agents: $79,130.
West Virginia
West Virginia had 2,515 agent and broker businesses in 2023, or 14.2 per 10,000 residents (rank 51 of 51). 89.0% had no employees, above the U.S. share of 83.4%. Lenders reported 647 home purchase loans per 100 of these businesses in 2023 (U.S. 348). Payroll jobs at agent and broker offices fell 0.3% from Q1 2025 to Q1 2026. Median pay for salaried sales agents: $59,050.
Wisconsin
Wisconsin had 12,188 agent and broker businesses in 2023, or 20.6 per 10,000 residents (rank 43 of 51). 83.0% had no employees, below the U.S. share of 83.4%. Lenders reported 493 home purchase loans per 100 of these businesses in 2023 (U.S. 348). Payroll jobs at agent and broker offices rose 0.3% from Q1 2025 to Q1 2026. Median pay for salaried sales agents: $58,120.
Wyoming
Wyoming had 1,721 agent and broker businesses in 2023, or 29.5 per 10,000 residents (rank 21 of 51). 74.0% had no employees, below the U.S. share of 83.4%. Lenders reported 369 home purchase loans per 100 of these businesses in 2023 (U.S. 348). Payroll jobs at agent and broker offices fell 6.0% from Q1 2025 to Q1 2026. Median pay for salaried sales agents: $49,990.
If you are starting out
If you are entering real estate sales, our guide to becoming a real estate agent connects licensing, startup costs and first-client work. Use the interview worksheet to compare brokerages before committing to a fee schedule and support arrangement.
A new agent usually works under a licensed broker and gets paid as a contractor, so the business side is yours to set up. That often means a separate bank account, quarterly estimated taxes, errors and omissions coverage and, for some agents, an LLC. Licensing rules vary by state; see business license requirements by state. If you are weighing an LLC, see LLC costs by state. Health coverage is often the biggest surprise for new contractors: see ACA premiums for the self-employed by state.
Related data
See service businesses without employees, sole proprietor profit by state, home prices vs. home services jobs and housing permits vs. builder jobs by state.
Methods and limits
- Businesses without employees: Census Nonemployer Statistics 2023, NAICS 53121 (offices of real estate agents and brokers). A nonemployer business has no paid employees and at least $1,000 in receipts. Most are sole proprietors filing a Schedule C. One person can own more than one, and someone licensed but inactive won’t appear.
- Offices with a payroll: Census County Business Patterns 2023, NAICS 531210, establishments and mid-March employment.
- No-employee share = nonemployer businesses ÷ (nonemployer businesses + employer establishments).
- Per 10,000 residents uses the Census ACS 2023 one-year population estimate.
- Home purchase loans: HMDA (CFPB/FFIEC Data Browser), originated loans with loan purpose = home purchase, all property and occupancy types, 2023 and 2025. HMDA covers most mortgage lenders but not cash sales. Loans per 100 businesses uses 2023 loans and 2023 business counts so the years match.
- Payroll jobs: BLS QCEW, NAICS 531210, private ownership, average of the three monthly employment counts in Q1 2025 and Q1 2026. Q1 is the slow season, so compare Q1 with Q1 only.
- Pay: BLS Occupational Employment and Wage Statistics, May 2025, for occupations 41-9022 (real estate sales agents) and 41-9021 (brokers). OEWS covers employees only, so commission-only contractors are excluded.
- These federal counts differ from trade group membership, which includes people who don’t report agent income and leaves out licensees who aren’t members.
Sources
- U.S. Census Bureau, Nonemployer Statistics 2023 (API)
- U.S. Census Bureau, County Business Patterns 2023 (API)
- BLS Quarterly Census of Employment and Wages (open data files)
- BLS Occupational Employment and Wage Statistics, May 2025 (API)
- CFPB/FFIEC HMDA Data Browser (API)
- U.S. Census Bureau, American Community Survey 2023 one-year population (API)
Cite this data
Reporters and bloggers may use these numbers and charts. Please credit StartBusinessByState and link to this page.
Source: StartBusinessByState, “Real Estate Agents by State: Self-Employed vs. Payroll (2026 Data),” https://startbusinessbystate.com/real-estate-agents-by-state/ (updated October 7, 2026).
FAQ
How many real estate agents are self-employed?
Census counted 824,003 real estate agent and broker businesses with no employees in 2023, 83.4% of all 987,897 agent and broker businesses. Most are one-person businesses run by agents paid as contractors.
Which state has the most real estate agents per person?
Florida, with 53.5 agent and broker businesses per 10,000 residents in 2023. Colorado (43.2) and Arizona (41.8) were next. West Virginia had the fewest (14.2).
How much do self-employed real estate agents make?
Nonemployer agent businesses averaged $63,606 in receipts in 2023. That is revenue before expenses such as broker splits, fees and marketing, not take-home pay.
Are real estate jobs declining?
Payroll jobs at agent and broker offices fell 1.7% from Q1 2025 to Q1 2026 (BLS QCEW) and dropped in 36 states. Most agents are contractors, so these figures cover brokerage employees, not all agents.
Where is this data from?
Census Nonemployer Statistics and County Business Patterns, BLS QCEW and OEWS, and HMDA loan records from the CFPB. All of it was pulled from official APIs or data files.
Last updated October 7, 2026 by StartBusinessByState.