By StartBusinessByStatePublisher: Robert SmithResearch process
Original research · IRS SOI nonfarm sole proprietorships · Tax Year 2023 · Published September 16, 2026
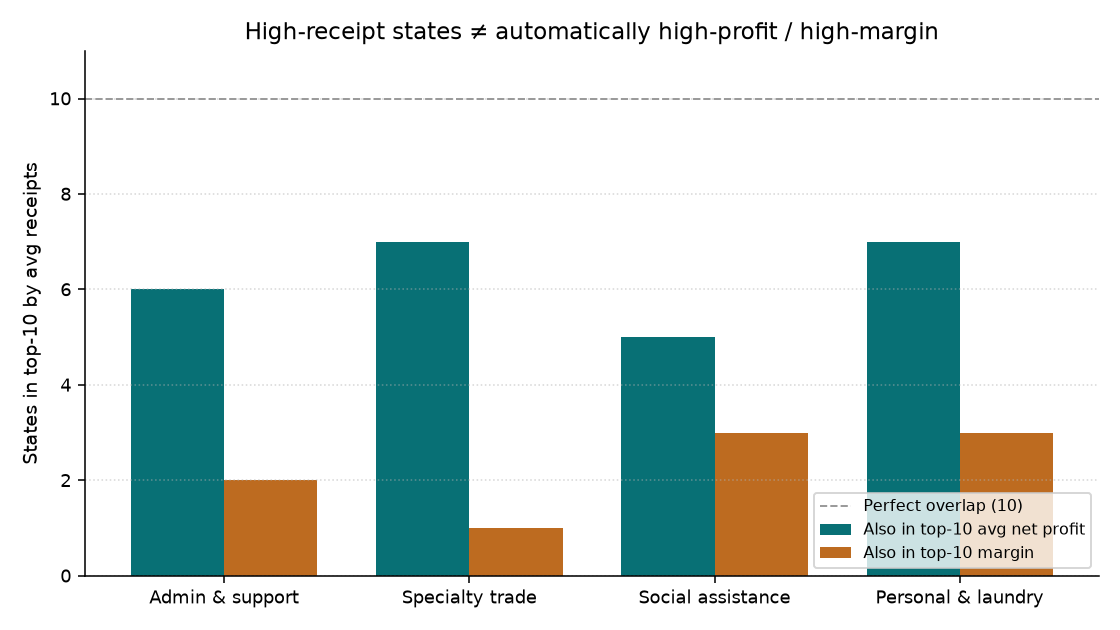
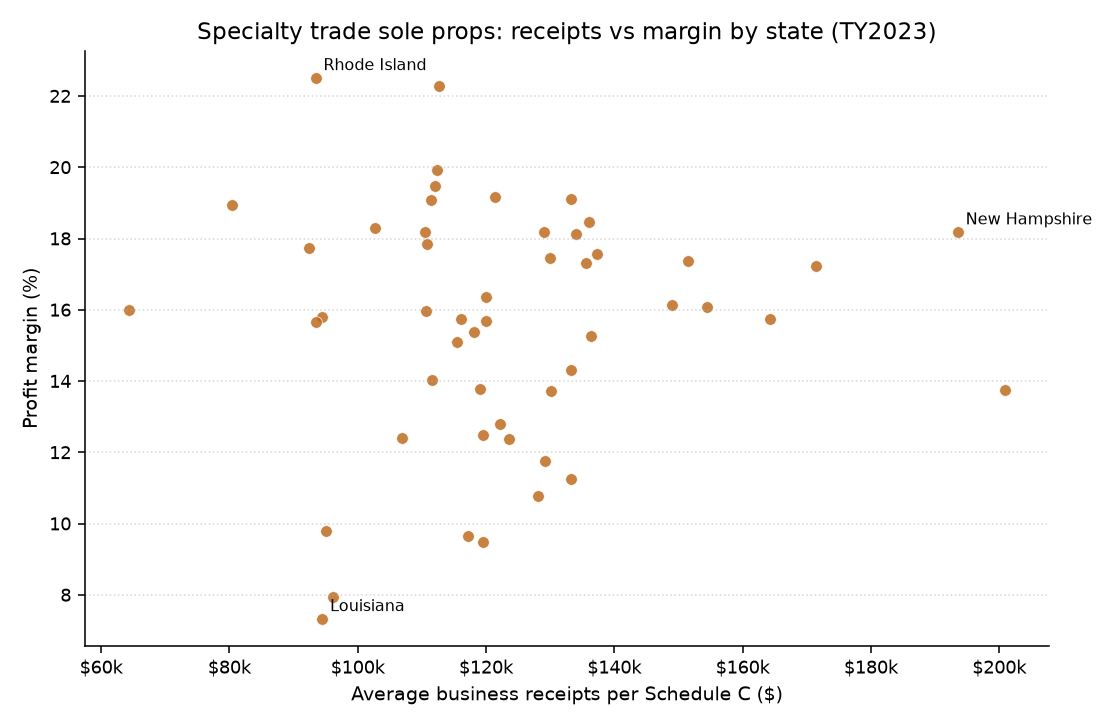
State averages from IRS SOI — not a Schedule C tutorial. This page maps IRS Statistics of Income (SOI) averages of Schedule C net profit and margins by state × 3-digit industry for tax year 2023. Receipts are not profit: across admin/support, specialty trades, social assistance, and personal/laundry services, states with the highest average receipts frequently miss the top tier for average net profit — and miss the top tier for margin even more often. For specialty trade contractors, only 1 of 10 high-receipt states also ranks in the top 10 for profit margin (receipts↔margin correlation across states is essentially zero). Not tax advice and not a Form 1040 / Schedule C how-to — a published SOI averages map, not a “best state” score.
Related: Partnership Form 1065 ordinary income by state.
We use IRS Statistics of Income unincorporated business state tables for Tax Year 2023. Metrics: average net profit (Schedule C line 31 ÷ number of Schedules C) and margin (net profit ÷ business receipts). The finest published state×industry grain is 3-digit NAICS — cleaning, landscaping, HVAC, daycare, and salons cannot be isolated. Complementary site research: cleaning business revenue, nonemployer share by state, and employer pay by state.
For employer-firm credit applications and receipt (ABS — not Schedule C), see employer credit access (ABS).
Key findings
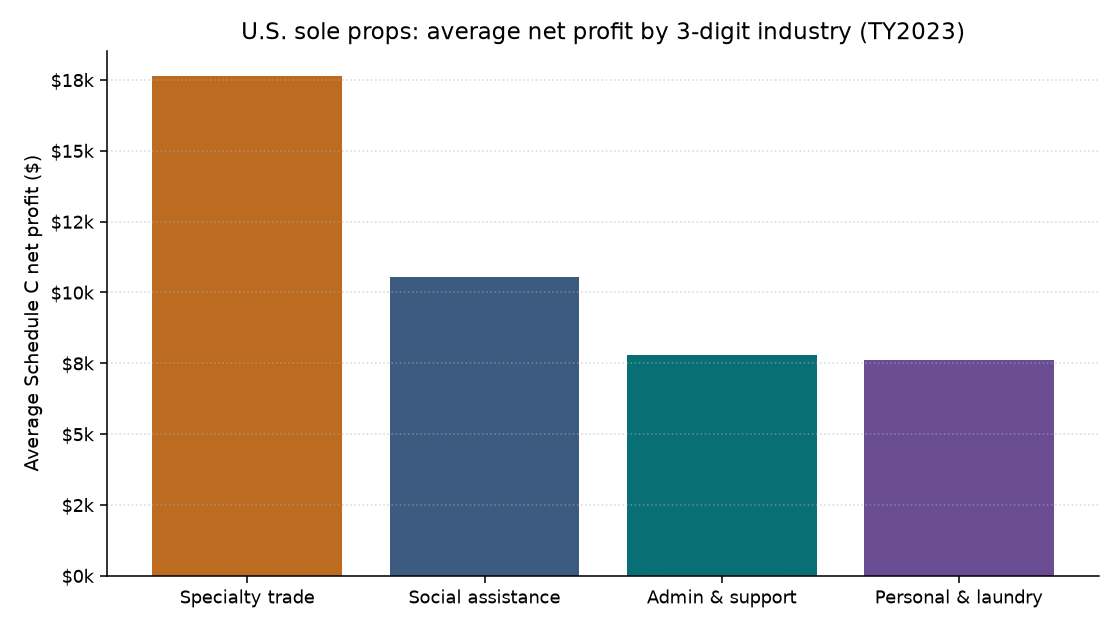
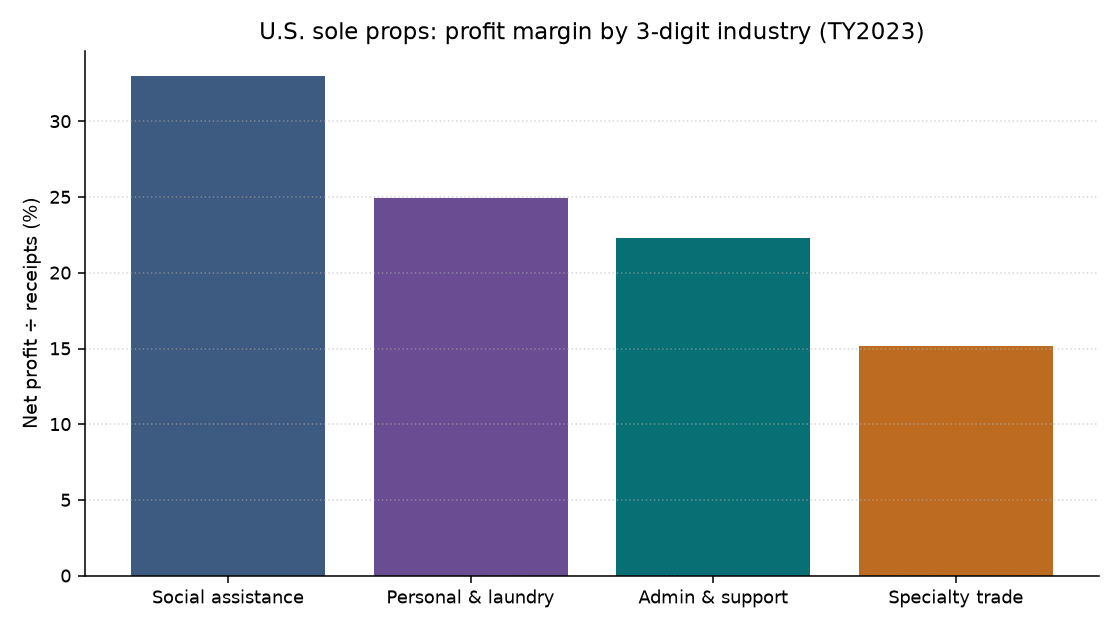
- U.S. average net profit ladder (TY2023): specialty trade $17,644 → social assistance $10,537 → admin & support $7,791 → personal & laundry $7,603. Margin order differs: social assistance leads at 33.0%, specialty trade trails at 15.1%.
- Hypothesis supported — high receipts ≠ high margin. Among the 10 states with the highest average receipts, specialty trade keeps only 1/10 in the top-10 margin list (Spearman receipts↔margin -0.01). Admin & support keeps just 2/10 on margin.
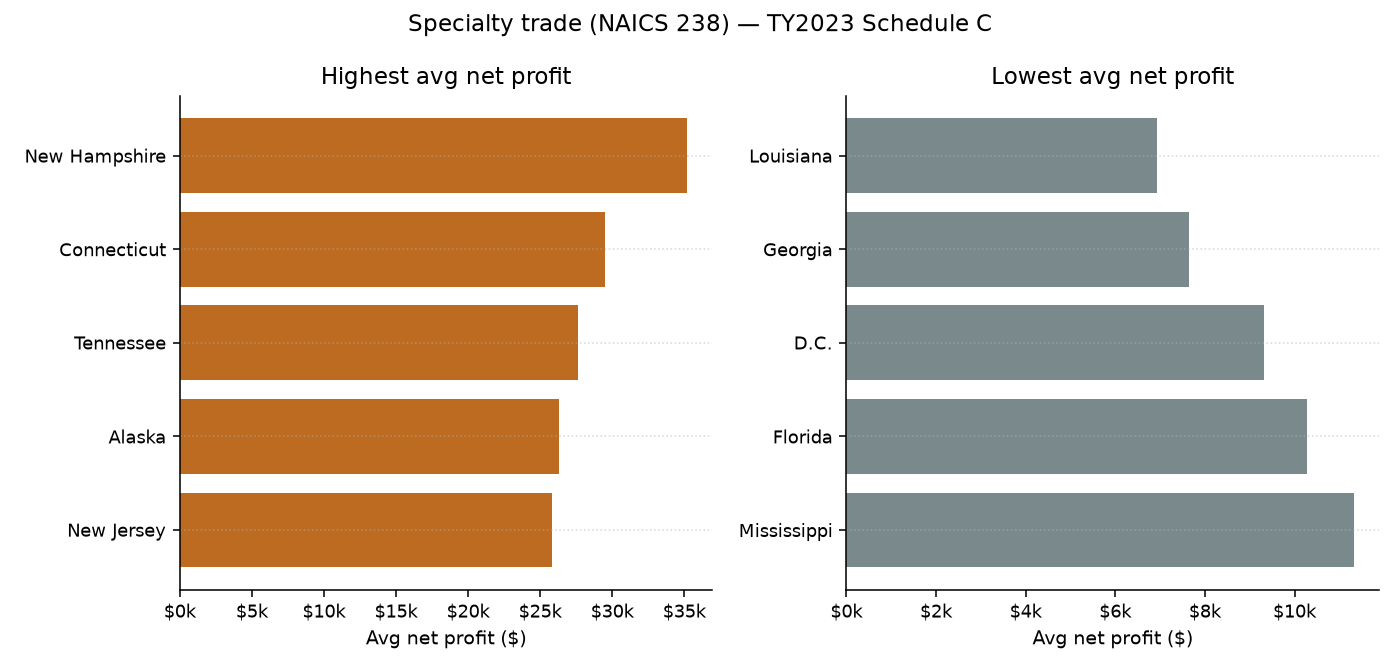
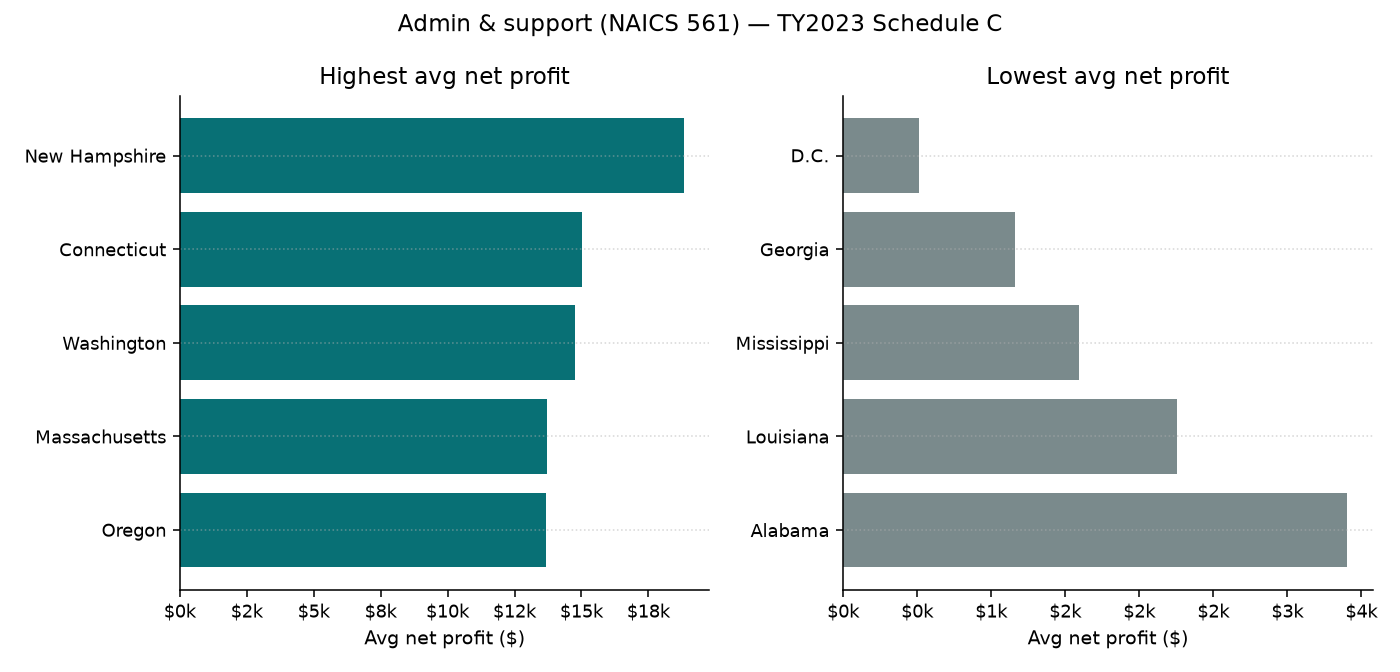
- State spreads are large inside the same code. Specialty trade average net runs from $6,924 (Louisiana) to $35,192 (New Hampshire). Admin & support margin spans 30.8 pp (D.C. low → New York high).
- Sole props ≠ partnerships. U.S. partnership ordinary-income margins for these same 3-digit codes sit around 5–8%, far below Schedule C margins — different entities and income definitions.
- Codes are coarse on purpose (IRS limit).
561bundles cleaning with landscaping and other admin/support;238bundles HVAC with other specialty trades;624and812similarly exceed daycare-only and salon-only. Read every cell as the published rollup.
U.S. baselines and state ranges
| Industry | NAICS | Schedules C | U.S. avg net | U.S. margin | Avg-net state spread | Margin spread | Highest avg net | Lowest avg net |
|---|---|---|---|---|---|---|---|---|
| Specialty Trade Contractors | 238 | 1,642,731 | $17,644 | 15.1% | $28,268 | 15.2 pp | New Hampshire ($35,192) | Louisiana ($6,924) |
| Social Assistance | 624 | 634,270 | $10,537 | 33.0% | $15,793 | 28.4 pp | Washington ($19,822) | Georgia ($4,029) |
| Administrative and Support Services | 561 | 2,369,412 | $7,791 | 22.3% | $18,318 | 30.8 pp | New Hampshire ($18,829) | District of Columbia ($511) |
| Personal and Laundry Services | 812 | 3,206,941 | $7,603 | 24.9% | $14,154 | 26.0 pp | New Hampshire ($16,480) | Georgia ($2,326) |
Not a ranking of “best states.” Higher average net profit can reflect mix, costs, part-time intensity, or filing patterns — not a recommendation to relocate.
Receipts ≠ profit (and ≠ margin)
An average also hides how many businesses have no positive income at all. The IRS business no-profit comparison measures that share by industry using the separate 2023 national tables.
Average receipts and average net profit move together more than receipts and margin do. That matters for planning: a state can look “busy” on revenue while keeping less of each dollar after expenses.
Health insurance is a big cost that comes out of that profit for many sole owners. Our state table shows 2027 ACA premium increases for self-employed owners.
Charts
State × industry table
Filter by industry or search a state. State names link to the closest StartBusinessByState industry guide for that rollup (cleaning guide for admin/support; HVAC for specialty trade; daycare for social assistance; salon for personal/laundry). Download the full CSV: sole-prop-profit-by-state-2023.csv.
| State | Industry | Schedules C | Avg receipts | Avg net profit | Avg-net rank | Margin | Margin rank |
|---|---|---|---|---|---|---|---|
| New Hampshire | Admin & support | 7,834 | $79,474 | $18,829 | 1 | 23.7% | 26 |
| Connecticut | Admin & support | 23,382 | $59,564 | $15,010 | 2 | 25.2% | 21 |
| Washington | Admin & support | 33,180 | $46,962 | $14,749 | 3 | 31.4% | 4 |
| Massachusetts | Admin & support | 45,392 | $44,026 | $13,713 | 4 | 31.1% | 5 |
| Oregon | Admin & support | 20,186 | $43,035 | $13,679 | 5 | 31.8% | 3 |
| Hawaii | Admin & support | 9,532 | $45,049 | $12,365 | 6 | 27.4% | 15 |
| Vermont | Admin & support | 4,478 | $43,074 | $12,214 | 7 | 28.4% | 11 |
| Colorado | Admin & support | 40,256 | $39,621 | $12,036 | 8 | 30.4% | 8 |
| California | Admin & support | 259,521 | $38,525 | $11,938 | 9 | 31.0% | 6 |
| New Jersey | Admin & support | 51,416 | $55,075 | $11,863 | 10 | 21.5% | 36 |
| Pennsylvania | Admin & support | 59,986 | $49,767 | $11,623 | 11 | 23.4% | 27 |
| South Dakota | Admin & support | 4,446 | $42,185 | $11,414 | 12 | 27.1% | 17 |
| Rhode Island | Admin & support | 5,766 | $36,755 | $11,296 | 13 | 30.7% | 7 |
| Minnesota | Admin & support | 23,712 | $40,310 | $11,221 | 14 | 27.8% | 12 |
| New York | Admin & support | 96,328 | $34,299 | $11,142 | 15 | 32.5% | 1 |
| Arizona | Admin & support | 48,424 | $41,431 | $10,869 | 16 | 26.2% | 18 |
| Maine | Admin & support | 8,777 | $39,769 | $10,832 | 17 | 27.2% | 16 |
| Montana | Admin & support | 6,362 | $33,649 | $10,700 | 18 | 31.8% | 2 |
| Alaska | Admin & support | 3,589 | $41,834 | $10,239 | 19 | 24.5% | 23 |
| New Mexico | Admin & support | 8,969 | $33,177 | $9,997 | 20 | 30.1% | 9 |
| Wyoming | Admin & support | 3,638 | $33,970 | $9,856 | 21 | 29.0% | 10 |
| Delaware | Admin & support | 5,527 | $44,496 | $9,614 | 22 | 21.6% | 35 |
| Idaho | Admin & support | 10,677 | $34,440 | $9,526 | 23 | 27.7% | 14 |
| Tennessee | Admin & support | 63,171 | $53,263 | $9,478 | 24 | 17.8% | 42 |
| Kansas | Admin & support | 15,127 | $34,093 | $9,446 | 25 | 27.7% | 13 |
| Nebraska | Admin & support | 10,135 | $38,875 | $8,993 | 26 | 23.1% | 29 |
| Ohio | Admin & support | 67,129 | $39,576 | $8,927 | 27 | 22.6% | 31 |
| North Dakota | Admin & support | 3,491 | $34,507 | $8,387 | 28 | 24.3% | 25 |
| Iowa | Admin & support | 14,130 | $33,871 | $8,351 | 29 | 24.7% | 22 |
| West Virginia | Admin & support | 6,422 | $37,214 | $8,290 | 30 | 22.3% | 33 |
| Missouri | Admin & support | 33,472 | $39,406 | $7,951 | 31 | 20.2% | 39 |
| Indiana | Admin & support | 36,392 | $30,964 | $7,857 | 32 | 25.4% | 20 |
| Kentucky | Admin & support | 25,916 | $31,707 | $7,751 | 33 | 24.4% | 24 |
| North Carolina | Admin & support | 84,894 | $31,855 | $7,385 | 34 | 23.2% | 28 |
| Oklahoma | Admin & support | 27,413 | $34,994 | $7,313 | 35 | 20.9% | 37 |
| Illinois | Admin & support | 75,014 | $27,795 | $7,201 | 36 | 25.9% | 19 |
| Virginia | Admin & support | 60,512 | $31,548 | $7,106 | 37 | 22.5% | 32 |
| Michigan | Admin & support | 60,600 | $35,116 | $6,947 | 38 | 19.8% | 40 |
| Utah | Admin & support | 17,826 | $33,428 | $6,905 | 39 | 20.7% | 38 |
| Maryland | Admin & support | 49,571 | $33,473 | $6,374 | 40 | 19.0% | 41 |
| Wisconsin | Admin & support | 22,978 | $50,769 | $6,212 | 41 | 12.2% | 46 |
| Arkansas | Admin & support | 20,338 | $25,753 | $5,898 | 42 | 22.9% | 30 |
| South Carolina | Admin & support | 44,823 | $32,623 | $5,677 | 43 | 17.4% | 43 |
| Florida | Admin & support | 276,972 | $25,683 | $5,621 | 44 | 21.9% | 34 |
| Nevada | Admin & support | 24,822 | $31,684 | $5,037 | 45 | 15.9% | 44 |
| Texas | Admin & support | 294,258 | $31,280 | $4,600 | 46 | 14.7% | 45 |
| Alabama | Admin & support | 46,177 | $28,835 | $3,405 | 47 | 11.8% | 47 |
| Louisiana | Admin & support | 44,078 | $26,614 | $2,256 | 48 | 8.5% | 48 |
| Mississippi | Admin & support | 28,296 | $24,535 | $1,594 | 49 | 6.5% | 49 |
| Georgia | Admin & support | 130,672 | $25,350 | $1,158 | 50 | 4.6% | 50 |
| District of Columbia | Admin & support | 3,405 | $31,259 | $511 | 51 | 1.6% | 51 |
| New Hampshire | Personal & laundry | 10,449 | $54,093 | $16,480 | 1 | 30.5% | 19 |
| Alaska | Personal & laundry | 3,826 | $40,793 | $13,211 | 2 | 32.4% | 8 |
| Connecticut | Personal & laundry | 29,362 | $45,297 | $12,984 | 3 | 28.7% | 26 |
| Washington | Personal & laundry | 46,977 | $39,211 | $12,655 | 4 | 32.3% | 11 |
| Massachusetts | Personal & laundry | 57,972 | $38,541 | $12,480 | 5 | 32.4% | 9 |
| Vermont | Personal & laundry | 4,772 | $36,330 | $12,268 | 6 | 33.8% | 4 |
| Oregon | Personal & laundry | 28,334 | $35,249 | $12,180 | 7 | 34.6% | 3 |
| Rhode Island | Personal & laundry | 10,226 | $33,693 | $11,723 | 8 | 34.8% | 2 |
| Maine | Personal & laundry | 10,355 | $37,047 | $11,428 | 9 | 30.8% | 16 |
| South Dakota | Personal & laundry | 6,444 | $34,951 | $11,410 | 10 | 32.6% | 7 |
| Wisconsin | Personal & laundry | 39,803 | $35,280 | $11,304 | 11 | 32.0% | 13 |
| Hawaii | Personal & laundry | 13,074 | $37,328 | $11,201 | 12 | 30.0% | 21 |
| Minnesota | Personal & laundry | 36,894 | $36,294 | $10,964 | 13 | 30.2% | 20 |
| Nebraska | Personal & laundry | 16,055 | $32,975 | $10,879 | 14 | 33.0% | 6 |
| North Dakota | Personal & laundry | 5,656 | $35,526 | $10,597 | 15 | 29.8% | 22 |
| Montana | Personal & laundry | 9,141 | $31,579 | $10,440 | 16 | 33.1% | 5 |
| New York | Personal & laundry | 172,882 | $27,928 | $10,171 | 17 | 36.4% | 1 |
| Kansas | Personal & laundry | 20,110 | $32,949 | $10,125 | 18 | 30.7% | 17 |
| Colorado | Personal & laundry | 52,186 | $31,740 | $9,947 | 19 | 31.3% | 14 |
| Wyoming | Personal & laundry | 4,675 | $30,090 | $9,725 | 20 | 32.3% | 10 |
| West Virginia | Personal & laundry | 10,207 | $33,331 | $9,615 | 21 | 28.8% | 25 |
| Arizona | Personal & laundry | 58,882 | $35,901 | $9,565 | 22 | 26.6% | 32 |
| New Mexico | Personal & laundry | 12,477 | $33,162 | $9,491 | 23 | 28.6% | 27 |
| Indiana | Personal & laundry | 54,279 | $29,162 | $9,364 | 24 | 32.1% | 12 |
| California | Personal & laundry | 394,575 | $34,237 | $9,265 | 25 | 27.1% | 30 |
| Pennsylvania | Personal & laundry | 88,470 | $35,982 | $9,233 | 26 | 25.7% | 36 |
| Kentucky | Personal & laundry | 34,480 | $29,907 | $9,229 | 27 | 30.9% | 15 |
| Iowa | Personal & laundry | 22,847 | $32,687 | $9,229 | 28 | 28.2% | 29 |
| Ohio | Personal & laundry | 92,699 | $30,809 | $9,012 | 29 | 29.2% | 23 |
| New Jersey | Personal & laundry | 77,967 | $40,773 | $8,929 | 30 | 21.9% | 42 |
| Missouri | Personal & laundry | 50,286 | $31,976 | $8,485 | 31 | 26.5% | 33 |
| Nevada | Personal & laundry | 34,102 | $31,247 | $8,352 | 32 | 26.7% | 31 |
| North Carolina | Personal & laundry | 100,323 | $29,483 | $8,346 | 33 | 28.3% | 28 |
| Tennessee | Personal & laundry | 81,116 | $37,455 | $7,889 | 34 | 21.1% | 43 |
| Idaho | Personal & laundry | 15,642 | $30,000 | $7,763 | 35 | 25.9% | 34 |
| Oklahoma | Personal & laundry | 34,628 | $30,862 | $7,665 | 36 | 24.8% | 40 |
| Michigan | Personal & laundry | 102,498 | $26,214 | $7,604 | 37 | 29.0% | 24 |
| Virginia | Personal & laundry | 81,010 | $29,111 | $7,473 | 38 | 25.7% | 35 |
| District of Columbia | Personal & laundry | 6,317 | $23,562 | $7,203 | 39 | 30.6% | 18 |
| South Carolina | Personal & laundry | 54,486 | $29,378 | $6,872 | 40 | 23.4% | 41 |
| Arkansas | Personal & laundry | 26,965 | $27,616 | $6,864 | 41 | 24.9% | 39 |
| Utah | Personal & laundry | 28,440 | $26,853 | $6,832 | 42 | 25.4% | 38 |
| Delaware | Personal & laundry | 7,600 | $33,062 | $6,793 | 43 | 20.5% | 44 |
| Illinois | Personal & laundry | 117,783 | $24,466 | $6,240 | 44 | 25.5% | 37 |
| Maryland | Personal & laundry | 61,854 | $29,001 | $5,744 | 45 | 19.8% | 45 |
| Alabama | Personal & laundry | 53,700 | $25,964 | $5,012 | 46 | 19.3% | 46 |
| Texas | Personal & laundry | 339,623 | $30,222 | $4,871 | 47 | 16.1% | 49 |
| Florida | Personal & laundry | 331,922 | $24,834 | $4,595 | 48 | 18.5% | 47 |
| Mississippi | Personal & laundry | 36,416 | $22,715 | $3,993 | 49 | 17.6% | 48 |
| Louisiana | Personal & laundry | 58,212 | $23,484 | $3,481 | 50 | 14.8% | 50 |
| Georgia | Personal & laundry | 157,942 | $22,429 | $2,326 | 51 | 10.4% | 51 |
| Washington | Social assistance | 11,083 | $57,262 | $19,822 | 1 | 34.6% | 14 |
| Vermont | Social assistance | 1,513 | $48,388 | $19,785 | 2 | 40.9% | 4 |
| Massachusetts | Social assistance | 13,573 | $45,755 | $19,597 | 3 | 42.8% | 2 |
| Alaska | Social assistance | 1,203 | $46,481 | $18,082 | 4 | 38.9% | 8 |
| Connecticut | Social assistance | 9,558 | $37,197 | $15,527 | 5 | 41.7% | 3 |
| Minnesota | Social assistance | 11,874 | $41,487 | $15,497 | 6 | 37.4% | 11 |
| Oregon | Social assistance | 7,529 | $39,146 | $15,462 | 7 | 39.5% | 7 |
| New York | Social assistance | 44,433 | $35,233 | $14,248 | 8 | 40.4% | 5 |
| North Dakota | Social assistance | 2,319 | $40,676 | $13,945 | 9 | 34.3% | 16 |
| South Dakota | Social assistance | 2,233 | $37,141 | $13,801 | 10 | 37.2% | 12 |
| Montana | Social assistance | 1,864 | $44,082 | $13,781 | 11 | 31.3% | 32 |
| New Hampshire | Social assistance | 1,725 | $66,831 | $13,646 | 12 | 20.4% | 51 |
| Wisconsin | Social assistance | 8,867 | $41,424 | $13,538 | 13 | 32.7% | 26 |
| New Jersey | Social assistance | 16,849 | $35,717 | $13,412 | 14 | 37.6% | 10 |
| Rhode Island | Social assistance | 2,086 | $27,265 | $13,308 | 15 | 48.8% | 1 |
| Maine | Social assistance | 2,698 | $43,958 | $13,280 | 16 | 30.2% | 35 |
| Colorado | Social assistance | 10,469 | $32,003 | $12,868 | 17 | 40.2% | 6 |
| Kansas | Social assistance | 5,879 | $34,099 | $12,840 | 18 | 37.7% | 9 |
| West Virginia | Social assistance | 2,222 | $39,562 | $12,683 | 19 | 32.1% | 29 |
| New Mexico | Social assistance | 2,895 | $38,284 | $12,452 | 20 | 32.5% | 27 |
| Pennsylvania | Social assistance | 17,330 | $36,469 | $12,440 | 21 | 34.1% | 18 |
| Wyoming | Social assistance | 1,106 | $44,431 | $11,701 | 22 | 26.3% | 46 |
| Oklahoma | Social assistance | 6,348 | $38,695 | $11,563 | 23 | 29.9% | 38 |
| Delaware | Social assistance | 1,395 | $41,534 | $11,561 | 24 | 27.8% | 44 |
| Hawaii | Social assistance | 1,507 | $36,029 | $11,461 | 25 | 31.8% | 31 |
| California | Social assistance | 102,178 | $33,521 | $11,430 | 26 | 34.1% | 19 |
| Indiana | Social assistance | 10,290 | $33,094 | $11,312 | 27 | 34.2% | 17 |
| Missouri | Social assistance | 9,764 | $34,369 | $11,173 | 28 | 32.5% | 28 |
| Kentucky | Social assistance | 5,903 | $32,850 | $10,880 | 29 | 33.1% | 23 |
| Tennessee | Social assistance | 11,798 | $37,423 | $10,513 | 30 | 28.1% | 42 |
| Nebraska | Social assistance | 5,161 | $29,884 | $10,280 | 31 | 34.4% | 15 |
| Idaho | Social assistance | 2,975 | $38,699 | $10,188 | 32 | 26.3% | 47 |
| Michigan | Social assistance | 18,979 | $30,352 | $10,109 | 33 | 33.3% | 22 |
| Ohio | Social assistance | 20,163 | $30,176 | $9,923 | 34 | 32.9% | 24 |
| Iowa | Social assistance | 8,898 | $28,819 | $9,598 | 35 | 33.3% | 21 |
| Illinois | Social assistance | 30,320 | $27,797 | $9,463 | 36 | 34.0% | 20 |
| District of Columbia | Social assistance | 1,441 | $26,137 | $9,414 | 37 | 36.0% | 13 |
| Maryland | Social assistance | 14,918 | $31,147 | $9,349 | 38 | 30.0% | 36 |
| Arkansas | Social assistance | 3,753 | $27,894 | $9,166 | 39 | 32.9% | 25 |
| North Carolina | Social assistance | 15,122 | $27,401 | $8,765 | 40 | 32.0% | 30 |
| Virginia | Social assistance | 15,658 | $28,081 | $8,586 | 41 | 30.6% | 33 |
| Arizona | Social assistance | 11,487 | $28,578 | $8,557 | 42 | 29.9% | 37 |
| Utah | Social assistance | 4,533 | $28,931 | $8,251 | 43 | 28.5% | 40 |
| Alabama | Social assistance | 7,160 | $30,517 | $8,186 | 44 | 26.8% | 45 |
| South Carolina | Social assistance | 7,552 | $24,794 | $7,536 | 45 | 30.4% | 34 |
| Nevada | Social assistance | 5,853 | $25,106 | $7,041 | 46 | 28.0% | 43 |
| Mississippi | Social assistance | 7,190 | $23,708 | $6,683 | 47 | 28.2% | 41 |
| Florida | Social assistance | 38,770 | $22,166 | $6,601 | 48 | 29.8% | 39 |
| Texas | Social assistance | 53,326 | $26,229 | $5,732 | 49 | 21.9% | 49 |
| Louisiana | Social assistance | 10,119 | $23,390 | $5,549 | 50 | 23.7% | 48 |
| Georgia | Social assistance | 22,401 | $19,452 | $4,029 | 51 | 20.7% | 50 |
| New Hampshire | Specialty trade | 11,375 | $193,550 | $35,192 | 1 | 18.2% | 12 |
| Connecticut | Specialty trade | 24,321 | $171,408 | $29,516 | 2 | 17.2% | 21 |
| Tennessee | Specialty trade | 49,868 | $200,895 | $27,641 | 3 | 13.8% | 38 |
| Alaska | Specialty trade | 2,543 | $151,494 | $26,298 | 4 | 17.4% | 19 |
| New Jersey | Specialty trade | 39,177 | $164,215 | $25,836 | 5 | 15.7% | 29 |
| Washington | Specialty trade | 21,782 | $133,268 | $25,461 | 6 | 19.1% | 6 |
| Hawaii | Specialty trade | 4,519 | $136,014 | $25,108 | 7 | 18.5% | 9 |
| Massachusetts | Specialty trade | 43,836 | $112,620 | $25,096 | 8 | 22.3% | 2 |
| North Dakota | Specialty trade | 3,466 | $154,442 | $24,848 | 9 | 16.1% | 24 |
| Oregon | Specialty trade | 12,014 | $134,093 | $24,297 | 10 | 18.1% | 14 |
| Wisconsin | Specialty trade | 25,273 | $137,239 | $24,120 | 11 | 17.6% | 17 |
| Delaware | Specialty trade | 4,505 | $148,977 | $24,028 | 12 | 16.1% | 23 |
| South Dakota | Specialty trade | 4,863 | $135,531 | $23,480 | 13 | 17.3% | 20 |
| Pennsylvania | Specialty trade | 57,999 | $128,983 | $23,449 | 14 | 18.2% | 13 |
| Minnesota | Specialty trade | 24,764 | $121,392 | $23,272 | 15 | 19.2% | 5 |
| Ohio | Specialty trade | 56,879 | $129,907 | $22,675 | 16 | 17.5% | 18 |
| Montana | Specialty trade | 8,044 | $112,431 | $22,399 | 17 | 19.9% | 3 |
| Colorado | Specialty trade | 41,236 | $112,000 | $21,825 | 18 | 19.5% | 4 |
| Vermont | Specialty trade | 5,639 | $111,436 | $21,270 | 19 | 19.1% | 7 |
| Rhode Island | Specialty trade | 5,504 | $93,437 | $21,034 | 20 | 22.5% | 1 |
| Kansas | Specialty trade | 13,241 | $136,299 | $20,829 | 21 | 15.3% | 33 |
| California | Specialty trade | 125,199 | $110,453 | $20,090 | 22 | 18.2% | 11 |
| Maine | Specialty trade | 11,549 | $110,760 | $19,786 | 23 | 17.9% | 15 |
| Indiana | Specialty trade | 28,233 | $120,012 | $19,630 | 24 | 16.4% | 22 |
| Iowa | Specialty trade | 15,300 | $133,177 | $19,053 | 25 | 14.3% | 35 |
| Wyoming | Specialty trade | 3,131 | $119,969 | $18,827 | 26 | 15.7% | 30 |
| Michigan | Specialty trade | 43,984 | $102,630 | $18,773 | 27 | 18.3% | 10 |
| Nebraska | Specialty trade | 10,398 | $116,138 | $18,291 | 28 | 15.7% | 28 |
| Idaho | Specialty trade | 10,804 | $118,179 | $18,187 | 29 | 15.4% | 32 |
| Missouri | Specialty trade | 28,729 | $130,050 | $17,849 | 30 | 13.7% | 39 |
| North Carolina | Specialty trade | 67,151 | $110,700 | $17,671 | 31 | 16.0% | 26 |
| Kentucky | Specialty trade | 23,566 | $115,522 | $17,442 | 32 | 15.1% | 34 |
| New York | Specialty trade | 63,215 | $92,476 | $16,400 | 33 | 17.7% | 16 |
| Arizona | Specialty trade | 30,154 | $118,984 | $16,397 | 34 | 13.8% | 37 |
| Arkansas | Specialty trade | 18,407 | $111,576 | $15,669 | 35 | 14.0% | 36 |
| New Mexico | Specialty trade | 6,901 | $122,230 | $15,641 | 36 | 12.8% | 40 |
| South Carolina | Specialty trade | 31,007 | $123,539 | $15,308 | 37 | 12.4% | 43 |
| Illinois | Specialty trade | 42,117 | $80,422 | $15,240 | 38 | 18.9% | 8 |
| West Virginia | Specialty trade | 4,933 | $129,210 | $15,208 | 39 | 11.8% | 44 |
| Alabama | Specialty trade | 25,863 | $133,236 | $14,982 | 40 | 11.2% | 45 |
| Maryland | Specialty trade | 34,821 | $94,441 | $14,929 | 41 | 15.8% | 27 |
| Oklahoma | Specialty trade | 23,212 | $119,531 | $14,917 | 42 | 12.5% | 41 |
| Virginia | Specialty trade | 46,702 | $93,423 | $14,637 | 43 | 15.7% | 31 |
| Texas | Specialty trade | 224,434 | $128,082 | $13,818 | 44 | 10.8% | 46 |
| Utah | Specialty trade | 12,283 | $106,887 | $13,257 | 45 | 12.4% | 42 |
| Nevada | Specialty trade | 8,319 | $119,504 | $11,323 | 46 | 9.5% | 49 |
| Mississippi | Specialty trade | 18,185 | $117,144 | $11,319 | 47 | 9.7% | 48 |
| Florida | Specialty trade | 125,600 | $64,295 | $10,288 | 48 | 16.0% | 25 |
| District of Columbia | Specialty trade | 1,052 | $95,092 | $9,308 | 49 | 9.8% | 47 |
| Georgia | Specialty trade | 70,425 | $96,181 | $7,638 | 50 | 7.9% | 50 |
| Louisiana | Specialty trade | 26,209 | $94,474 | $6,924 | 51 | 7.3% | 51 |
FAQ
Where do I find net profit on Schedule C?
On an individual return, Schedule C net profit is the published bottom-line profit figure (commonly line 31). This page does not walk through filing. It reports IRS SOI state × industry averages of that net-profit concept for tax year 2023 (nonfarm sole proprietorships). See Methods for codes and limits.
Which state has the highest average specialty-trade sole-prop net profit?
On this page’s TY2023 SOI table for specialty trade contractors (NAICS 238), New Hampshire leads average net profit at $35,192; Louisiana is lowest among published cells at $6,924. U.S. baseline average net is $17,644 (15.1% margin). Figures are SOI averages, not owner take-home pay.
Do high Schedule C receipts mean high profit margins?
Often no. For specialty trades on this page, only 1 of 10 top-receipt states also ranks in the top 10 for margin, and receipts↔margin Spearman correlation is about −0.009 (essentially zero). Admin & support shows only 2/10 overlap with top margins.
Is this a guide to calculating Schedule C net income?
No. This is an IRS SOI averages research map by state and industry — not tax advice and not an IRS / TurboTax form tutorial. Use the IRS instructions or a qualified preparer for filing questions.
Planning context — guides and insurance
If your next step is to organize an LLC, the LLC filing and setup guide covers the process and available help. For investment in the operation, compare equipment financing using your own cash flow and purchase quotes.
Use these figures alongside startup guides and coverage decisions — not instead of them:
- Industry hubs: cleaning, landscaping, HVAC, daycare, hair salon
- Industry statistics: cleaning, landscaping, HVAC, daycare, salon
- Related research: service businesses without employees, service business size, federal service-contract dollars by state
- Insurance (when you are ready for coverage): cleaning business insurance, HVAC insurance, daycare insurance
Quick answers to common LLC questions: LLC or sole proprietorship? · LLC vs. S corp · DBA vs. LLC
Methods, codes, and limits
Data source and calculations
Primary file: IRS SOI 23sp01st.xlsx — Table 1, Nonfarm Sole Proprietorships by industry and state, Tax Year 2023. Average net = net profit or (loss) (line 31) ÷ number of Schedules C. Margin = net profit ÷ business receipts (line 3). Suppressions (d) are never treated as zero; none occurred in these 4×51 cells.
NAICS mapping (coarse by design)
561 Administrative and Support Services — cleaning and landscaping audiences share this code with other admin/support activities.
238 Specialty Trade Contractors — HVAC/plumbing audiences share this code with other specialty trades.
624 Social Assistance — daycare audiences share this code with other social assistance.
812 Personal and Laundry Services — salon/personal-care audiences share this code with laundry and related services.
Partnership secondary (U.S. only)
| Industry | Sole-prop margin | Partnership margin | Forms 1065 |
|---|---|---|---|
| Admin & support | 22.3% | 7.8% | 74,091 |
| Specialty trade | 15.1% | 7.0% | 88,654 |
| Social assistance | 33.0% | 7.6% | 10,519 |
| Personal & laundry | 24.9% | 5.4% | 92,354 |
Partnership ordinary business income (Form 1065 line 22) is not Schedule C net profit. Shown only at U.S. level for context.
Limitations
- Sole proprietorships only — not all LLCs, S-corps, or C-corps.
- Net profit ≠ owner take-home after SE tax, income tax, or living costs.
- Filing ZIP may differ from where work is performed.
- Multiple Schedules C can attach to one Form 1040.
- Arithmetic means, not medians; industry mix inside each 3-digit code varies by state.
Public references & download
IRS SOI unincorporated business state and county data · CSV: sole-prop-profit-by-state-2023.csv. Archived source checksums retained with this study.
Dataset license and reuse
Reuse terms, version September 27, 2026. You may quote our original findings and summary statistics with credit to StartBusinessByState.com and a link to this page. Keep the source names, data years, units and relevant limitations with quoted figures.
This permission covers our original contributions to this dataset. It does not relicense underlying source data or grant blanket permission to redistribute third-party datasets. Source data retains its provider’s terms, and public-domain material remains public domain. Any additional reuse permissions stated elsewhere on this page still apply. For other reuse of our original material, contact us.