By StartBusinessByStatePublisher: Robert SmithResearch process
Startup activity · November 15, 2026 edition
Americans filed 5,360,944 business applications from January through October 2026, 10.9% more than a year earlier. That is the highest January–October total in the Census Bureau’s series, with complete comparable periods starting in 2005. This study ranks all 50 states and Washington, DC by applications per resident and lets you explore the latest annual figures for 3,144 counties and county equivalents.
Florida leads in total applications; Wyoming leads per resident; Alaska has the fastest year-over-year growth. Those are three different ways to measure the boom. Applications measure business-starting activity, not how many businesses opened, hired workers or became profitable.
State figures: January–October 2026. County figures: the 2025 reporting year. Both use July 1, 2025 resident populations. Research and calculations by StartBusinessByState.com, using U.S. Census Bureau sources linked below.
Ready to join the business owners getting started?
Move from application statistics to your own company filing and records. The LLC setup guide gives you the formation steps and service options.
Where are people applying to start businesses?
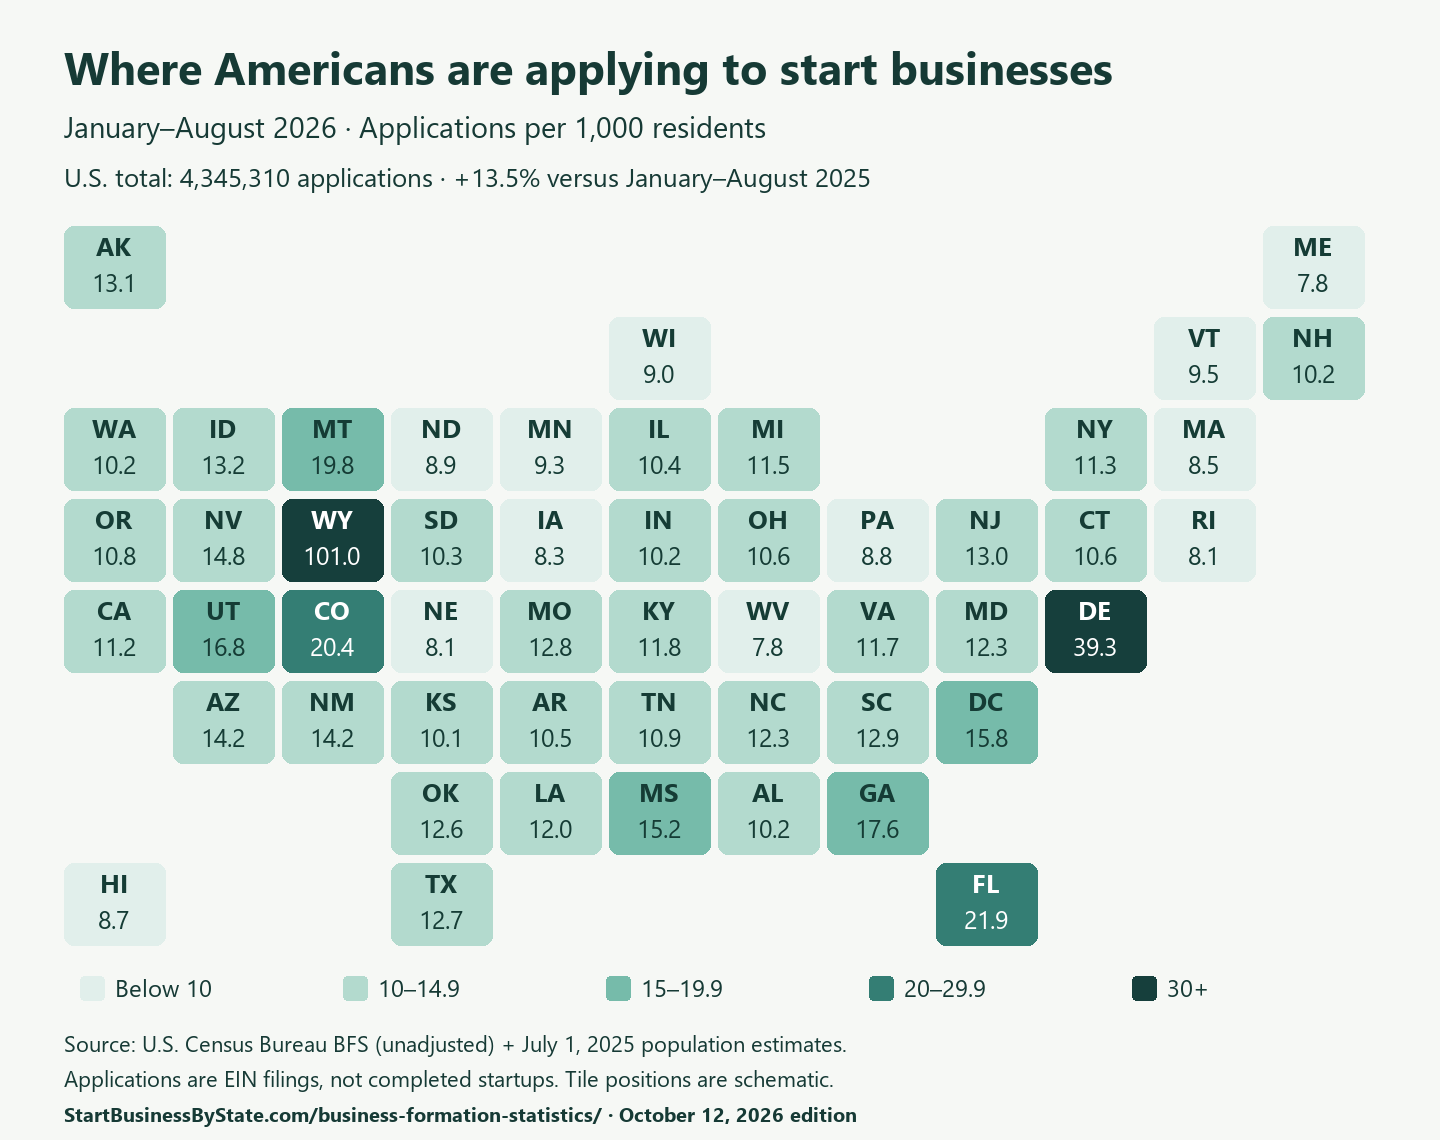
Wyoming records 126.16 applications per 1,000 residents, followed by Delaware at 48.81 and Florida at 26.78. At 628,404 applications, Florida accounts for 11.7% of the U.S. total. Montana has the fourth-highest per-capita rate at 25.11, just ahead of Colorado at 24.62.
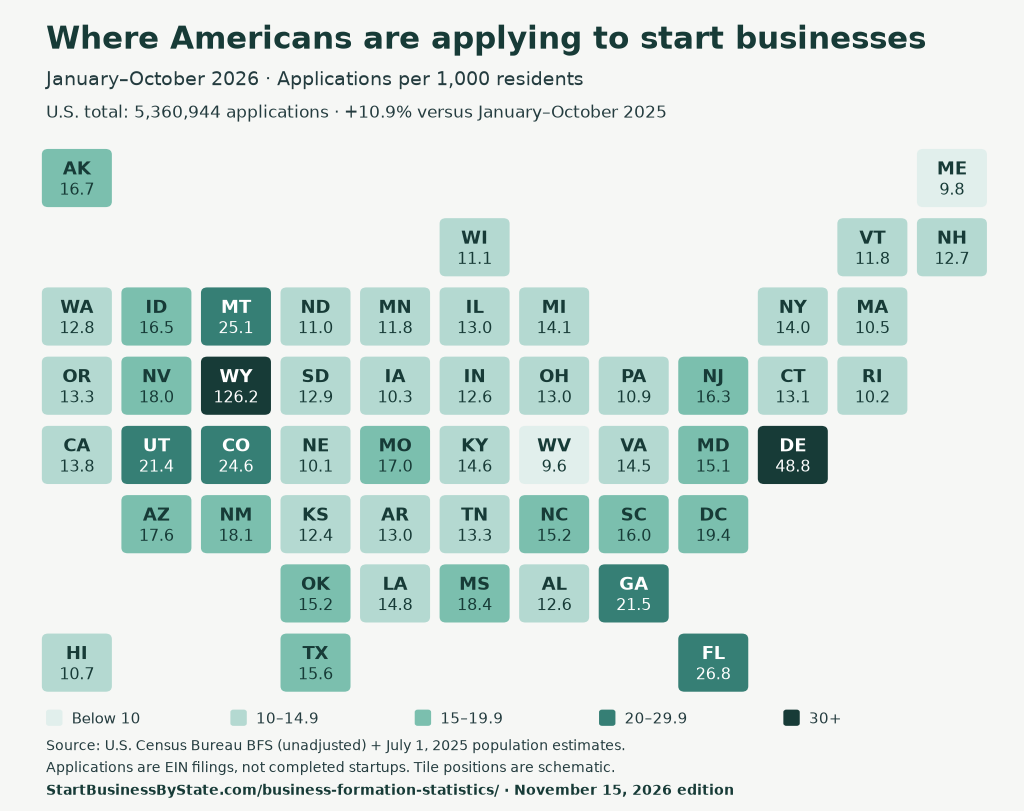
High rates in places such as Wyoming and Delaware can reflect where applications are recorded rather than where customers, workers and owners all live. This dataset does not establish the cause of an outlier. Keep those states in the ranking, but do not read their rates as local job creation or a recommendation to form there. For the practical decision, compare LLC filing and ongoing costs by state.
Business applications by state: the full ranking
Ranked by applications per 1,000 residents, using unrounded values. Growth compares January–October 2026 with January–October 2025. Census counts each month in whole weeks, and January–October 2026 covers 43 weeks (January 4 to October 31), one fewer than the same months of 2025, so these growth figures are, if anything, a little low. The final column is the share Census classifies as high-propensity: applications with characteristics associated with becoming an employer.
| Rank | State | Applications | Per 1,000 residents | Growth vs. 2025 | High-propensity share |
|---|---|---|---|---|---|
| 1 | Wyoming | 74,278 | 126.16 | +8.6% | 23.3% |
| 2 | Delaware | 51,739 | 48.81 | -1.1% | 35.1% |
| 3 | Florida | 628,404 | 26.78 | +11.7% | 27.8% |
| 4 | Montana | 28,740 | 25.11 | +13.4% | 26.5% |
| 5 | Colorado | 148,051 | 24.62 | +20.4% | 24.3% |
| 6 | Georgia | 242,553 | 21.46 | +11.5% | 25.0% |
| 7 | Utah | 75,718 | 21.40 | +24.9% | 24.4% |
| 8 | District of Columbia | 13,426 | 19.36 | +5.0% | 27.3% |
| 9 | Mississippi | 54,385 | 18.41 | +22.9% | 23.7% |
| 10 | New Mexico | 38,448 | 18.09 | +10.9% | 27.4% |
| 11 | Nevada | 59,187 | 18.03 | +6.4% | 26.2% |
| 12 | Arizona | 134,000 | 17.58 | +18.6% | 25.2% |
| 13 | Missouri | 106,561 | 16.99 | +25.0% | 22.4% |
| 14 | Alaska | 12,308 | 16.69 | +43.2% | 23.4% |
| 15 | Idaho | 33,401 | 16.46 | +16.8% | 28.9% |
| 16 | New Jersey | 155,741 | 16.31 | +13.5% | 26.3% |
| 17 | South Carolina | 88,878 | 15.96 | +9.4% | 24.9% |
| 18 | Texas | 493,173 | 15.55 | +6.8% | 26.9% |
| 19 | North Carolina | 170,683 | 15.24 | +9.6% | 27.3% |
| 20 | Oklahoma | 62,488 | 15.15 | +28.4% | 29.7% |
| 21 | Maryland | 94,872 | 15.14 | +10.1% | 27.6% |
| 22 | Louisiana | 68,504 | 14.83 | +8.6% | 25.3% |
| 23 | Kentucky | 67,490 | 14.65 | +27.4% | 22.8% |
| 24 | Virginia | 129,126 | 14.54 | +9.8% | 26.3% |
| 25 | Michigan | 143,224 | 14.14 | +12.0% | 25.8% |
| 26 | New York | 279,583 | 13.98 | +9.2% | 37.1% |
| 27 | California | 541,320 | 13.75 | +13.9% | 34.7% |
| 28 | Oregon | 56,862 | 13.31 | +4.8% | 27.7% |
| 29 | Tennessee | 97,303 | 13.30 | +11.2% | 28.3% |
| 30 | Connecticut | 48,487 | 13.15 | +14.6% | 27.0% |
| 31 | Ohio | 154,989 | 13.02 | +9.8% | 24.9% |
| 32 | Arkansas | 40,391 | 12.97 | +21.2% | 26.8% |
| 33 | Illinois | 164,713 | 12.95 | +3.8% | 30.5% |
| 34 | South Dakota | 12,051 | 12.89 | +16.5% | 26.5% |
| 35 | Washington | 102,031 | 12.75 | -18.5% | 28.2% |
| 36 | New Hampshire | 17,917 | 12.66 | +25.1% | 28.0% |
| 37 | Alabama | 65,409 | 12.60 | +11.4% | 25.5% |
| 38 | Indiana | 87,541 | 12.55 | +13.5% | 26.8% |
| 39 | Kansas | 36,821 | 12.37 | +17.4% | 28.0% |
| 40 | Vermont | 7,607 | 11.80 | +16.1% | 30.7% |
| 41 | Minnesota | 68,703 | 11.78 | +9.0% | 25.7% |
| 42 | Wisconsin | 66,090 | 11.07 | +11.4% | 26.5% |
| 43 | North Dakota | 8,753 | 10.95 | +15.1% | 30.1% |
| 44 | Pennsylvania | 142,971 | 10.95 | +5.4% | 28.5% |
| 45 | Hawaii | 15,288 | 10.67 | -9.1% | 29.3% |
| 46 | Massachusetts | 75,023 | 10.49 | +11.0% | 34.2% |
| 47 | Iowa | 33,206 | 10.25 | +10.5% | 27.2% |
| 48 | Rhode Island | 11,323 | 10.16 | +10.9% | 29.3% |
| 49 | Nebraska | 20,355 | 10.09 | +5.4% | 29.2% |
| 50 | Maine | 13,892 | 9.82 | +14.2% | 31.9% |
| 51 | West Virginia | 16,937 | 9.59 | +21.2% | 27.9% |
Per-capita figures are ten-month application counts divided by the full resident population; they are not annualized and are not percentages of residents starting businesses.
Which states have the fastest application growth?
Alaska leads at +43.2%, followed by Oklahoma (+28.4%) and Kentucky (+27.4%). Growth and size tell different stories: Alaska’s increase represents 3,716 additional applications, while Florida’s smaller percentage increase represents 65,601. Three places had fewer applications than a year earlier: Washington (-18.5%), Hawaii (-9.1%) and Delaware (-1.1%).
| State | Jan–Oct 2025 | Jan–Oct 2026 | Growth |
|---|---|---|---|
| Alaska | 8,592 | 12,308 | +43.2% |
| Oklahoma | 48,656 | 62,488 | +28.4% |
| Kentucky | 52,986 | 67,490 | +27.4% |
| New Hampshire | 14,326 | 17,917 | +25.1% |
| Missouri | 85,230 | 106,561 | +25.0% |
Find your county’s business application ranking
Search any of the 3,144 counties and county equivalents, including parishes, independent cities, Alaska boroughs and Connecticut planning regions. The default view compares the 621 places with at least 100,000 residents; switch the population filter to include smaller places.
Among that larger-population group, Laramie County, Wyoming leads at 144.79 applications per 1,000 residents, followed by Kent County, Delaware (127.46) and Flathead County, Montana (75.60). Miami-Dade ranks fourth (48.45). Rankings describe application activity, not a forecast of business success.
Different reporting period: these are 2025 county figures covering 53 weeks, December 29, 2024–January 3, 2026. They are not 2026 year-to-date counts. Census applies privacy adjustments to county counts; small differences should not be treated as exact.
Top 25 of 621 counties with at least 100,000 residents, ranked by applications per resident. Full data in the county CSV.
| U.S. rank, 100k+ | County or equivalent | State | 2025 applications | 2025 population | Per 1,000 residents |
|---|---|---|---|---|---|
| 1 | Laramie County | WY | 14,904 | 102,938 | 144.79 |
| 2 | Kent County | DE | 24,828 | 194,786 | 127.46 |
| 3 | Flathead County | MT | 8,727 | 115,429 | 75.60 |
| 4 | Miami-Dade County | FL | 135,758 | 2,802,029 | 48.45 |
| 5 | New Castle County | DE | 28,427 | 588,026 | 48.34 |
| 6 | Fulton County | GA | 49,873 | 1,098,791 | 45.39 |
| 7 | Denver County | CO | 30,899 | 740,613 | 41.72 |
| 8 | Pinellas County | FL | 38,333 | 948,563 | 40.41 |
| 9 | Albany County | NY | 12,859 | 321,225 | 40.03 |
| 10 | Cass County | MO | 4,601 | 115,859 | 39.71 |
| 11 | Broward County | FL | 72,422 | 2,013,317 | 35.97 |
| 12 | Travis County | TX | 48,974 | 1,389,670 | 35.24 |
| 13 | Bernalillo County | NM | 22,406 | 667,601 | 33.56 |
| 14 | New York County | NY | 54,695 | 1,664,862 | 32.85 |
| 15 | Missoula County | MT | 4,030 | 123,513 | 32.63 |
| 16 | Orange County | FL | 49,392 | 1,528,002 | 32.32 |
| 17 | Henrico County | VA | 10,881 | 342,775 | 31.74 |
| 18 | Madison County | KY | 3,170 | 101,696 | 31.17 |
| 19 | Palm Beach County | FL | 48,510 | 1,575,726 | 30.79 |
| 20 | Madison County | MS | 3,433 | 116,298 | 29.52 |
| 21 | Henry County | GA | 7,818 | 264,922 | 29.51 |
| 22 | Clayton County | GA | 8,474 | 297,471 | 28.49 |
| 23 | Charleston County | SC | 12,378 | 436,200 | 28.38 |
| 24 | Gallatin County | MT | 3,641 | 128,740 | 28.28 |
| 25 | Gwinnett County | GA | 28,636 | 1,018,099 | 28.13 |
Enable JavaScript to search the county table, or download all county rows as a CSV.
What this means if you are starting a business
Application activity is a starting point for researching your market. Use your state’s guide above to work through registration, local permits and insurance, then narrow your research to the customers and competitors you expect to serve. A busy state can have both strong demand and strong competition.
Starting your own business? Move from the application statistics to the LLC formation and business setup guide. It covers the filing process and services you can use to get the company organized.
Before filing, check your business name in the official state registry, compare state LLC processing times and prepare an operating agreement. Our best-states comparison adds other factors; its separately stated data window should not be confused with this refreshed ranking.
How many applications become employer businesses?
In January–October 2026, Census classified 1,509,593 applications as high-propensity, 28.2% of all applications. That classification is a signal based on application characteristics, not a count of businesses that have already hired.
The archived 2022 cohort below provides realized context: 296,531 of 5,062,563 applications became employers within four quarters, or 5.9%, in the previously published edition. Businesses operating without employees are outside that employer-formation measure. These historical figures are kept separate from the 2026 application ranking.
Archived 2022 employer-formation figures by state
Retained from this page’s September 15, 2026 verified edition; not refreshed or presented as 2026 outcomes. Duration is measured in quarters for applications that became employers within four quarters.
| State | Became employers within 4 quarters (2022) | Formations (2022) | Avg quarters to formation |
|---|---|---|---|
| Alabama | 5.0% | 3,583 | 1.27 |
| Alaska | 9.6% | 814 | 1.41 |
| Arizona | 5.5% | 6,335 | 1.46 |
| Arkansas | 6.1% | 2,292 | 1.31 |
| California | 9.0% | 43,666 | 1.39 |
| Colorado | 5.6% | 6,454 | 1.38 |
| Connecticut | 5.3% | 2,355 | 1.44 |
| Delaware | 3.6% | 1,645 | 1.45 |
| District of Columbia | 3.2% | 457 | 1.55 |
| Florida | 4.3% | 26,453 | 1.52 |
| Georgia | 3.7% | 10,228 | 1.46 |
| Hawaii | 4.8% | 887 | 1.48 |
| Idaho | 9.0% | 2,675 | 1.40 |
| Illinois | 5.5% | 9,272 | 1.46 |
| Indiana | 5.7% | 4,767 | 1.41 |
| Iowa | 7.8% | 2,338 | 1.33 |
| Kansas | 8.1% | 2,509 | 1.31 |
| Kentucky | 6.2% | 2,874 | 1.40 |
| Louisiana | 3.7% | 3,013 | 1.41 |
| Maine | 11.3% | 1,468 | 1.24 |
| Maryland | 3.9% | 3,849 | 1.56 |
| Massachusetts | 8.8% | 6,231 | 1.35 |
| Michigan | 4.9% | 6,763 | 1.43 |
| Minnesota | 6.8% | 4,181 | 1.46 |
| Mississippi | 3.4% | 1,902 | 1.34 |
| Missouri | 6.4% | 5,226 | 1.21 |
| Montana | 8.2% | 1,703 | 1.33 |
| Nebraska | 8.9% | 1,825 | 1.37 |
| Nevada | 5.8% | 3,603 | 1.43 |
| New Hampshire | 8.5% | 1,192 | 1.32 |
| New Jersey | 5.2% | 7,944 | 1.49 |
| New Mexico | 5.5% | 1,496 | 1.40 |
| New York | 6.4% | 18,950 | 1.48 |
| North Carolina | 5.6% | 9,264 | 1.40 |
| North Dakota | 9.9% | 793 | 1.33 |
| Ohio | 4.7% | 6,602 | 1.42 |
| Oklahoma | 5.7% | 3,157 | 1.34 |
| Oregon | 9.0% | 4,451 | 1.40 |
| Pennsylvania | 5.6% | 7,733 | 1.49 |
| Rhode Island | 9.4% | 1,023 | 1.28 |
| South Carolina | 4.8% | 4,393 | 1.45 |
| South Dakota | 10.4% | 1,091 | 1.19 |
| Tennessee | 5.9% | 5,408 | 1.32 |
| Texas | 6.0% | 28,048 | 1.40 |
| Utah | 6.9% | 4,498 | 1.42 |
| Vermont | 8.9% | 651 | 1.24 |
| Virginia | 5.1% | 6,368 | 1.48 |
| Washington | 8.7% | 7,775 | 1.41 |
| West Virginia | 6.5% | 894 | 1.34 |
| Wisconsin | 6.3% | 4,077 | 1.37 |
| Wyoming | 3.0% | 1,355 | 1.44 |
Use the map and data in your reporting
The state and county CSVs include source links, periods, the population denominator and a citation. Our original map and analysis are available under CC BY 4.0. Please credit and link to this study when reusing them. The underlying federal data remain available from Census under its own terms.
Suggested citation: StartBusinessByState.com, “Business Formation Statistics 2026: State & County Rankings,” November 15, 2026 edition. Analysis of U.S. Census Bureau Business Formation Statistics and Vintage 2025 population estimates.
Your next step: plan your LLC formation
Sources and methodology
- State applications: Census BFS monthly CSV, downloaded November 15, 2026 (Census release of November 12, 2026). Filter TOTAL industry, unadjusted series BA_BA and BA_HBA, all 50 states and DC. Sum January–October 2026; use the same months of 2025 for growth. State application sums reconcile to the national total for every included month.
- County applications: Census annual county release, published June 10, 2026; source workbook. Use BA2025. The county data dictionary defines a 53-week 2025 reporting year and privacy-adjusted counts. We do not publish county year-over-year growth: 2024 has 52 reporting weeks, and a raw comparison would mix period lengths.
- Population: Census Vintage 2025 estimates, July 1, 2025 populations; CO-EST2025-ALLDATA CSV. State summary rows provide the state denominators; five-digit FIPS joins match all 3,144 current counties and equivalents. Twelve historical workbook geographies without 2025 application values are excluded, not changed to zero.
- Calculations: applications ÷ population × 1,000; growth = (2026 applications ÷ 2025 applications − 1) × 100; high-propensity share = BA_HBA ÷ BA_BA × 100. Rank before rounding. County ranks are national within the selected population group and stay national when filtering to one state. Alphabetical/FIPS ordering breaks an exact numeric tie.
- Interpretation: see the official BFS methodology. EIN applications are not LLC registrations, unique owners, completed openings or jobs. Monthly state totals and annual county totals use different reporting clocks and can have different revisions; do not add the two datasets together. The population threshold limits small-denominator volatility but does not remove every outlier.
This is a dated edition, not an automatic live feed. State monthly data available when checked ended in October 2026; county data ended in the 2025 reporting year. Census may revise historical figures.